. 2016 May 31;113(22):6259-64.
doi: 10.1073/pnas.1600420113. Epub 2016 May 16.

Resistance to docetaxel in prostate cancer is associated with androgen receptor activation and loss of KDM5D expression

Affiliations

Resistance to docetaxel in prostate cancer is associated with androgen receptor activation and loss of KDM5D expression

Kazumasa Komura et al. Proc Natl Acad Sci U S A. .

Abstract

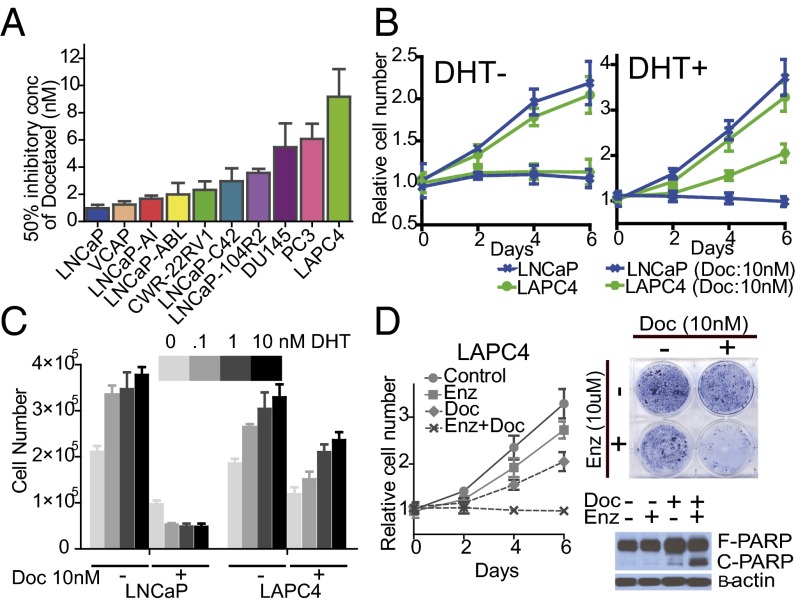
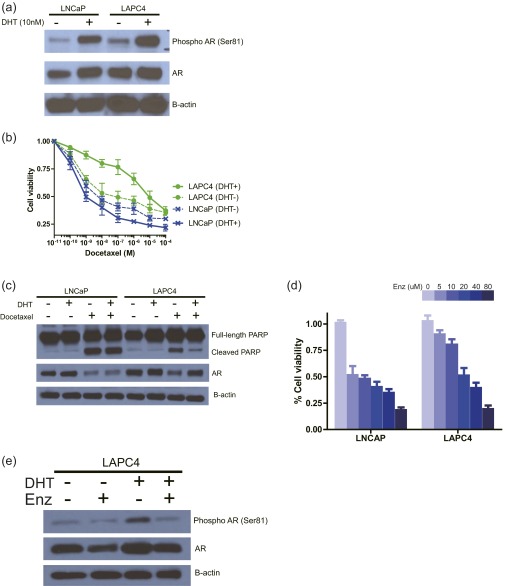
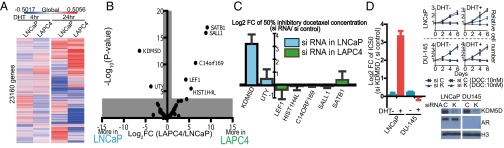
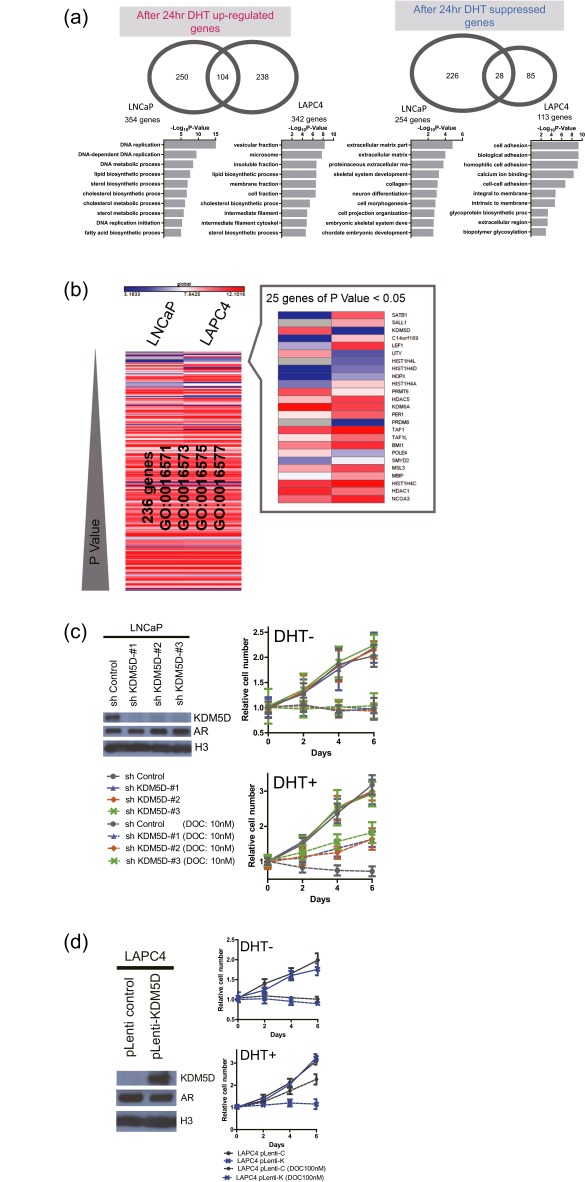
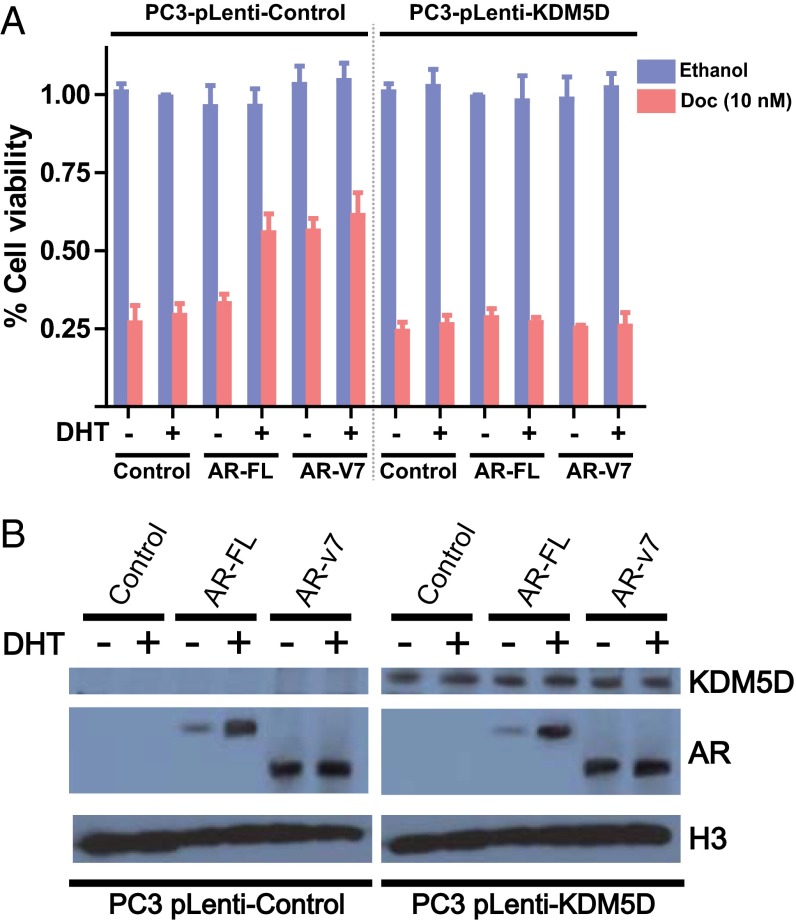
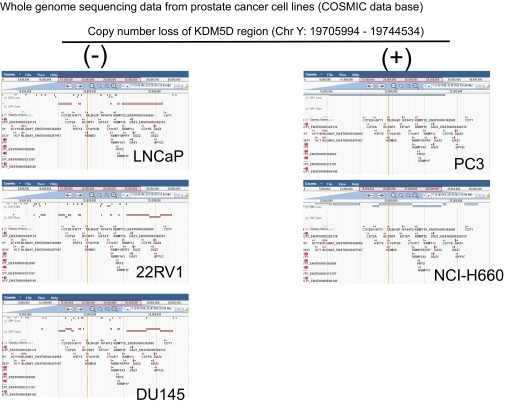
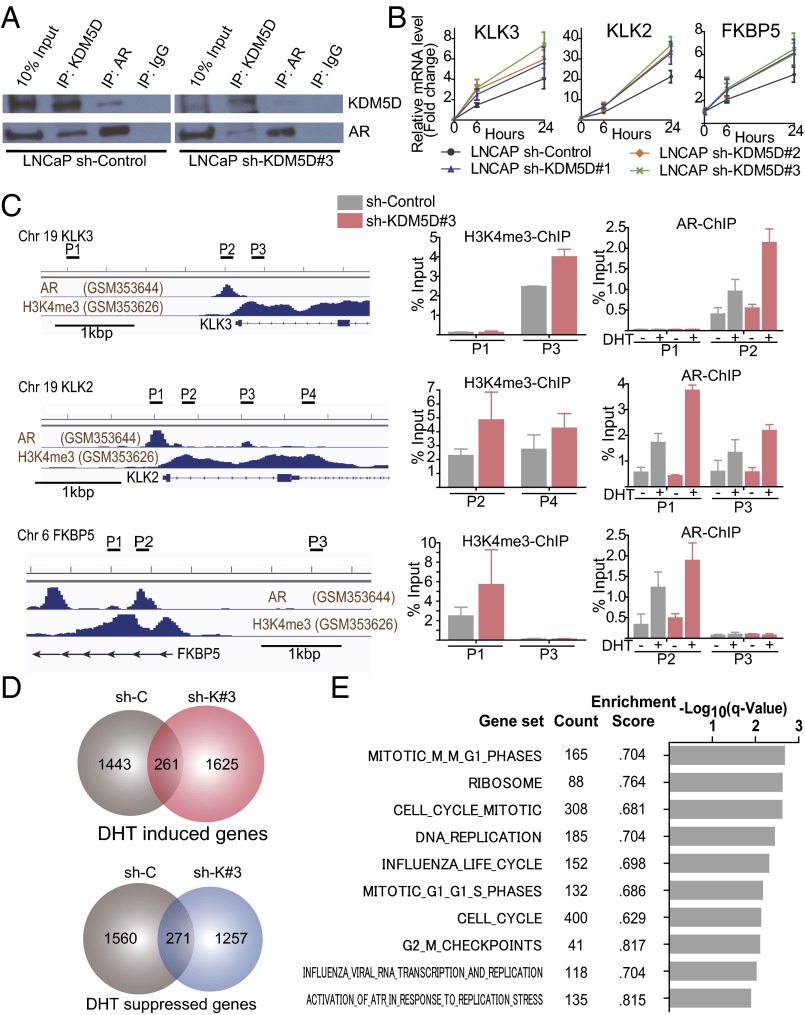
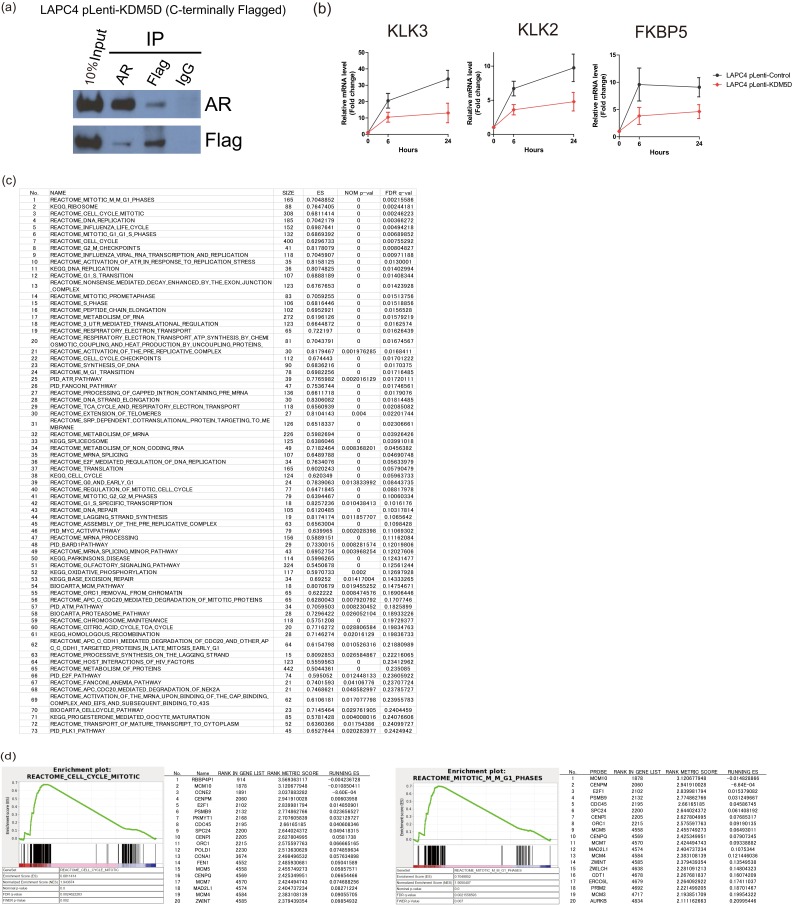
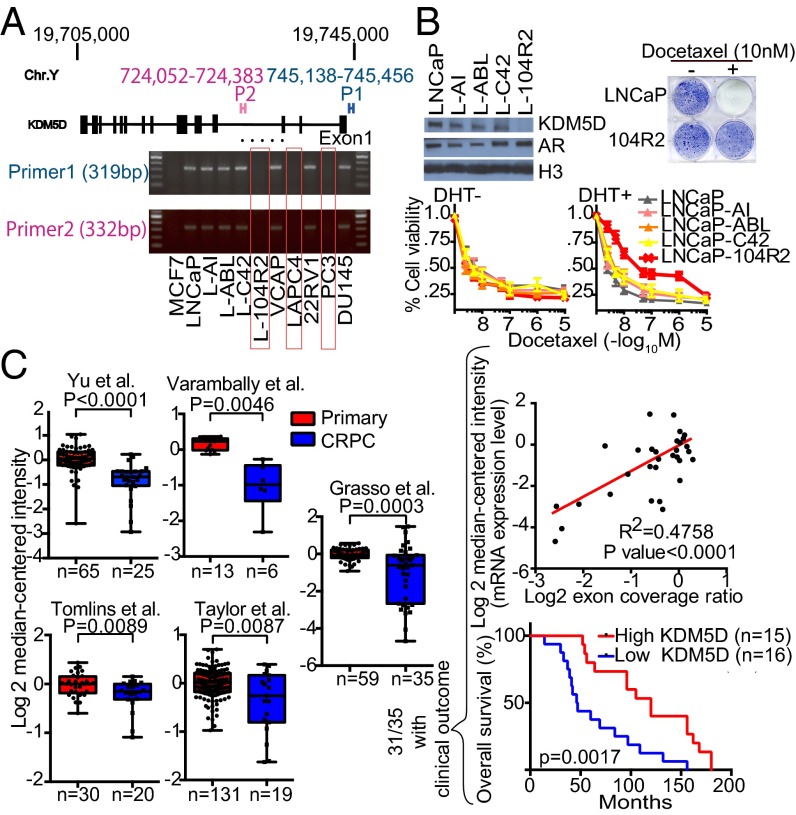
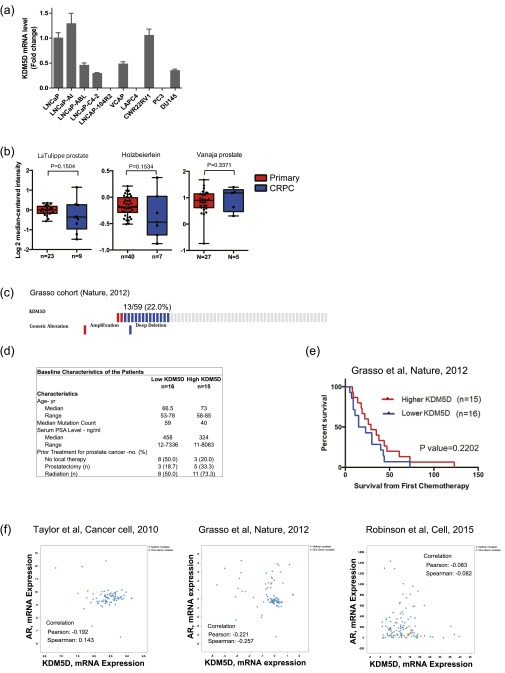
The androgen receptor (AR) plays an essential role in prostate cancer, and suppression of its signaling with androgen deprivation therapy (ADT) has been the mainstay of treatment for metastatic hormone-sensitive prostate cancer for more than 70 y. Chemotherapy has been reserved for metastatic castration-resistant prostate cancer (mCRPC). The Eastern Cooperative Oncology Group-led trial E3805: ChemoHormonal Therapy Versus Androgen Ablation Randomized Trial for Extensive Disease in Prostate Cancer (CHAARTED) showed that the addition of docetaxel to ADT prolonged overall survival compared with ADT alone in patients with metastatic hormone-sensitive prostate cancer. This finding suggests that there is an interaction between AR signaling activity and docetaxel sensitivity. Here we demonstrate that the prostate cancer cell lines LNCaP and LAPC4 display markedly different sensitivity to docetaxel with AR activation, and RNA-seq analysis of these cell lines identified KDM5D (lysine-specific demethylase 5D) encoded on the Y chromosome as a potential mediator of this sensitivity. Knocking down KDM5D expression in LNCaP leads to docetaxel resistance in the presence of dihydrotestosterone. KDM5D physically interacts with AR in the nucleus, and regulates its transcriptional activity by demethylating H3K4me3 active transcriptional marks. Attenuating KDM5D expression dysregulates AR signaling, resulting in docetaxel insensitivity. KDM5D deletion was also observed in the LNCaP-derived CRPC cell line 104R2, which displayed docetaxel insensitivity with AR activation, unlike parental LNCaP. Dataset analysis from the Oncomine database revealed significantly decreased KDM5D expression in CRPC and poorer prognosis with low KDM5D expression. Taking these data together, this work indicates that KDM5D modulates the AR axis and that this is associated with altered docetaxel sensitivity.

Keywords: JARID1D; KDM5D; androgen receptor; docetaxel; prostate cancer.


Conflict of interest statement

The authors declare no conflict of interest.

Figures

Fig. 1.
Fig. 1.
AR signaling impacts docetaxel sensitivity in a cell line-dependent manner. (A) Cells were cultured in 10% FBS media treated with different concentrations of docetaxel. GI50 of docetaxel was determined after 6 d of treatment. Results are expressed as mean ± SEM. (B) Cell growth of LNCaP and LAPC4 treated with and without 10 nM docetaxel in either 10% charcoal-stripped serum (CSS) media (Left) or 10% CSS with 10 nM DHT (Right) culture condition. Results are presented as relative values (mean ± SEM). (C) 1 × 10⁵ cells were plated on a six-well plate in 10% CSS media supplemented with the DHT concentrations as indicated. Cells were counted 6 d after treatment with and without 10 nM docetaxel in LNCaP and LAPC4 cell lines. Results are representative of three independent experiments (mean ± SEM). (D, Left) LAPC4 cells were treated with either or both 10 nM docetaxel and 10 μM enzalutamide in 10% CSS media supplemented with 10 nM DHT for 6 d. Results are presented as relative values (mean ± SEM). (D, Right Upper) Clonogenic survival assays in which 1 × 10⁴ LAPC4 cells were plated in a six-well plate and treated as indicated for 20 d. (D, Right Lower) LAPC4 cells were treated with either or both 10 μM enzalutamide and 10 nM docetaxel in 10% CSS media supplemented with 10 nM DHT for 48 h. Whole-cell lysates were collected and subjected to immunoblotting with the indicated antibodies.
Fig. S1.
Fig. S1.
(A) LNCaP and LAPC4 cells were cultured with and without 10 nM DHT in 10% CSS media. Twenty-four hours after DHT induction, whole-cell lysates were collected and subjected to immunoblotting with the indicated antibodies. (B) LNCaP and LAPC4 cells were treated with the indicated concentrations of docetaxel in 10% CSS media with and without 10 nM DHT for 6 d. The inhibitory effect on cell growth by docetaxel is presented as a relative value (mean ± SEM) compared with control as 100%. (C) LNCaP and LAPC4 cells were treated with and without 10 nM docetaxel in 10% CSS media with and without 10 nM DHT. After 48-h treatment, whole-cell lysates were collected and subjected to immunoblotting with the indicated antibodies. (D) Cells were treated with the indicated concentrations of enzalutamide in 10% CSS media supplemented with 10 nM DHT for 96 h. The inhibitory effect on cell growth is presented as a relative value (mean ± SEM) compared with control as 100%. (E) LAPC4 cells were treated with and without 10 μM enzalutamide in 10% CSS media with and without 10 nM DHT. After 24-h treatment, whole-cell lysates were collected and subjected to immunoblotting with the indicated antibodies.
Fig. 2.
Fig. 2.
KDM5D as a potential mediator of docetaxel sensitivity with DHT stimulation. (A) Heat map of RNA expression level (logtwofold change by 10 nM DHT) based on RNA-seq data with LNCaP and LAPC4 after 4- and 24-h DHT induction. The mean expression value of three independent experiments is presented. (B) Volcano plot of 236 genes (consisting of GO:0016573 histone acetylation, GO:0016575 histone deacetylation, GO:0016571 histone methylation, and GO:0016577 histone demethylation). The mean expression value of three independent experiments was used for the analysis. (C) LNCaP or LAPC4 was transfected with siRNA of the indicated targets (based on the expression level of the relevant gene) and negative control (50 nM) 2 d before treatment with docetaxel. Transfected cells were treated with varied docetaxel concentrations in 10% CSS media supplemented with 10 nM DHT for 6 d. GI50 of docetaxel was determined after 6 d of treatment. Results are expressed as mean ± SEM. (D) LNCaP and DU145 were transfected with 50 nM si-K (KDM5D) and si-C (control) 2 d before docetaxel treatment. Transfected cells were treated with varied docetaxel concentrations in 10% CSS media with and without 10 nM DHT for 6 d. GI50 of docetaxel was determined after 6 d of treatment. Results are expressed as mean ± SEM. Nuclear fractions were collected 48 h after the indicated siRNA transfection and subjected to immunoblotting with the indicated antibodies.
Fig. S2.
Fig. S2.
(A) Venn diagrams showing DHT-induced and -suppressed genes (FDR-adjusted P < 0.05) at 24 h in LNCaP and LAPC4. GO term analysis was performed in each specific gene set, and the top 10 terms according to −log10 P value are displayed. (B) Heat map of gene expression level of 236 histone modification genes in LNCaP and LAPC4 sorted by P value. Mean expression values of three independent experiments were examined. (C) Cell growth of LNCaP-sh-control and LNCaP-sh-KDM5D (1, 2, and 3) treated with and without 10 nM docetaxel in 10% charcoal stripped serum (CSS) with or without 10 nM DHT culture conditions. Results are presented as relative values (mean ± SEM). Nuclear fractions were collected and subjected to immunoblotting with the indicated antibodies. (D) Cell growth of LAPC4-pLenti-C (control) and LAPC4-pLenti-K (KDM5D) treated with and without 100 nM docetaxel in 10% CSS with or without 10 nM DHT culture conditions. Results are presented as relative values (mean ± SEM). Nuclear fractions were collected and subjected to immunoblotting with the indicated antibodies.
Fig. 3.
Fig. 3.
KDM5D and AR in the nucleus cooperate in rendering docetaxel sensitivity. (A) PC3-pLenti-control and PC3-pLenti-KDM5D cells were transfected with the indicated AR constructs (AR-FL and AR-v7) using a forward transfection protocol. The next day, cells were plated in a 96-well plate in CSS with and without 10 nM DHT, followed by the indicated treatment (10 nM docetaxel) for 6 d. Inhibitory effect on cell growth is presented as a relative value (mean ± SEM) compared with control as 100%. (B) Transfected cells were starved in CSS for 48 h, followed by treatment with and without 10 nM DHT for 24 h. Nuclear fractions were collected and subjected to immunoblotting with the indicated antibodies.
Fig. S3.
Fig. S3.
Whole-genome sequence data of a panel of prostate cancer cell lines (COSMIC database). Copy-number variations in the Y chromosome are shown.
Fig. 4.
Fig. 4.
KDM5D directly interacts with AR and regulates its transcriptional activity. (A) Nuclear fractions in LNCaP sh-control and sh-KDM5D#3 cells were immunoprecipitated with antibodies specific to IgG, AR, and KDM5D followed by immunoblotting with the indicated antibodies. (B) LNCaP cells with and without shRNA to KDM5D were starved in 10% CSS media for 48 h followed by 10 nM DHT induction. RNA expression levels of AR-regulated genes were examined at 6 and 24 h after DHT by QT-PCR and normalized to GAPDH. Data are expressed as relative mean fold change compared with the expression level without DHT stimulation (mean ± SEM). (C, Left) ChIP-seq datasets of AR and H3K4me3 (27). The chromatin status in the vicinity of the transcription start site and primers designed for KLK3, KLK2, and FKBP5 are shown. (C, Right) Quantitative PCR of ChIP of H3K4me3 and AR was performed in LNCaP sh-control and sh-KDM5D#3 cells. For ChIP of H3K4me3, cells were cultured in 10% FBS for 3 d. For ChIP of AR, cells were starved for 48 h, and then treated with and without DHT (10 nM) for 16 h. Data are shown as mean ± SD. (D) Venn diagrams showing DHT-induced and -suppressed genes (gene expression fold change >2) at 24 h in LNCaP sh-control and sh-KDM5D#3. (E) Gene set enrichment analysis illustrating the top 10 enrichment gene sets up-regulated by knockdown of KDM5D in DHT (10 nM)-supplemented medium according to −log10 FDR-adjusted P value. None of the down-regulated gene sets were enriched with FDR < 0.25.
Fig. S4.
Fig. S4.
(A) Nuclear fractions in LAPC4-pLenti-KDM5D cells were immunoprecipitated with antibodies specific to IgG, AR, and Flag followed by immunoblotting with the indicated antibodies. (B) LAPC4 cells with and without overexpression of KDM5D were starved in 10% CSS media for 48 h followed by 10 nM DHT induction. RNA expression levels of AR-regulated genes were examined at 6 and 24 h after DHT by QT-PCR and normalized to GAPDH. Data are expressed as relative mean fold change compared with expression levels without DHT stimulation (mean ± SEM). (C) Gene set enrichment analysis showing 73 gene sets that are significantly enriched by knockdown of KDM5D (sh-KDM5D#3) at FDR < 0.25 in 10 nM DHT-supplemented medium. (D) GSEA showing up-regulation in representative sets of cell cycle/mitosis-related genes. The top 20 leading-edge genes are shown.
Fig. 5.
Fig. 5.
Impact of KDM5D expression on docetaxel sensitivity in LNCaP sublines and impact on clinical outcomes. (A) Extracted DNA from the indicated cell lines was examined by PCR with primer 1 (designed for the transcription started site) and primer 2 (designed for the intron), and then amplicons were subjected to gel electrophoresis. (B, Left Upper) Nuclear fractions were collected in the indicated cell lines and subjected to immunoblotting with the indicated antibodies. (B, Lower) LNCaP and LNCaP-derived CRPC cell lines were treated with the indicated concentrations of docetaxel in 10% CSS media with (Right) and without (Left) 10 nM DHT for 6 d. The inhibitory effect on cell growth by docetaxel is presented as a relative value (mean ± SEM) compared with control as 100%. (B, Right Upper) Clonogenic survival assays in which 7 × 10³ cells were plated in a six-well plate and treated with and without 10 nM docetaxel in 10% CSS media supplemented with 10 nM DHT for 14 d. (C) KDM5D transcript expression in multiple prostate cancer studies from the Oncomine database. Datasets were analyzed for KDM5D expression in primary prostate cancer versus CRPC. Statistical significance and number of samples are indicated. P values were calculated using two-sample, one-tailed Welch’s t test. In the Grasso cohort, 31 out of the 35 CRPC patients had exon coverage ratio, mRNA expression level, and clinical outcome data (overall survival). Linear regression was performed to examine a correlation between exon coverage ratio and mRNA expression level, and patients were divided into two groups according to KDM5D mRNA expression level to carry out Kaplan–Meier analysis. P value is calculated using log-rank test. Median survival was 120 and 46.5 mo, respectively, for high-KDM5D and low-KDM5D groups.
Fig. S5.
Fig. S5.
(A) RNA expression of KDM5D in a panel of prostate cancer cell lines. GAPDH was used for normalization. Mean expression values of three independent experiments were examined and are presented as mean ± SEM. (B) Datasets were analyzed for KDM5D expression in primary prostate cancer versus CRPC. Statistical significance and number of samples are indicated. P values were calculated using two-sample, one-tailed Welch’s t test. (C) Copy-number alteration (CNA) of the KDM5D region in the Grasso cohort, which contains CNA and sequencing data for 59 patients. The data include 11 primary cancer patients and 48 CRPC patients. Results were selected by using OncoPrint (www.cbioportal.org/oncoprinter.jsp), which visualizes CNA from the cBioPortal database. (D) Comparisons of characteristics of high- and low-KDM5D groups in the Grasso cohort [31 CRPC patients who have a clinical outcome (overall survival and survival from the time point of starting chemotherapy) and KDM5D expression level]. (E) Patients in the Grasso cohort were divided into two groups according to KDM5D mRNA expression level to carry out Kaplan–Meier analysis. (F) Lack of significant correlation between AR and KDM5D mRNA expression in the indicated datasets. Results were obtained from the cBioPortal database.

Comment in

Similar articles

Cited by

References

    1. Petrylak DP, et al. Docetaxel and estramustine compared with mitoxantrone and prednisone for advanced refractory prostate cancer. N Engl J Med. 2004;351(15):1513–1520. - PubMed
    1. Tannock IF, et al. TAX 327 Investigators Docetaxel plus prednisone or mitoxantrone plus prednisone for advanced prostate cancer. N Engl J Med. 2004;351(15):1502–1512. - PubMed
    1. Sweeney CJ, et al. Chemohormonal therapy in metastatic hormone-sensitive prostate cancer. N Engl J Med. 2015;373(8):737–746. - PMC - PubMed
    1. James ND, et al. STAMPEDE Investigators Addition of docetaxel, zoledronic acid, or both to first-line long-term hormone therapy in prostate cancer (STAMPEDE): Survival results from an adaptive, multiarm, multistage, platform randomised controlled trial. Lancet. 2016;387(10024):1163–1177. - PMC - PubMed
    1. Robinson D, et al. Integrative clinical genomics of advanced prostate cancer. Cell. 2015;161(5):1215–1228. - PMC - PubMed

Publication types

MeSH terms