

Biodiversity enhances reef fish biomass and resistance to climate change
- PMID: 27185921
- PMCID: PMC4896699
- DOI: 10.1073/pnas.1524465113
Biodiversity enhances reef fish biomass and resistance to climate change
Abstract
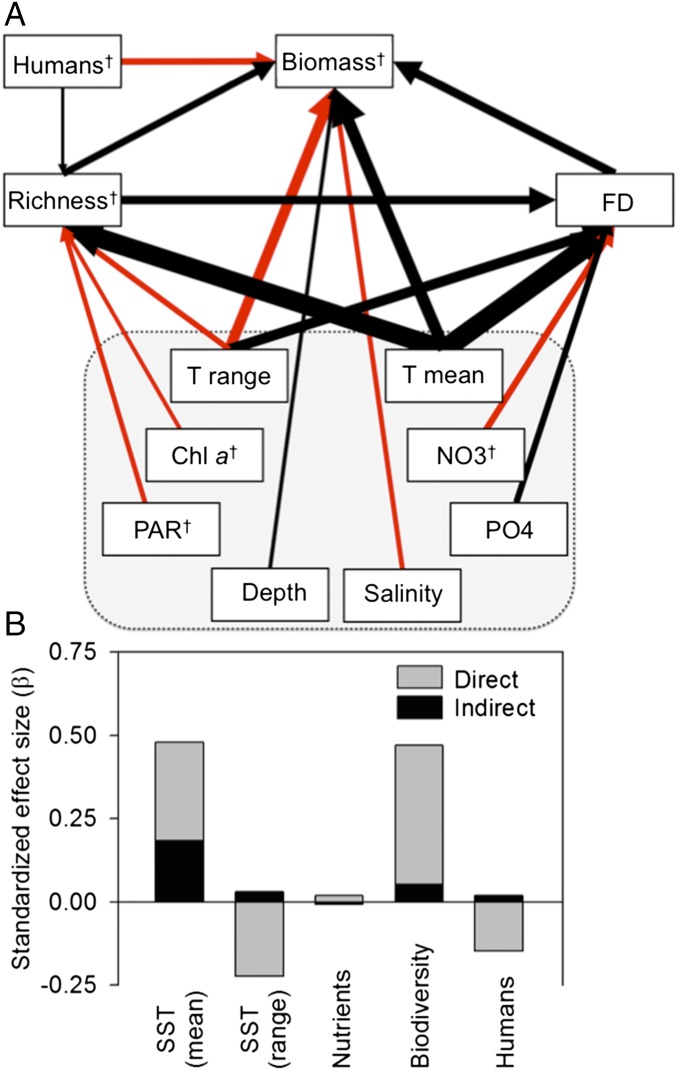
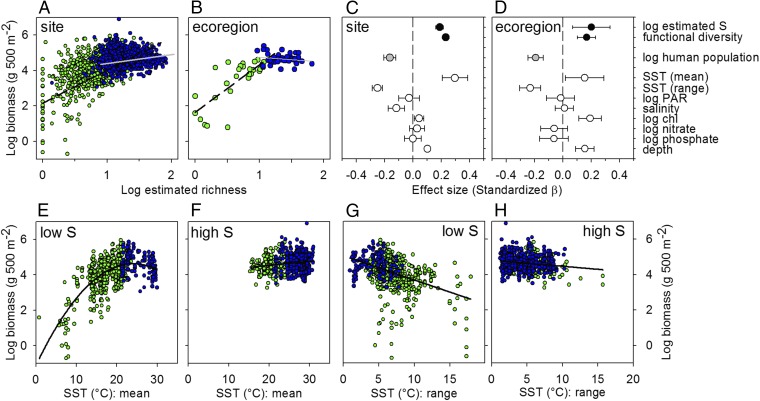
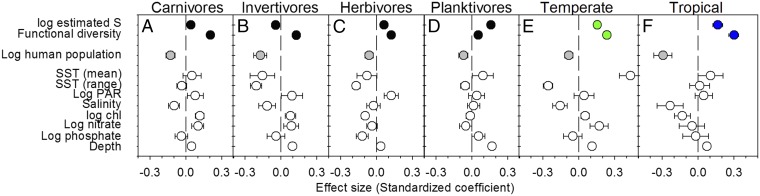
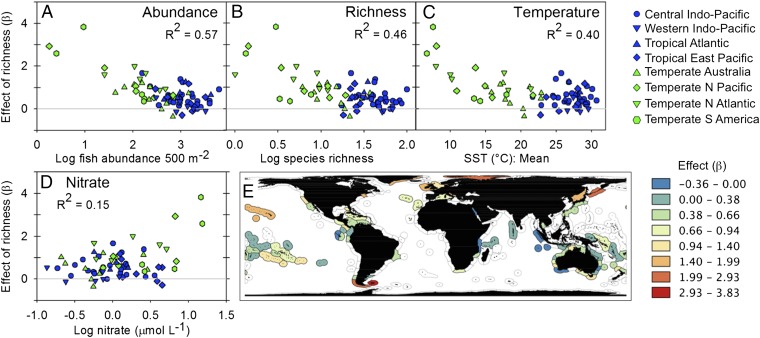
Fishes are the most diverse group of vertebrates, play key functional roles in aquatic ecosystems, and provide protein for a billion people, especially in the developing world. Those functions are compromised by mounting pressures on marine biodiversity and ecosystems. Because of its economic and food value, fish biomass production provides an unusually direct link from biodiversity to critical ecosystem services. We used the Reef Life Survey's global database of 4,556 standardized fish surveys to test the importance of biodiversity to fish production relative to 25 environmental drivers. Temperature, biodiversity, and human influence together explained 47% of the global variation in reef fish biomass among sites. Fish species richness and functional diversity were among the strongest predictors of fish biomass, particularly for the large-bodied species and carnivores preferred by fishers, and these biodiversity effects were robust to potentially confounding influences of sample abundance, scale, and environmental correlations. Warmer temperatures increased biomass directly, presumably by raising metabolism, and indirectly by increasing diversity, whereas temperature variability reduced biomass. Importantly, diversity and climate interact, with biomass of diverse communities less affected by rising and variable temperatures than species-poor communities. Biodiversity thus buffers global fish biomass from climate change, and conservation of marine biodiversity can stabilize fish production in a changing ocean.
Keywords: fisheries; functional diversity; global change; macroecology; structural equation model.
Conflict of interest statement
The authors declare no conflict of interest.
Figures
References
-
- Brown J, Gillooly J, Allen A, Savage V, West G. Toward a metabolic theory of ecology. Ecology. 2004;85(7):1771–1789.
-
- Borer ET, Halpern BS, Seabloom EW. Asymmetry in community regulation: Effects of predators and productivity. Ecology. 2006;87(11):2813–2820. - PubMed
-
- Estes JA, et al. Trophic downgrading of planet Earth. Science. 2011;333(6040):301–306. - PubMed
-
- Darimont CT, Fox CH, Bryan HM, Reimchen TE. Human impacts. The unique ecology of human predators. Science. 2015;349(6250):858–860. - PubMed
-
- Jennings S, Kaiser MJ. The effects of fishing on marine ecosystems. Adv Mar Biol. 1998;34:201–212.
Publication types
MeSH terms
LinkOut - more resources
Full Text Sources
Other Literature Sources
Medical
