. 2016 May 31;113(22):E3159-68.
doi: 10.1073/pnas.1605658113. Epub 2016 May 16.

Striatal cholinergic interneurons generate beta and gamma oscillations in the corticostriatal circuit and produce motor deficits

Affiliations

Striatal cholinergic interneurons generate beta and gamma oscillations in the corticostriatal circuit and produce motor deficits

Krishnakanth Kondabolu et al. Proc Natl Acad Sci U S A. .

Abstract

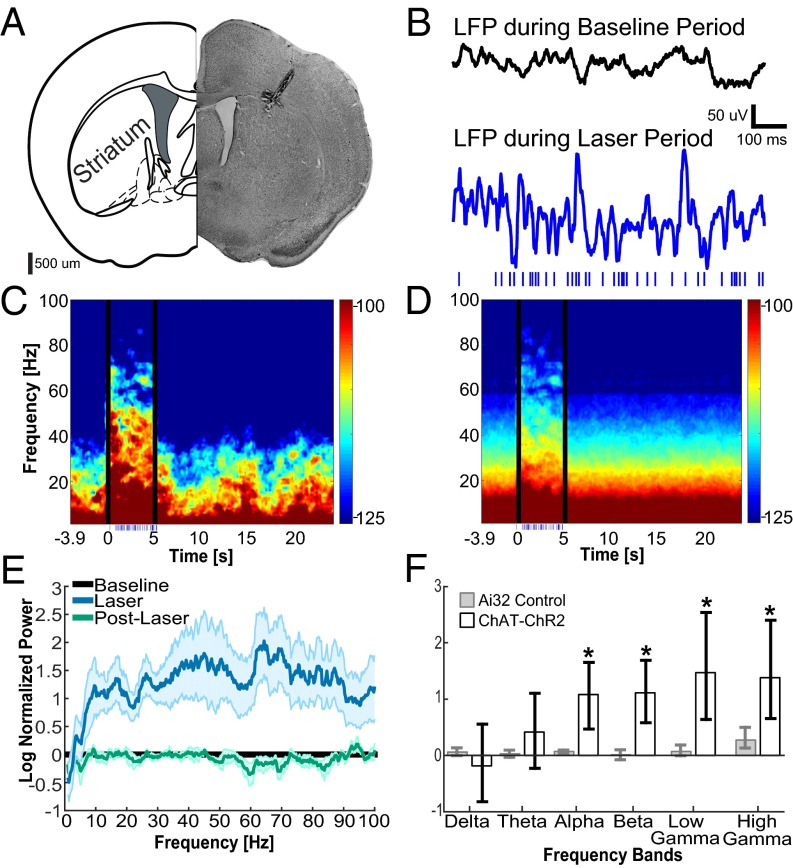
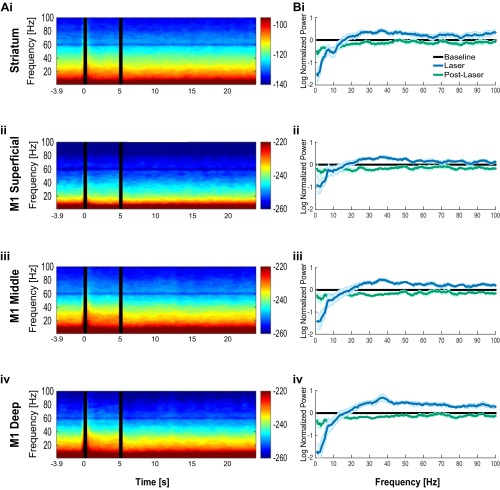
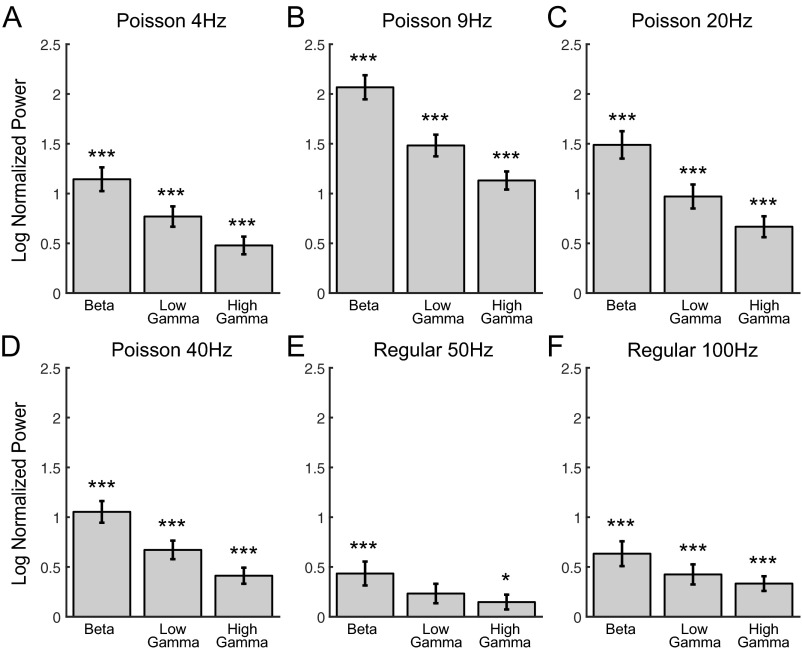
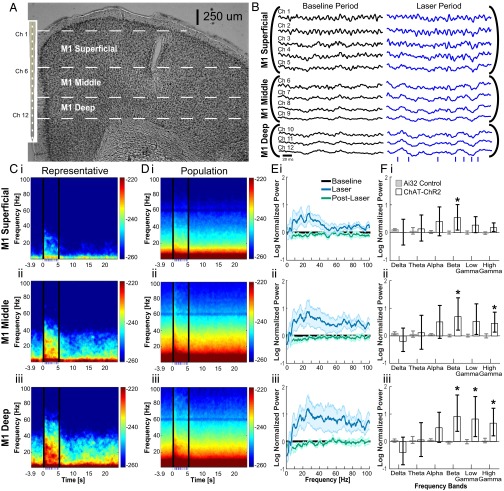
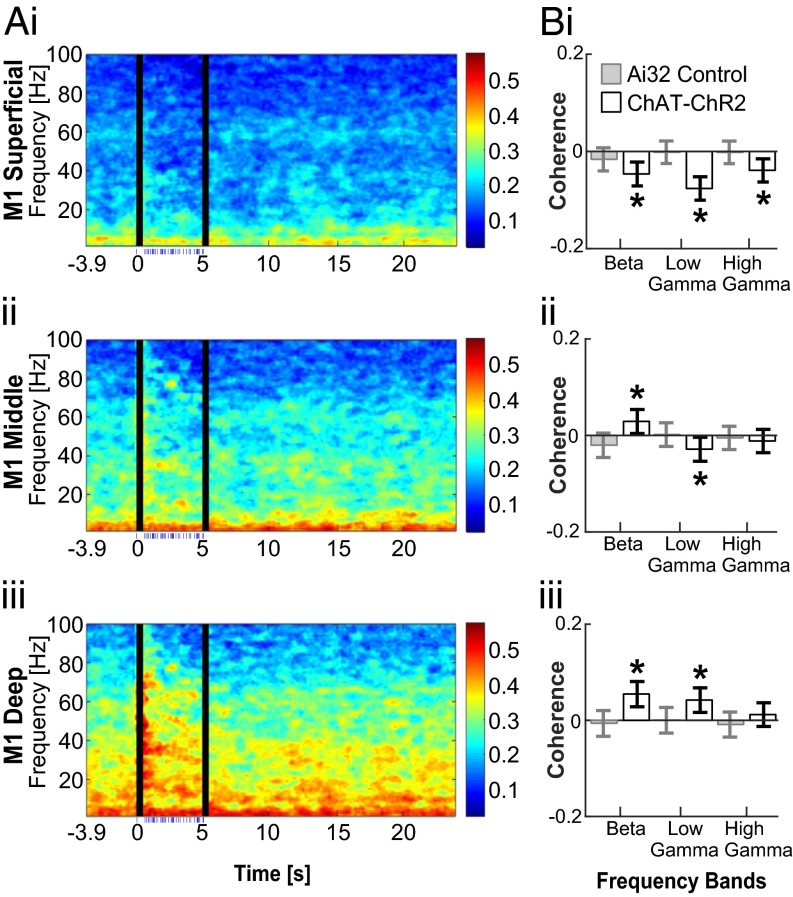
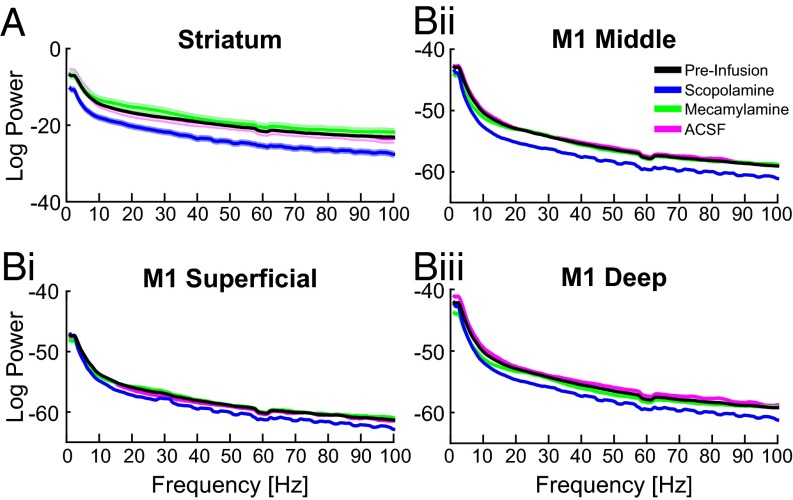
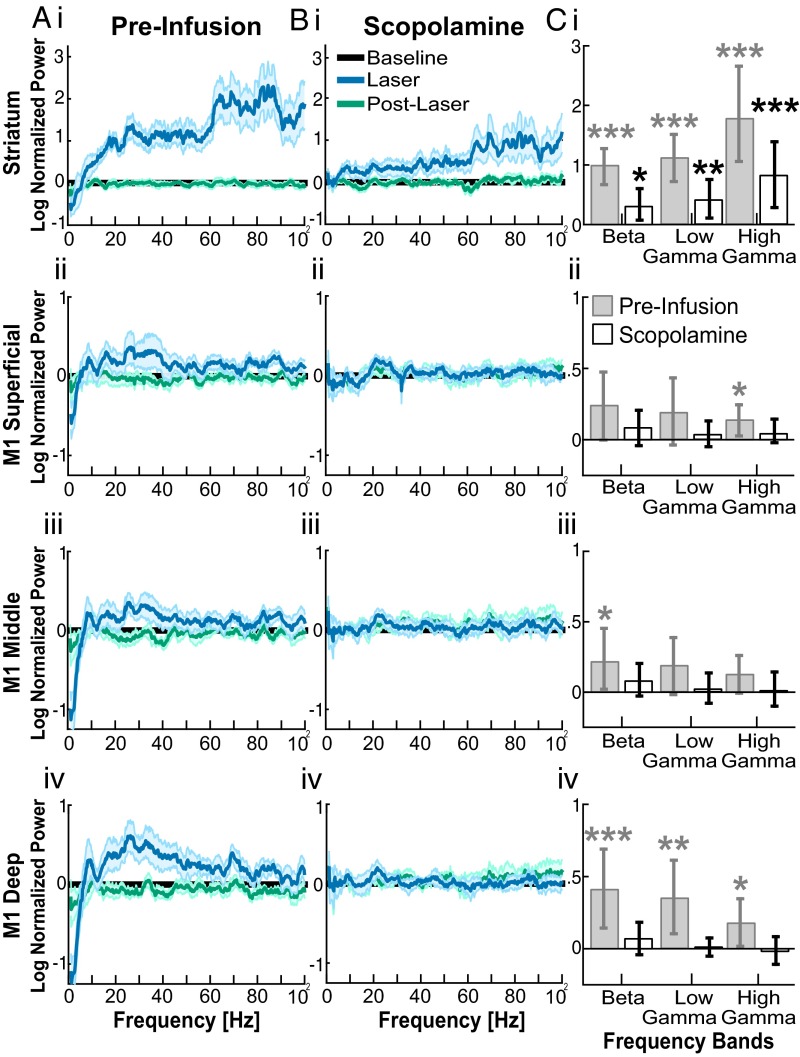
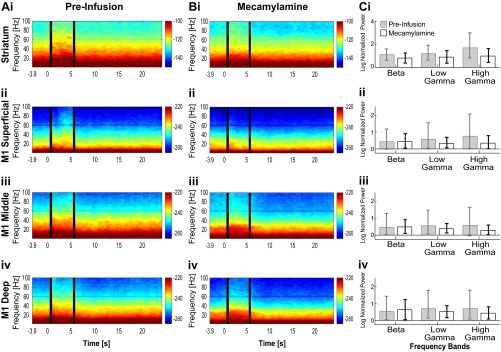
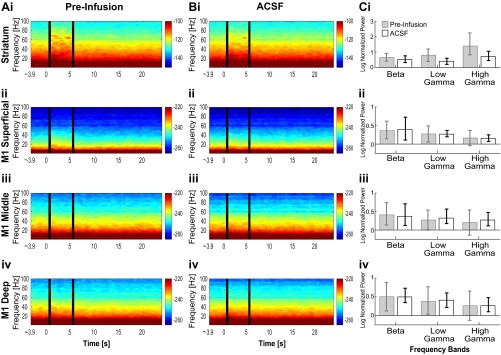
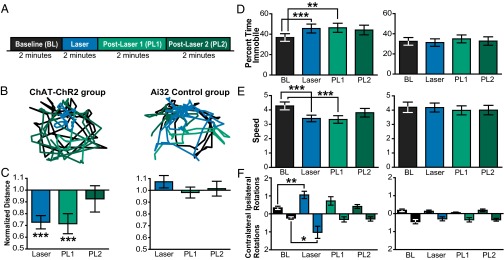
Cortico-basal ganglia-thalamic (CBT) neural circuits are critical modulators of cognitive and motor function. When compromised, these circuits contribute to neurological and psychiatric disorders, such as Parkinson's disease (PD). In PD, motor deficits correlate with the emergence of exaggerated beta frequency (15-30 Hz) oscillations throughout the CBT network. However, little is known about how specific cell types within individual CBT brain regions support the generation, propagation, and interaction of oscillatory dynamics throughout the CBT circuit or how specific oscillatory dynamics are related to motor function. Here, we investigated the role of striatal cholinergic interneurons (SChIs) in generating beta and gamma oscillations in cortical-striatal circuits and in influencing movement behavior. We found that selective stimulation of SChIs via optogenetics in normal mice robustly and reversibly amplified beta and gamma oscillations that are supported by distinct mechanisms within striatal-cortical circuits. Whereas beta oscillations are supported robustly in the striatum and all layers of primary motor cortex (M1) through a muscarinic-receptor mediated mechanism, gamma oscillations are largely restricted to the striatum and the deeper layers of M1. Finally, SChI activation led to parkinsonian-like motor deficits in otherwise normal mice. These results highlight the important role of striatal cholinergic interneurons in supporting oscillations in the CBT network that are closely related to movement and parkinsonian motor symptoms.

Keywords: beta oscillations; cholinergic interneurons; coherence; optogenetics; striatum.


Conflict of interest statement

The authors declare no conflict of interest.

Figures

Fig. 1.
Fig. 1.
Experimental setup and protocols. (A) Illustration of the recording configuration. The recording pipette was coupled to an optical fiber and a laminar probe containing 16 electrode contacts, positioned in the M1. (B) A representative image of the striatum showing ChR2-eYFP fluorescence (green; Left), immunofluorescence of ChAT (red; Middle), and colocalization (Right).
Fig. 2.
Fig. 2.
Optogenetic activation of SChIs increased striatal alpha, beta, and gamma oscillations. (A) Representative coronal histological section showing an electrode and optical fiber track into the striatum. (B) Representative 1-s LFPs recorded in the striatum before (Top) and during (Bottom) laser stimulation at Poisson-distributed 40 Hz (Bottom; blue dashes indicate the time of laser pulses). (C) Representative spectrogram from one mouse, aligned to laser onset and averaged over all trials. The 500 ms immediately after laser onset and offset were excluded from the corresponding statistics because of strong LFP deflections. (D) Population spectrogram upon optogenetic stimulation of SChIs in ChAT-ChR2 mice (n = 7 mice). (E) Population power spectrum normalized to baseline, across frequencies before (Baseline, black), during (blue), and after laser stimulation (green), in the Chat-ChR2 mice (n = 7 mice). The shaded area around each solid line represents the SEM. (F) Bar plots comparing changes upon laser stimulation in different frequency bands between the Chat-ChR2 experimental group and the Ai32 control group for delta (1–4 Hz), theta (4–8 Hz), alpha (8–15 Hz), beta (15–30 Hz), low gamma (30–60 Hz), and high gamma (60–100 Hz) oscillations. The error bars represent the bootstrapped 95% confidence intervals (*P ≤ 0.05, nonparametric signed-rank test).
Fig. S1.
Fig. S1.
Oscillations induced by optogenetic stimulation of SChIs with a constant, 5-s-long laser illumination pattern. (A) Spectrograms before, during, and after optogenetic stimulation in striatum (i), as well as superficial (ii), middle (iii), and deep (iv) M1 layers. Laser was on at 0–5 s. (B) Normalized spectral power to prelaser baseline period in striatum (i), as well as the superficial (ii), middle (iii), and deep (iv) layers of M1. Constant light illumination patterns elicited increases in beta and gamma oscillations in striatum, as well as all layers of motor cortex. The shaded region represents the SEM.
Fig. S2.
Fig. S2.
Optogenetic stimulation of SChIs increased striatal beta and gamma oscillatory power by using 1-s-long laser illumination patterns, pulsed at Poisson-distributed 4 Hz (A), Poisson-distributed 9 Hz (B), Poisson-distributed 20 Hz (C), Poisson-distributed 40 Hz (D), regular 50 Hz (E), and regular 100 Hz (F). These stimulation protocols elicited increases in beta (15–30 Hz), low-gamma (30–60 Hz), and high-gamma (60–100 Hz) oscillations in striatum. The bars are the natural logarithm of the quotient of the power during the 1-s period starting 500 ms after laser offset divided by the prelaser baseline power. The error bars represent the SEM. (*P < 0.05, ***P < 0.001, nonparametric signed-rank test).
Fig. 3.
Fig. 3.
SChI activation led to layer-dependent beta and gamma oscillation changes in the M1. (A) Representative coronal section demonstrating the position of laminar electrodes in M1. (B) Representative 200-ms LFPs during the baseline period before laser simulation (black) and during laser stimulation period (blue). (C) Representative power spectrum from an individual mouse for superficial layers (C, i, averaged across Ch1–Ch5), middle layers (C, ii, averaged across Ch6–Ch9), and deep layers (C, iii, averaged across Ch10–Ch12). The 500 ms immediately after laser onset and offset were excluded from the corresponding statistics because of strong LFP deflections. (D) Population spectrograms aligned to laser onset for superficial layers (D, i), middle layers (D, ii), and deep layers (D, iii) (n = 7 mice). Bottom, blue dashes indicate the timing of laser light pulsed at Poisson-distributed 40 Hz, for 5 s. (E) Population spectrum for M1 superficial layers (E, i), middle layers (E, ii), and deep layers (E, iii). (F) Bar plots comparing oscillation powers at different frequencies in superficial (F, i), middle (F, ii), and deep (F, iii) layers for delta (1–4 Hz), theta (4–8 Hz), alpha (8–15 Hz), beta (15–30 Hz), low gamma (30–60 Hz), and high gamma (60–100 Hz). Error bars represent the bootstrapped 95% confidence intervals (*P ≤ 0.05, nonparametric signed-rank test).
Fig. 4.
Fig. 4.
SChI activation modulated coherence between the striatum and M1. (A) Population coherograms show coherence between the striatum and superficial (i), middle (ii), and deep layers (iii) of M1 before, during, and after laser stimulation. Laser stimulation was pulsed at a Poisson-distributed 40 Hz, during 0–5 s (bottom, blue dashes indicate the timing of laser pulses, n = 7 mice). The 500 ms immediately after laser onset and offset were excluded from the corresponding statistics because of strong LFP deflections. (B) Bar plots comparing the coherence between the striatum and M1 superficial (B, i), middle (B, ii), and deep (B, iii) layers before and during laser stimulation for beta (15–30 Hz), low gamma (30–60 Hz), and high gamma (60–100 Hz) frequencies. Error bars indicate the jackknifed 95% confidence interval error bars (*P ≤ 0.05, nonparametric jackknife test).
Fig. 5.
Fig. 5.
Striatal muscarinic receptors modulated basal levels of beta and gamma oscillations in the striatum and deeper layers of M1. After striatal drug infusion, population power spectrums in the striatum (A), and different layers of M1 [superficial (B, i), middle (B, ii), and deep layers (B, iii)]. The shaded area around each solid line represents the SEM. Scopolamine infusion reduced oscillation power in the striatum, middle layers of M1, and deep layers of M1.
Fig. 6.
Fig. 6.
Striatal muscarinic receptors mediated SChI-induced beta and gamma oscillations in the striatum and M1. (A and B) Optogenetic stimulation induced changes in the power spectrum before (A) and after (B) scopolamine infusion (n = 8 mice), in the striatum (i), superficial (ii), middle (iii), and deep layers of M1 (iv). The power spectrum during laser stimulation (blue) and after laser stimulation (green) was normalized to the baseline (black). (C) Bar plot comparison of oscillation power changes in beta (15–30 Hz), low gamma (30–60 Hz), and high gamma (60–100 Hz) frequencies, before (gray) and after (white) scopolamine infusion. Error bars are the bootstrapped 95% confidence intervals (*P ≤ 0.05; **P ≤ 0.01; ***P ≤ 0.001; nonparametric bootstrap test).
Fig. S3.
Fig. S3.
Oscillations induced by optogenetic stimulation of SChIs, in the presence of the nicotinic receptor antagonist mecamylamine in the striatum (i) as well as superficial (ii), middle (iii), and deep (iv) M1 layers. (A) Preinfusion spectrogram demonstrating increased beta and gamma oscillations in the striatum, as well as elevated beta oscillations in all layers of M1 and gamma oscillations in deeper layers of M1. (B) Postinfusion spectrograms showing increased beta and gamma oscillations in striatum and M1. (C) Bar plot comparing SChI stimulation-induced oscillation changes between preinfusion and postinfusion periods. There were no significant changes in beta and gamma power when comparing premecamylamine with postmecamylamine infusion laser-induced power in the striatum. The error bars represent the 95% confidence intervals (*P < 0.05; ***P < 0.001; nonparametric paired signed-rank test). Beta, 15–30 Hz; low gamma, 30–60 Hz; high gamma, 60–100 Hz.
Fig. S4.
Fig. S4.
Oscillations induced by optogenetic stimulation of SChIs upon infusion with ACSF in the striatum (i) as well as the superficial (ii), middle (iii), and deep (iv) M1 layers. (A) Preinfusion spectrogram. (B) Postinfusion spectrogram. (C) Bar plot comparing laser-induced oscillation power normalized to the prelaser baseline during preinfusion and postinfusion period. Laser stimulation was effective at inducing beta and gamma oscillations. There were no significant differences between preinfusion and postinfusion in striatum. The error bars represent the 95% confidence intervals. (*P < 0.05; ***P < 0.001; nonparametric paired signed-rank test). Beta, 15–30 Hz; low gamma, 30–60 Hz; high gamma, 60–100 Hz.
Fig. 7.
Fig. 7.
Unilateral SChI activation decreased locomotion and increased rotation behavior. (A) Behavioral optogenetic experimental protocol consists of a baseline period, laser period, and two post-laser periods (2 min per period). (B) Representative positions of a ChAT-ChR2 mouse (Left) and a control Ai32 mouse (Right) before (black trace), during (blue trace), and post-laser periods (green traces) after laser illumination. (CE) Bar plot comparison of locomotor activity measures, including baseline-normalized distance (C), percent time immobile (D), and movement speed when mobile (E). (F) Bar plot comparison of rotation in the Chat-ChR2 group (Left) and the control Ai32 group (Right) (n = 5 mice for Chat-ChR2 group; n = 5 mice for control Ai32 group). Error bars indicate the SEM (*P ≤ 0.05; **P ≤ 0.01; ***P ≤ 0.001; Bonferroni-corrected nonparametric paired signed-rank tests).

References

    1. Brown P. Abnormal oscillatory synchronisation in the motor system leads to impaired movement. Curr Opin Neurobiol. 2007;17(6):656–664. - PubMed
    1. Little S, Pogosyan A, Kuhn AA, Brown P. β band stability over time correlates with Parkinsonian rigidity and bradykinesia. Exp Neurol. 2012;236(2):383–388. - PMC - PubMed
    1. Brown P, Williams D. Basal ganglia local field potential activity: Character and functional significance in the human. Clinical Neurophysiol. 2005;116(11):2510–2519. - PubMed
    1. Kühn AA, Kupsch A, Schneider GH, Brown P. Reduction in subthalamic 8-35 Hz oscillatory activity correlates with clinical improvement in Parkinson’s disease. Eur J Neurosci. 2006;23(7):1956–1960. - PubMed
    1. Kühn AA, et al. High-frequency stimulation of the subthalamic nucleus suppresses oscillatory beta activity in patients with Parkinson’s disease in parallel with improvement in motor performance. J Neurosci. 2008;28(24):6165–6173. - PMC - PubMed

Publication types

LinkOut - more resources