. 2016 May 31;113(22):6212-7.
doi: 10.1073/pnas.1603488113. Epub 2016 May 16.

Structural characterization of the ternary complex that mediates termination of NF-κB signaling by IκBα

Affiliations

Structural characterization of the ternary complex that mediates termination of NF-κB signaling by IκBα

Sulakshana P Mukherjee et al. Proc Natl Acad Sci U S A. .

Abstract

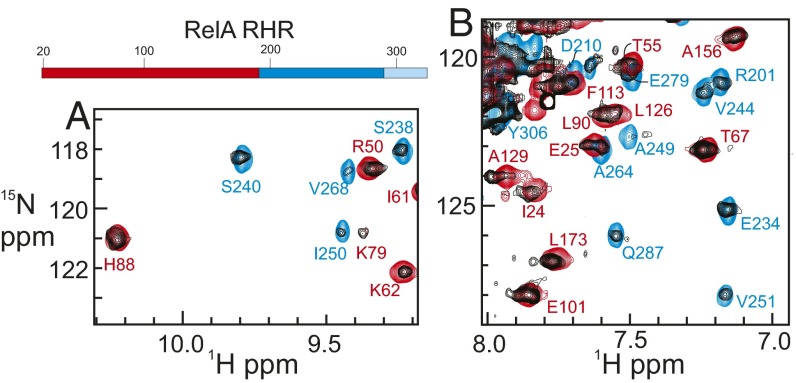
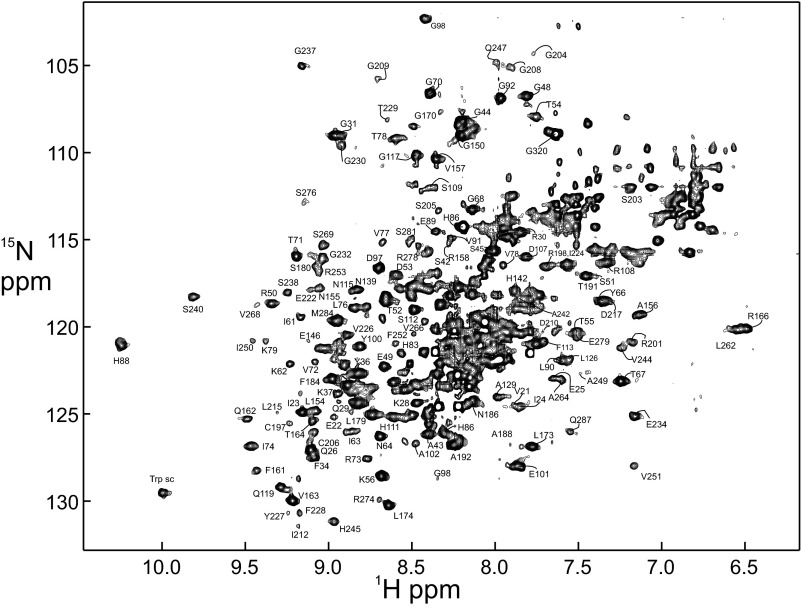
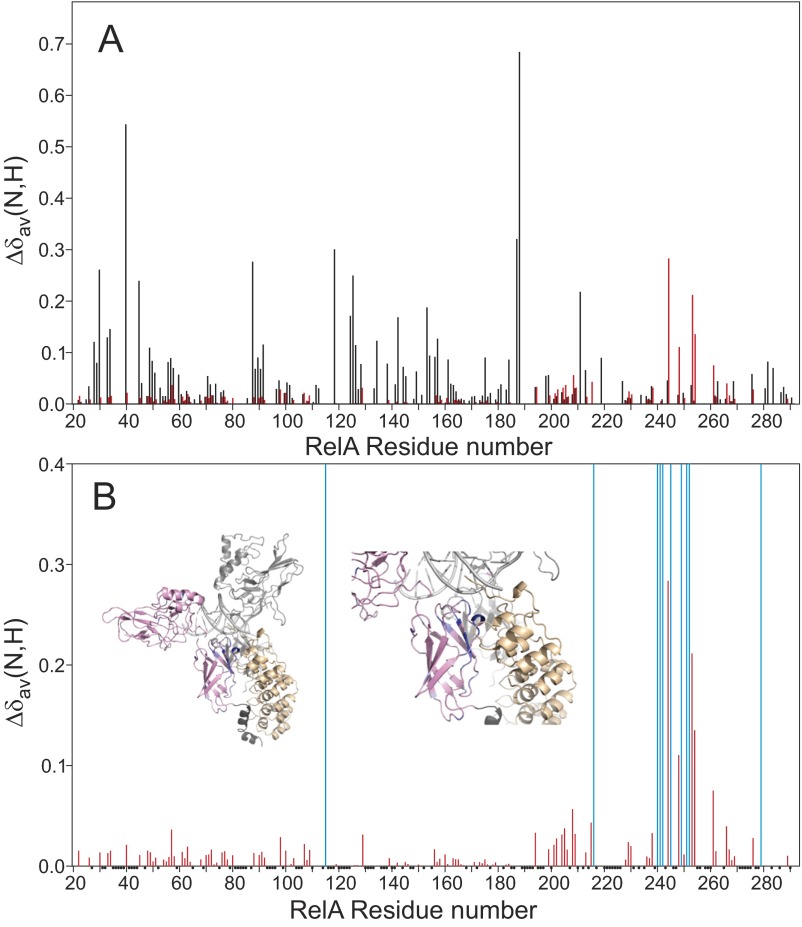
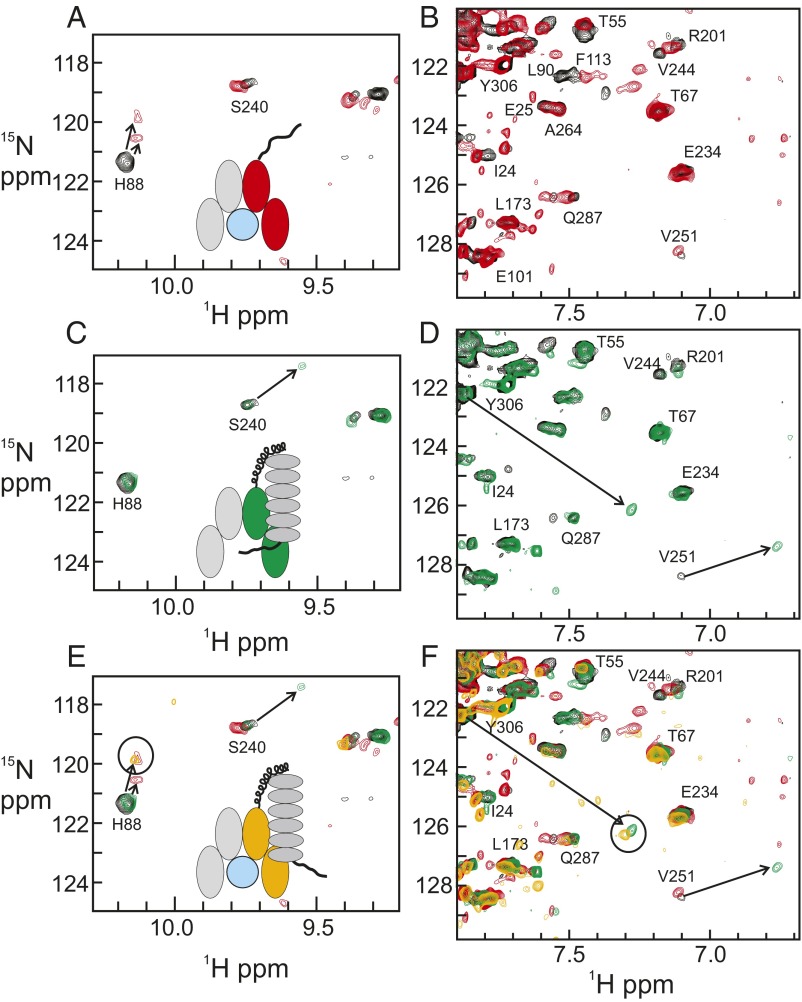
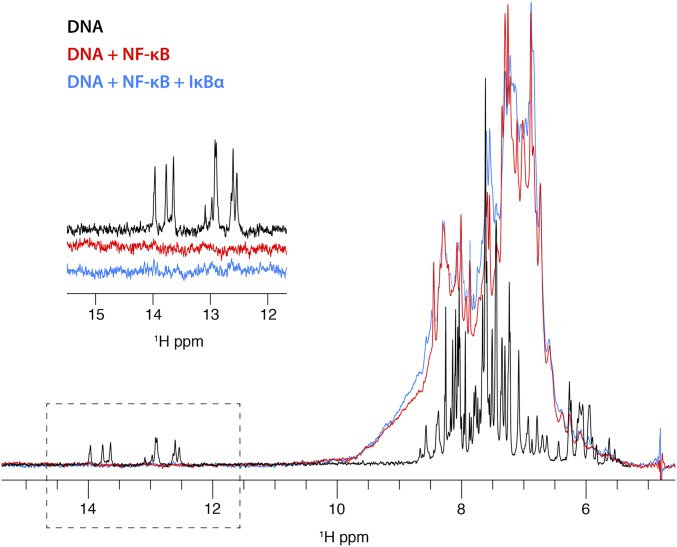
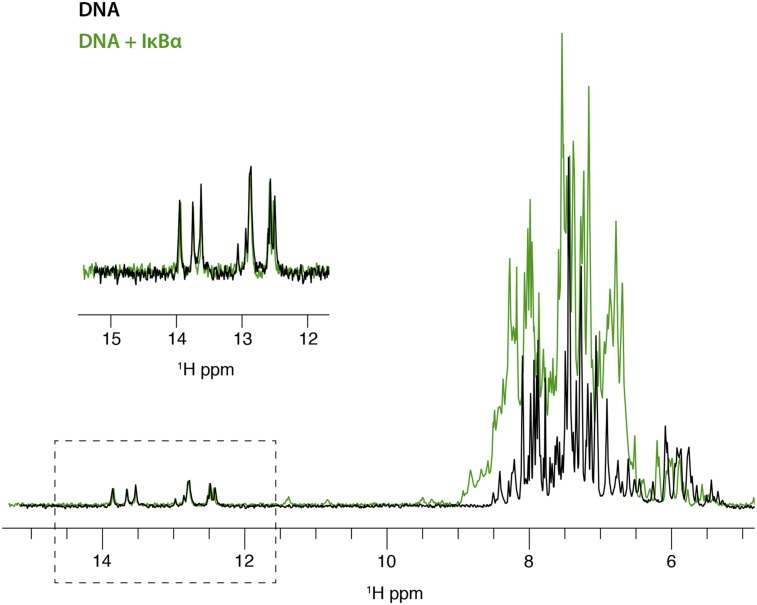
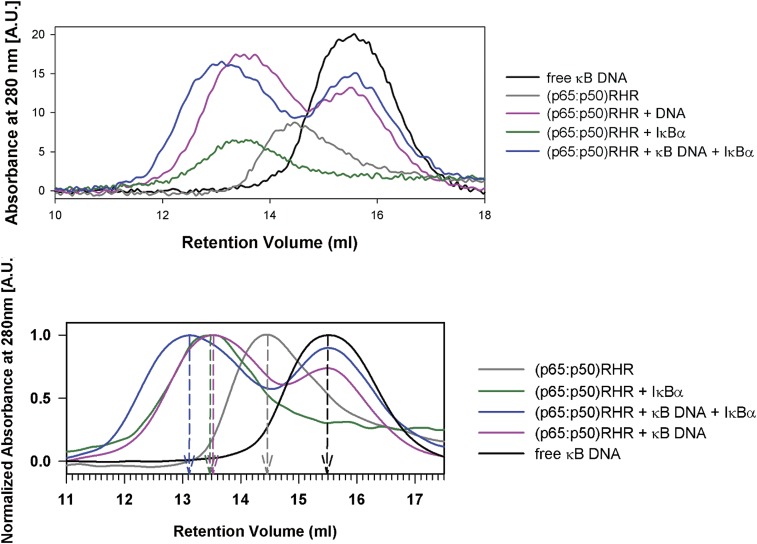
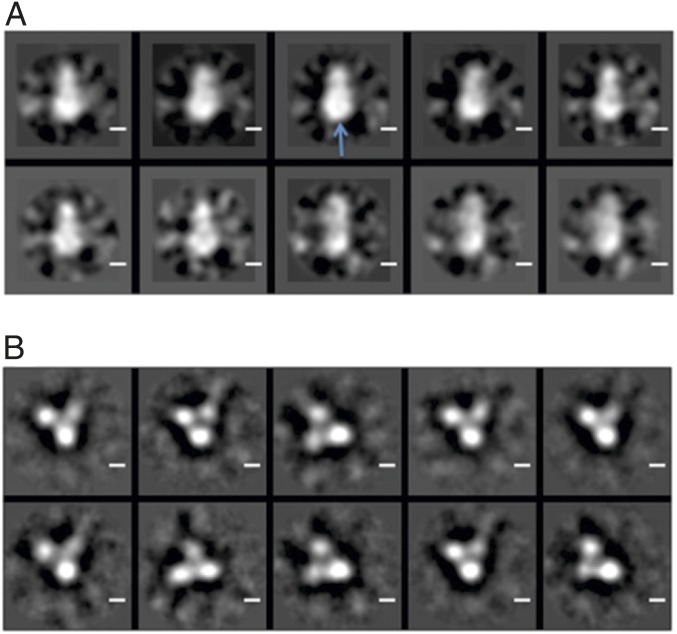
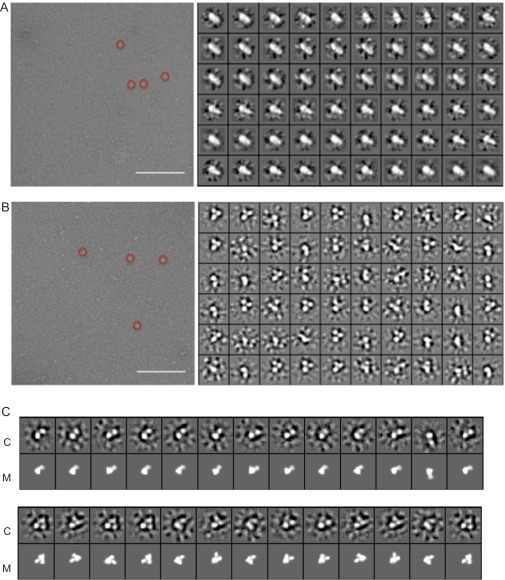
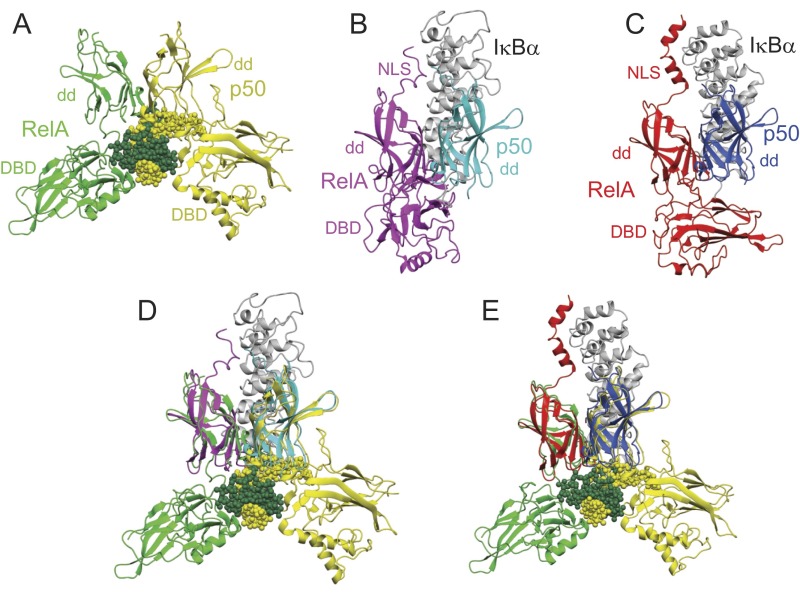
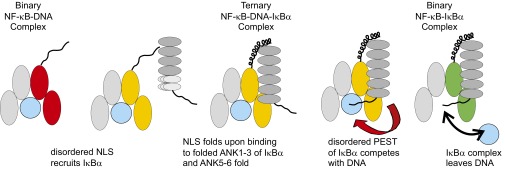
The transcription factor NF-κB is used in many systems for the transduction of extracellular signals into the expression of signal-responsive genes. Published structural data explain the activation of NF-κB through degradation of its dedicated inhibitor IκBα, but the mechanism by which NF-κB-mediated signaling is turned off by its removal from the DNA in the presence of newly synthesized IκBα (termed stripping) is unknown. Previous kinetic studies showed that IκBα accelerates NF-κB dissociation from DNA, and a transient ternary complex between NF-κB, its cognate DNA sequence, and IκBα was observed. Here we structurally characterize the >100-kDa ternary complex by NMR and negative stain EM and show a modeled structure that is consistent with the measurements. These data provide a structural basis for previously unidentified insights into the molecular mechanism of stripping.

Keywords: NMR; negative stain electron microscopy; protein–DNA complex; protein–protein complex; transcriptional activation.


Conflict of interest statement

The authors declare no conflict of interest.

Figures

Fig. 1.
Fig. 1.
(A and B) Portions of the 1H–15N TROSY spectrum of the RelA RHR in complex with perdeuterated p50 RHR (black), superimposed on the 1H–15N TROSY spectra of the RelA DBD (residues 19–191) (red) and of the RelA DD (residues 190–321) in complex with perdeuterated p50 DD (residues 245–350) (blue). Resonance assignments were obtained from the spectra of the isolated component domains (9). (Top) Schematic diagram showing regions of RelA RHR used in this work. Red, N-terminal DBD; blue, dimerization domain; light blue, NLS. The full 1H–15N HSQC spectrum is shown in Fig. S1.
Fig. S1.
Fig. S1.
1H–15N TROSY spectrum of 15N-labeled, perdeuterated RelA RHR in complex with unlabeled, perdeuterated p50 RHR. Assignments were mapped from the spectra of the individual domains (9).
Fig. S2.
Fig. S2.
Plots of the weighted average chemical shift differences Δδav(N,H) = √[(Δδ1H)2 + (Δδ15N/5)2] between corresponding cross-peaks in the 1H–15N TROSY spectra of binary and ternary complexes. (A) Differences between the ternary complex (NF-κB–DNA + IκBα) and the binary IκBα complex (NF-κB–IκBα) (black) and between the ternary complex and the binary DNA complex (NF-κB–DNA) (red). (B) Differences between the ternary complex (NF-κB–DNA + IκBα) and the binary DNA complex (NF-κB–DNA) (red) (same as the red data of A, with a different vertical scale) showing the location of resonance disappearance upon addition of IκBα (blue vertical bars). Small black dots at the axis denote residues for which unambiguous assignments were not available. Insets in B show a model of the ternary structure of the RelA RHR (pink) with p50 RHR (light gray) and DNA (light gray) and IκBα (yellow). The NLS is shown in dark gray at the bottom of the structure. The backbone of residues where the NH cross-peak shifts or broadens upon addition of IκBα to the NFκB–DNA complex are shown in blue.
Fig. 2.
Fig. 2.
Portions of the 1H–15N TROSY spectrum of [15N, 2H] RelA RHR in complex with perdeuterated p50 RHR (black), superimposed on the 1H–15N TROSY spectra of (A and B) RelA RHR with perdeuterated p50 RHR in complex with duplex κB DNA (red); (C and D) RelA RHR with perdeuterated p50 RHR in complex with perdeuterated IκBα (residues 67–287) (green); and (E and F) RelA RHR with perdeuterated p50 RHR in complex with duplex κB DNA (red), in complex with perdeuterated IκBα (green) and in complex with duplex κB DNA, to which an equimolar amount of perdeuterated IκBα has been added (gold). Insets in A, C, and E show schematic illustrations of the components of the solution represented by the spectra of different colors.
Fig. 3.
Fig. 3.
Portion of a 1D 1H spectrum of unlabeled duplex κB DNA (black) showing resonances at 12–14 ppm characteristic for hydrogen-bonded imino protons and resonances at 5–9 ppm characteristic of sugar and base protons of the DNA (the aliphatic portion of the spectrum, between 0 and 4 ppm has been omitted for clarity). Addition of perdeuterated NF-κB (red) gives a broadened spectrum representing both DNA and protein between 5 and 9 ppm, consistent with the incorporation of the DNA into an 83-kDa complex with NF-κB. The imino resonances of the DNA do not appear in this spectrum, likely due to broadening as a result of complex formation. The sharp resonances at 5.5–6 ppm in the DNA spectrum are also broadened. Further addition of IκBα to the NF-κB–DNA complex does not result in the reappearance of the imino resonances, indicating that the DNA remains part of the high molecular-weight complex instead of dissociating in the presence of IκBα.
Fig. S3.
Fig. S3.
One-dimensional 1H spectrum of unlabeled duplex κB DNA (black) and following addition of a 1:1 ratio of IκBα (green). (Inset) Hydrogen-bonded imino spectra.
Fig. S4.
Fig. S4.
Traces from the elution of the components of the ternary complex from a gel filtration column. (Upper) Raw data. (Lower) Data have been smoothed and normalized.
Fig. 4.
Fig. 4.
Typical 2D-class averages from negative-stain EM images of (A) a solution with equimolar amounts of NF-κB and IκBα and (B) a solution with equimolar amounts of NF-κB and IκBα and κB DNA. The larger density shown in A (blue arrow) has a diameter of ∼73 Å and is almost double the size of a single lobe shown in B, which has a diameter of around 40 Å.
Fig. S5.
Fig. S5.
(A and B) Representative negative stain electron micrographs (Left) and 60 class averages (Right) for (A) the NF-κB–IκBα binary complex and (B) the NF-κB–DNA–IκBα ternary complex. A sample of the particles picked are enclosed with a red circle. (Scale bar on each micrograph, 200 nm.) (C) Ternary complex modeled from the crystal structures 1IKN, 1NFI, and 1VKX using the program COOT (26) and shown in orientations corresponding to one- and two-lobed class averages for the ternary complex shown in B. M, model; C, class average. The comparisons of 2D class averages with projections of the 3D model were made using e2classvsproj.py in EMAN2 (27).
Fig. 5.
Fig. 5.
Models for the structures of (A) the binary complex of NF-κB with IκBα and (B) the ternary complex of NF-κB with IκBα and DNA. The models are based on a superposition of the X-ray crystal structures of the DNA complex of RelA–p50 (3) and the IκBα complex of RelA–p50 (4). Figure was made using Molmol (25).
Fig. S6.
Fig. S6.
(A) X-ray crystal structure of the complex of RelA RHR (green) and p50 RHR (yellow) with the kB DNA sequence (green and yellow spheres) (3). (B) X-ray crystal structure of the complex of RelA RHR (magenta) and the dimerization domain of p50 (cyan) with IκBα (gray) (5). (C) X-ray crystal structure of the complex of RelA RHR (red) and the dimerization domain of p50 (blue) with IκBα (gray) (4). (D) Superposition of the structures in A and B on the dimerization domains of RelA and p50. (E) Superposition of the structures in A and C on the dimerization domains of RelA and p50. The figures and the superposition were made using Molmol (25).
Fig. 6.
Fig. 6.
Schematic mechanism for the stripping of NF-κB from DNA by IκBα. The disordered NLS of RelA recruits the structured ANK1–4 domains of IκBα, the molten-globule ANK5 sixfold upon interaction with NF-κB, forming the ternary complex and bringing the PEST sequence close to the DBD. Competition by the negatively charged PEST sequence for the DNA binding site of NF-κB leads to dissociation of the NF-κB–IκBα complex, which returns to its resting state in the cytoplasm.

References

    1. Hayden MS, Ghosh S. NF-κB, the first quarter-century: Remarkable progress and outstanding questions. Genes Dev. 2012;26(3):203–234. - PMC - PubMed
    1. Hoffmann A, Levchenko A, Scott ML, Baltimore D. The IkappaB-NF-kappaB signaling module: Temporal control and selective gene activation. Science. 2002;298(5596):1241–1245. - PubMed
    1. Chen FE, Huang DB, Chen YQ, Ghosh G. Crystal structure of p50/p65 heterodimer of transcription factor NF-kappaB bound to DNA. Nature. 1998;391(6665):410–413. - PubMed
    1. Jacobs MD, Harrison SC. Structure of an IkappaBalpha/NF-kappaB complex. Cell. 1998;95(6):749–758. - PubMed
    1. Huxford T, Huang DB, Malek S, Ghosh G. The crystal structure of the IkappaBalpha/NF-kappaB complex reveals mechanisms of NF-kappaB inactivation. Cell. 1998;95(6):759–770. - PubMed

Publication types