. 2016 Mar 15;8(3):1339-54.
eCollection 2016.

An additive effect of eplerenone to ACE inhibitor on slowing the progression of diabetic nephropathy in the db/db mice

Affiliations

An additive effect of eplerenone to ACE inhibitor on slowing the progression of diabetic nephropathy in the db/db mice

Guangyu Zhou et al. Am J Transl Res. .

Abstract

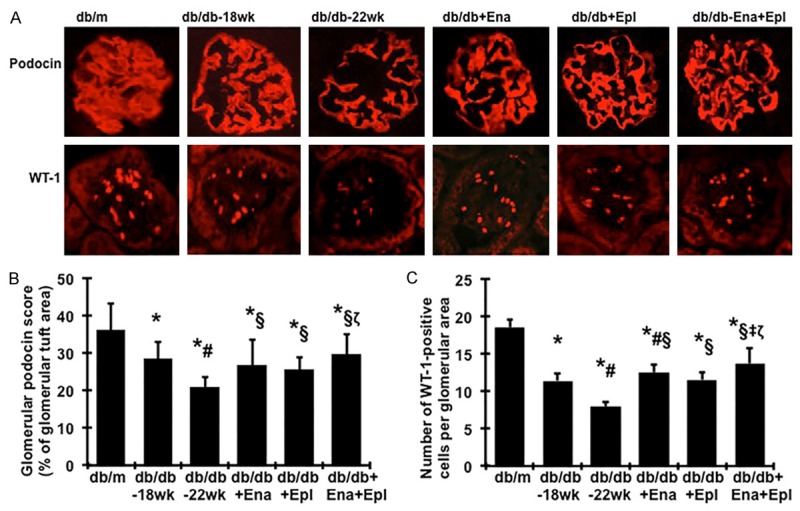
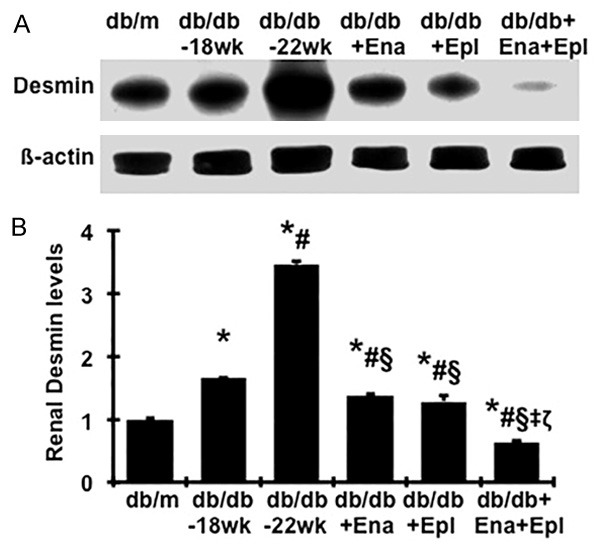
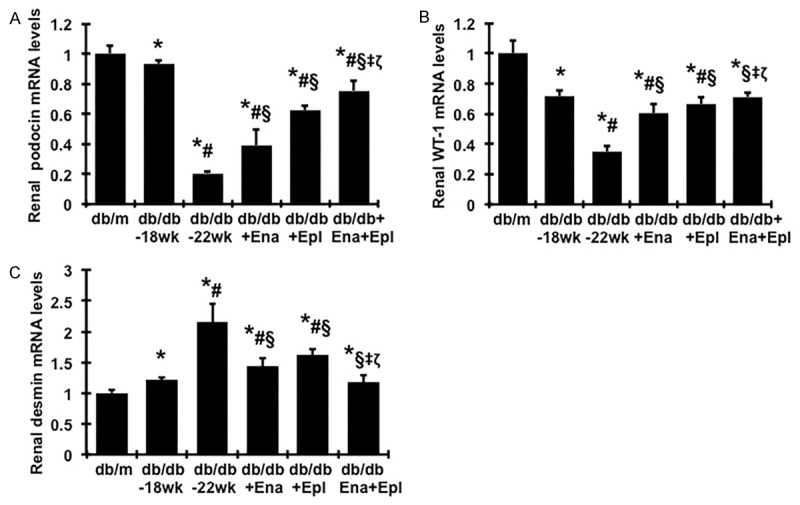
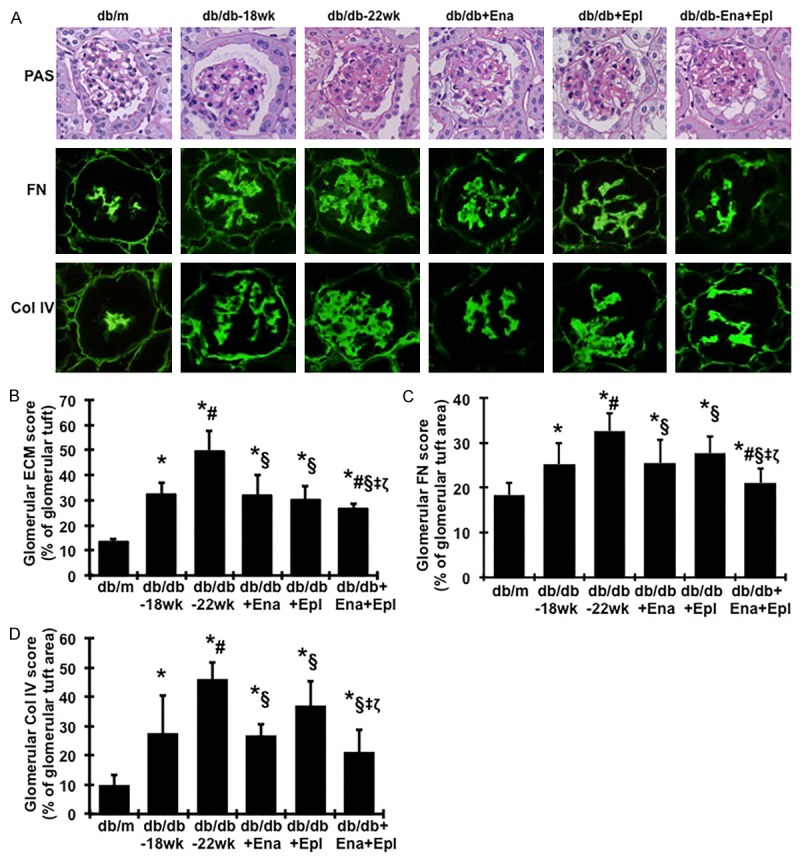
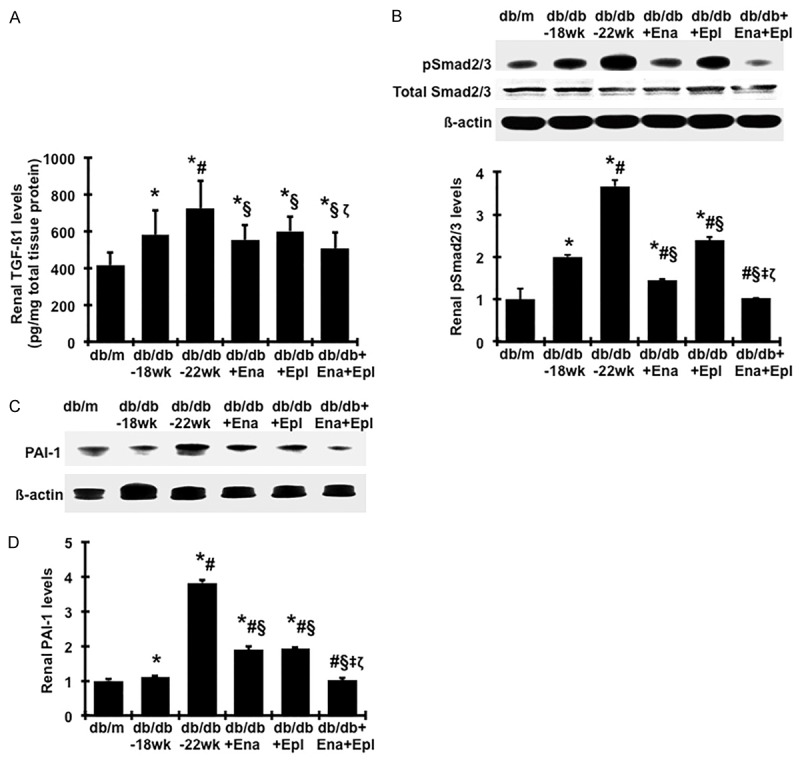
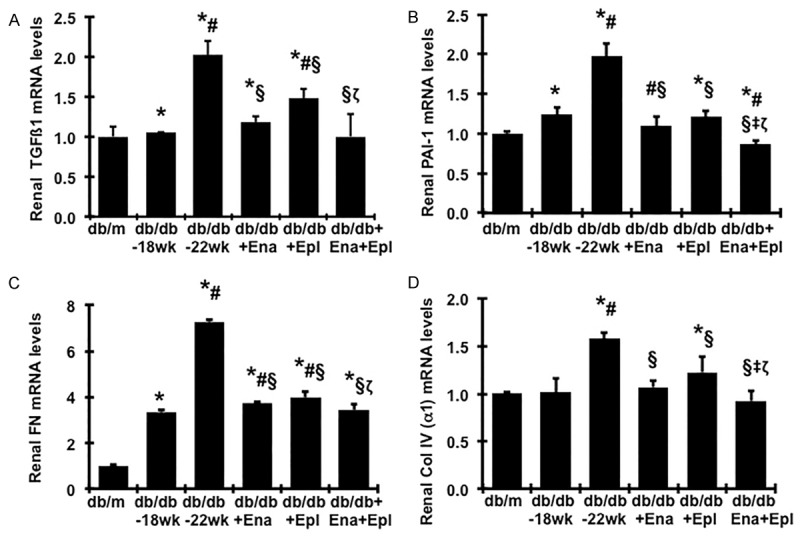
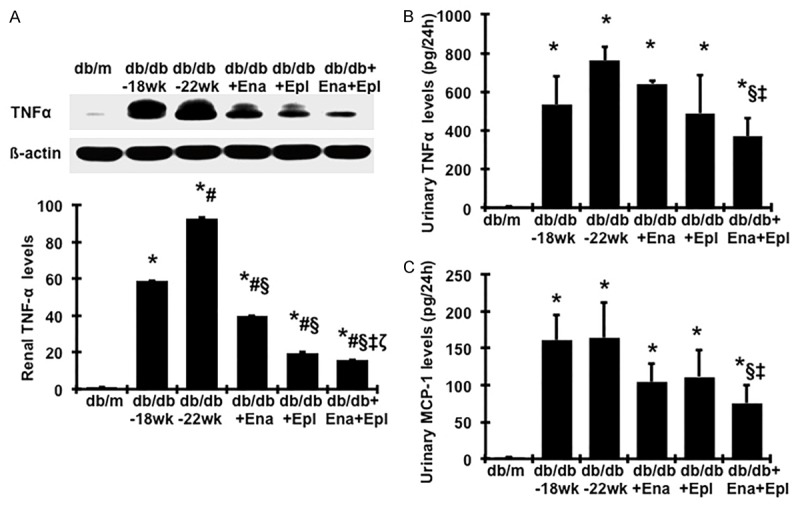
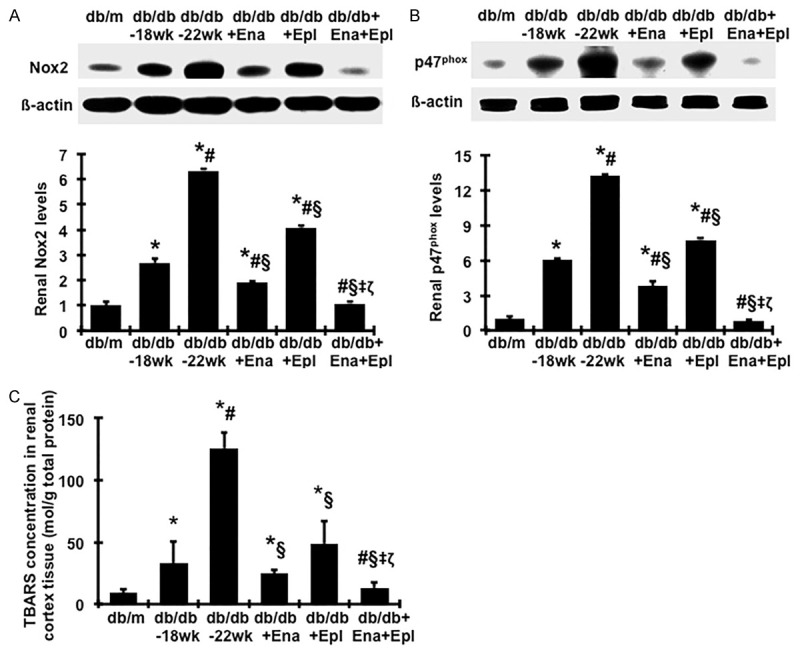
Although blockade of the renin-angiotensin-system (RAS) has become standard therapy for diabetic nephropathy (DN), decline in kidney function towards end-stage renal disease is seen in many patients. Elevated plasma aldosterone often accompanies RAS blockade by a phenomenon known as "aldosterone escape" and activates the mineralocorticoid receptor (MR). We therefore examined whether addition of the MR antagonist eplerenone to an ACEI would enhance the efficacy in slowing the progression of DN. Untreated uninephrectomized diabetic db/db mice developed progressive albuminuria and glomerulosclerosis between weeks 18 and 22, associated with decreased number of podocytes and increased renal expression of fibrotic markers. The therapeutic effect of eplerenone at 100 mg/kg BW/d on albuminuria, podocyte injury and renal fibrosis was similar to that of enalapril given alone at maximally effective doses. Adding eplerenone to enalapril resulted in further reduction in these measurements. Renal expressions of TNF-α, MCP-1, Nox2 and p47phox and renal TBARS levels, markers of inflammation and oxidative stress, were increased during disease progression in diabetic mice, which were reduced by eplerenone or enalapril given alone and further reduced by the two drugs given in combination. However, there were no treatment related effects on plasma K+. Our results suggest that eplerenone is effective in slowing the progression of DN in db/db mice and that the effect is additive to an ACEI. The addition of an MR antagonist void of effects on plasma K+ to an ACEI may offer additional renoprotection in progressive DN via blocking the effects of aldosterone due to escape or diabetes-induction.

Keywords: ACEI; Aldosterone; albuminuria; podocyte; renal fibrosis.


Figures

Figure 1
Figure 1
Effect of enalapril, elperenone and combination therapy on glomerular immunofluorescent staining for podocin and WT-1 in diabetic db/db mice from weeks 18 to 22. (A) Representative photomicrographs (at original magnification × 400) of glomeruli from normal control mice (db/m), diabetic db/db mice without treatment at week 18 (db/db-18 wk) or at week 22 (db/db-22 wk) and diabetic db/db mice treated with enalapril (Ena), eplerenone (Epl), combination of enalapril and eplerenone (Ena+Epl). Graphic representation of glomerular podocin (B) staining scores or glomerular number of WT-1 positive podocytes (C) was shown below. *P<0.05, vs. db/m. #P<0.05, vs. db/db-18 wk. §P<0.05, vs. db/db-22 wk. ‡P<0.05, vs. db/db+Ena. ζP<0.05, vs. db/db+Epl.
Figure 2
Figure 2
Effect of enalapril, elperenone and combination therapy on renal desmin protein levels in diabetic db/db mice from weeks 18 to 22. A. The representative western blots illustrate desmin protein expression. B. The respective graphs summarize the results of band density measurements. Changes in desmin protein expression were determined by normalizing against the densitometric intensity of its β-actin for each sample. For comparison, this ratio was set at unity for normal control samples and other groups were expressed as fold-increase over this value. *P<0.05, vs. db/m. #P<0.05, vs. db/db-18 wk. §P<0.05, vs. db/db-22 wk. ‡P<0.05, vs. db/db+Ena. ζP<0.05, vs. db/db+Epl.
Figure 3
Figure 3
Effect of enalapril, elperenone and combination therapy on renal mRNA expression of podocin (A), WT-1 (B), and desmin (C) in diabetic db/db mice from weeks 18 to 22. Expression of mRNA was determined by real-time RT/PCR. Changes in mRNA levels were determined by first correcting the amplification of β-actin for each sample. For comparison, this ratio was set at unity for normal control samples and other groups were expressed as fold-increase over this value. *P<0.05, vs. db/m. #P<0.05, vs. db/db-18 wk. §P<0.05, vs. db/db-22 wk. ‡P<0.05, vs. db/db+Ena. ζP<0.05, vs. db/db+Epl.
Figure 4
Figure 4
Effect of enalapril, elperenone and combination therapy on glomerular matrix protein accumulation in diabetic db/db mice from weeks 18 to 22. (A) The histological sections stained with PAS and glomerular immunofluorescent staining for fibronectin (FN) and type IV collagen (Col IV) are presented at 400 × magnification. Representative photomicrographs of glomeruli from normal control mice (db/m), diabetic db/db mice without treatment at week 18 (db/db-18 wk) or at week 22 (db/db-22 wk) and diabetic db/db mice treated with enalapril (Ena), eplerenone (Epl), combination of enalapril and eplerenone (Ena+Epl). Graphic representations of glomerular matrix score (B), FN staining score (C) and Col IV staining score (D) are shown below. *P<0.05, vs. db/m. #P<0.05, vs. db/db-18 wk. §P<0.05, vs. db/db-22 wk. ‡P<0.05, vs. db/db+Ena. ζP<0.05, vs. db/db+Epl.
Figure 5
Figure 5
Effect of enalapril, elperenone and combination therapy on renal production of profibrotic markers in diabetic db/db mice from weeks 18 to 22. (A) Total TGFβ1 protein levels in renal cortical tissues were measured by ELISA. (B-D) Renal Smad2 signaling and protein production of PAI-1 were determined by western blot assay. The representative western blots illustrate phosphorylated Smad2/3 (p-Smad2/3), total Smad2/3 and β-actin protein expression (B) PAI-1 and β-actin protein expression (C) in renal cortical tissue tissues. The graphs summarize the results of band density measurements for PAI-1 (D). *P<0.05, vs. db/m. #P<0.05, vs. db/db-18 wk. §P<0.05, vs. db/db-22 wk. ‡P<0.05, vs. db/db+Ena. ζP<0.05, vs. db/db+Epl.
Figure 6
Figure 6
Effect of enalapril, elperenone and combination therapy on renal mRNA expression of fibrotic markers in diabetic db/db mice from weeks 18 to 22. Expression of mRNA was determined by real-time RT/PCR. Changes in mRNA levels were determined by first correcting the amplification of β-actin for each sample. For comparison, this ratio was set at unity for normal control (db/m) samples and other groups were expressed as fold-increase over this value. A. Expression of TGF-β1mRNA. B. Expression of PAI-1 mRNA. C. Expression of FN mRNA. D. Expression of type α1 (IV) collagen mRNA. *P<0.05, vs. db/m. #P<0.05, vs. db/db-18 wk. §P<0.05, vs. db/db-22 wk. ‡P<0.05, vs. db/db+Ena. ζP<0.05, vs. db/db+Epl.
Figure 7
Figure 7
Effect of enalapril, elperenone and combination therapy on protein production of TNFα in renal cortical tissue and urine TNFα and MCP-1 levels. (A) Representative western blots illustrating TNFα and β-actin protein expression. The lower respective graph summarizes the results of band density measurements. Urinary TNFα (B) MCP-1 (C) levels were measured by ELISA. *P<0.05, vs. db/m. #P<0.05, vs. db/db-18 wk. §P<0.05, vs. db/db-22 wk. ‡P<0.05, vs. db/db+Ena. ζP<0.05, vs. db/db+Epl. Diabetic db/db mice were treated with enalapril (Ena), eplerenone (Epl), combination of enalapril and eplerenone (Ena+Epl) from weeks 18 to 22.
Figure 8
Figure 8
Effect of enalapril, elperenone and combination therapy on protein production of renal NAPDH oxidases and the TBARS levels in renal cortex tissue. Representative western blots illustrate Nox2, p47phox and β-actin protein expression and graphic representation of the mean band intensity of Nox2 (A) and p47phox (B) normalized against the band intensity of β-actin. (C) Renal TBARS levels were detected by a colorimetric assay. *P<0.05, vs. db/m. #P<0.05, vs. db/db-18 wk. §P<0.05, vs. db/db-22 wk. ‡P<0.05, vs. db/db+Ena. ζP<0.05, vs. db/db+Epl. Diabetic db/db mice were treated with enalapril (Ena), eplerenone (Epl), combination of enalapril and eplerenone (Ena+Epl) from weeks 18 to 22.

References

    1. Kagami S, Border WA, Miller DE, Noble NA. Angiotensin II stimulates extracellular matrix protein synthesis through induction of transforming growth factor-beta expression in rat glomerular mesangial cells. J Clin Invest. 1994;93:2431–2437. - PMC - PubMed
    1. Morgan T, Anderson A, Bertram D, MacInnis RJ. Effect of candesartan and lisinopril alone and in combination on blood pressure and microalbuminuria. J Renin Angiotensin Aldosterone Syst. 2004;5:64–71. - PubMed
    1. Forclaz A, Maillard M, Nussberger J, Brunner HR, Burnier M. Angiotensin II receptor blockade: is there truly a benefit of adding an ACE inhibitor? Hypertension. 2003;41:31–36. - PubMed
    1. Doulton TW. ACE inhibitor-angiotensin receptor blocker combinations: a clinician’s perspective. Mini Rev Med Chem. 2006;6:491–497. - PubMed
    1. Peters H, Border WA, Noble NA. Targeting TGFbeta overexpression in renal disease: maximizing the antifibrotic action of angiotensin II blockade. Kidney Int. 1998;54:1570–1580. - PubMed

LinkOut - more resources