

Na(+)/Ca(2+) exchanger 1 (NCX-1) mediates the anti-apoptotic effect of Akt1 in neonatal rat cardiomyocytes during ischemia/reperfusion
- PMID: 27186265
- PMCID: PMC4859625
Na(+)/Ca(2+) exchanger 1 (NCX-1) mediates the anti-apoptotic effect of Akt1 in neonatal rat cardiomyocytes during ischemia/reperfusion
Abstract
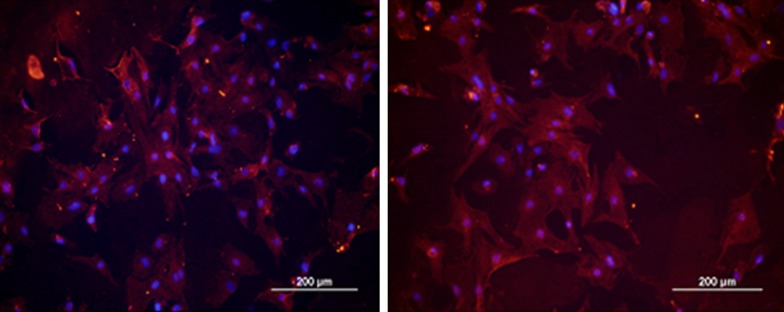
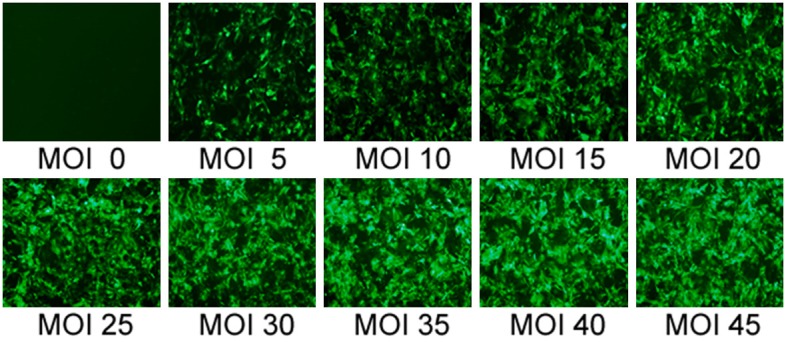
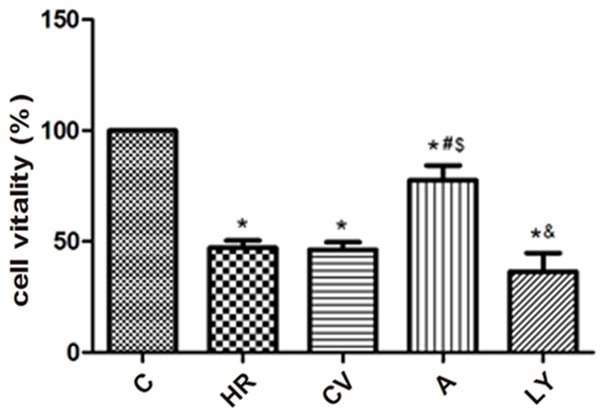
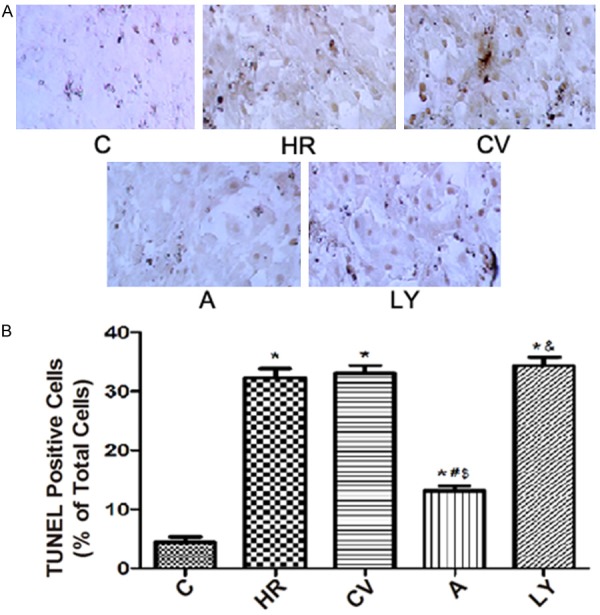
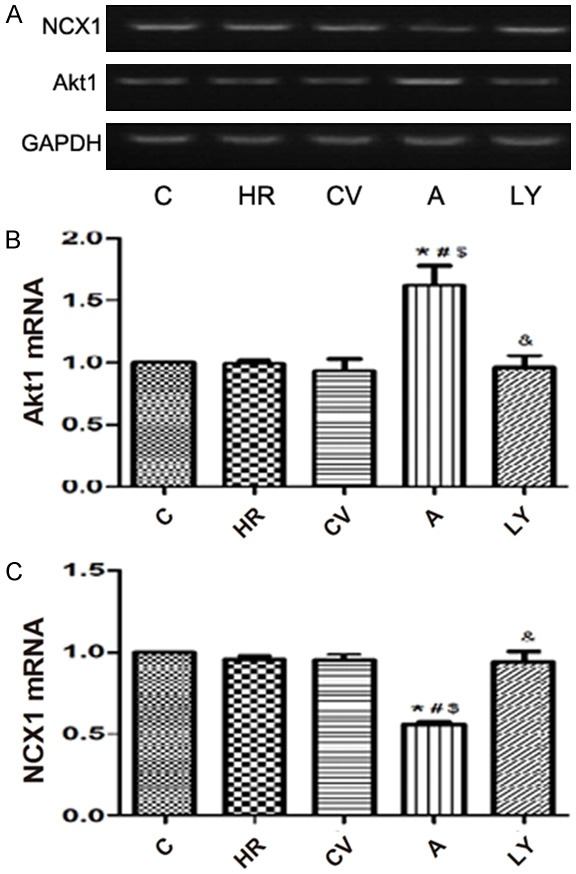
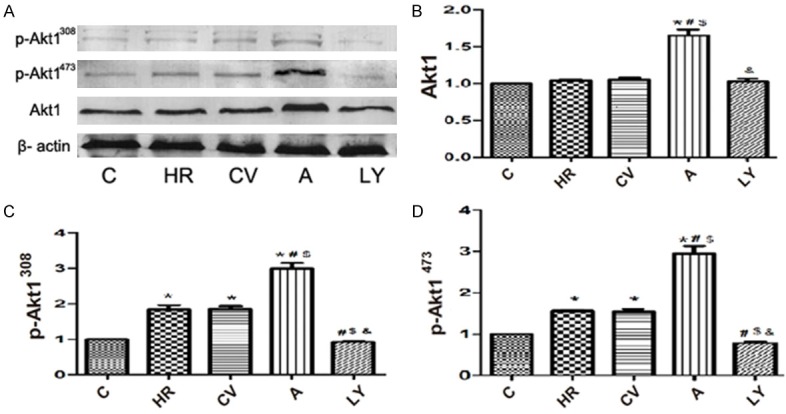
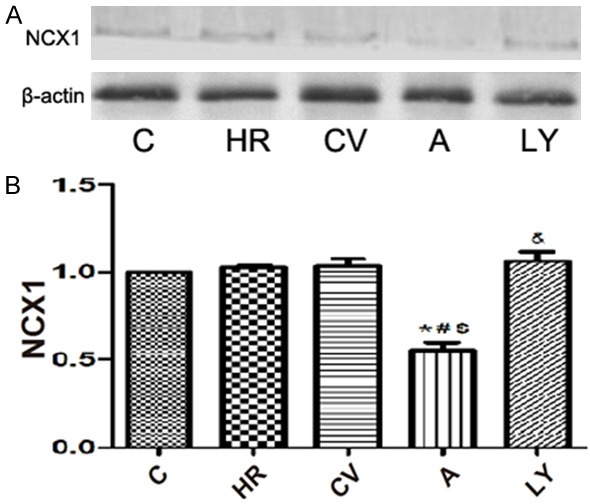
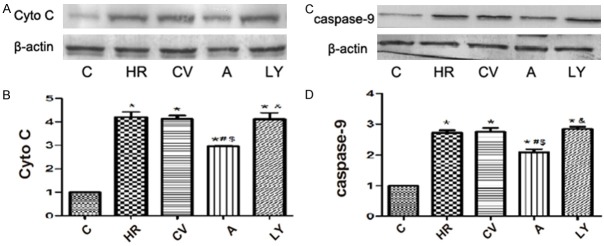
The purpose of this study was to investigate the anti-apoptotic role of Akt1 gene in neonatal rat cardiomyocytes and the relationship with Na(+)/Ca(2+) exchanger 1 (NCX1) during ischemia/reperfusion (IR). The cultured original rat cardiomyocytes were randomly divided into five groups: normal control group (C group), hypoxia/reoxygenation group (HR group), the control vector pLVX-EGFP-3FLAG group (CV group), the gene pLVX-EGFP-3FLAG-Akt1 transfection group (A group), and Akt1 inhibitor LY294002 group (LY group). Cardiomyocyte vitality was determined using MTT, and the apoptosis was determined by TUNEL to verify the anti-apoptotic role of Akt1. The mRNA levels of Akt1 and NCX1 were determined by RT-PCR, the protein expression of Akt1, p-Akt1, NCX1 and the apoptotic proteins of mitochondrial pathway cytochrome C (Cyto C) and caspase-9 were measured by Western blot. As a result, transfected Akt1 (A group) showed increased myocardial cell viability and reduced apoptosis, with increase in Akt1 expression and decrease in NCX1 expression. The levels of apoptotic proteins Cyto C and caspase-9 also declined. This study demonstrated that lentivirus-mediated transfection of Akt1 played an anti-apoptotic role during IR of rat cardiomyocytes, via inhibition of NCX1 and other mitochondrial proteins.
Keywords: Akt1; NCX1; apoptosis; cardiomyocytes; ischemia/reperfusion.
Figures
Similar articles
-
Lentiviral-mediated overexpression of Akt1 reduces anoxia-reoxygenation injury in cardiomyocytes.Cell Biol Int. 2014 Apr;38(4):488-96. doi: 10.1002/cbin.10234. Epub 2014 Jan 16. Cell Biol Int. 2014. PMID: 24375547
-
[EFFECT OF Akt1 GENE TRANSFECTION ON HYPOXIA TOLERANCE OF BONE MARROW MESENCHYMAL STEM CELLS].Zhongguo Xiu Fu Chong Jian Wai Ke Za Zhi. 2016 Apr;30(4):479-84. Zhongguo Xiu Fu Chong Jian Wai Ke Za Zhi. 2016. PMID: 27411279 Chinese.
-
Effects of mouse recombinant bone morphogenetic protein-7 transfection on cell apoptosis, NF-kappaB, and downstream genes in cultured primary cardiomyocytes after simulated ischemia and reperfusion injury.J Cardiovasc Pharmacol. 2010 Jul;56(1):69-77. doi: 10.1097/FJC.0b013e3181e0badc. J Cardiovasc Pharmacol. 2010. PMID: 20631551
-
Na(+)-Ca(2+) exchanger targeting miR-132 prevents apoptosis of cardiomyocytes under hypoxic condition by suppressing Ca(2+) overload.Biochem Biophys Res Commun. 2015 May 15;460(4):931-7. doi: 10.1016/j.bbrc.2015.03.129. Epub 2015 Apr 1. Biochem Biophys Res Commun. 2015. PMID: 25839659
-
Effect of Si-RNA-silenced HIF-1α gene on myocardial ischemia-reperfusion-induced insulin resistance.Int J Clin Exp Med. 2015 Sep 15;8(9):15514-20. eCollection 2015. Int J Clin Exp Med. 2015. PMID: 26629042 Free PMC article.
References
-
- McCully JD, Wakiyama H, Hsieh YJ, Jones M, Levitsky S. Differential contribution of necrosis and apoptosis in myocardial ischemiareperfusion injury. Am J Physiol Heart Circ Physiol. 2004;286:1923–1935. - PubMed
-
- Armstrong SC. Protein kinase activation and myocardial ischemia/reperfusion injury. Cardiovasc Res. 2004;61:427–436. - PubMed
-
- Du Y, Zhu H, Li D, Wang L, Zhang L, Luo Y, Pan D, Huang M. Lentiviral-mediated overexpression of Akt1 reduces anoxia-reoxygenation injury in cardiomyocytes. Cell Biology International. 2014;38:488–496. - PubMed
-
- Zhang WH, Fu SB, Lu FH, Wu B, Gong DM, Pan ZW, Lv YJ, Zhao YJ, Li QF, Wang R, Yang BF, Xu CQ. Involvement of calcium-sensing receptor in ischemia/reperfusion-induced apoptosis in rat cardiomyocytes. Biochem Biophys Res Commun. 2006;347:872–881. - PubMed
LinkOut - more resources
Full Text Sources
Research Materials
Miscellaneous