. 2016 May 17:7:11539.
doi: 10.1038/ncomms11539.

Biological and physical controls in the Southern Ocean on past millennial-scale atmospheric CO2 changes

Affiliations

Biological and physical controls in the Southern Ocean on past millennial-scale atmospheric CO2 changes

Julia Gottschalk et al. Nat Commun. .

Abstract

Millennial-scale climate changes during the last glacial period and deglaciation were accompanied by rapid changes in atmospheric CO2 that remain unexplained. While the role of the Southern Ocean as a 'control valve' on ocean-atmosphere CO2 exchange has been emphasized, the exact nature of this role, in particular the relative contributions of physical (for example, ocean dynamics and air-sea gas exchange) versus biological processes (for example, export productivity), remains poorly constrained. Here we combine reconstructions of bottom-water [O2], export production and (14)C ventilation ages in the sub-Antarctic Atlantic, and show that atmospheric CO2 pulses during the last glacial- and deglacial periods were consistently accompanied by decreases in the biological export of carbon and increases in deep-ocean ventilation via southern-sourced water masses. These findings demonstrate how the Southern Ocean's 'organic carbon pump' has exerted a tight control on atmospheric CO2, and thus global climate, specifically via a synergy of both physical and biological processes.


Figures
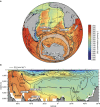
Figure 1
Figure 1. Modern ocean DIC and oxygen concentrations.
DIC levels (shaded) and [O2] (contours, in μmol kg−1) in (a) Southern Ocean- and Atlantic Ocean bottom waters and (b) in a meridional transect across the Atlantic (averaged between 70°W and 20°E). Hatched area broadly represents the region, where the deep DIC reservoir directly ‘communicates' with the surface ocean and the atmosphere along steep density surfaces (equivalent to the area of strong positive CO2 fluxes across the air–sea interface in austral winter in the Southern Ocean64), which is unique in the global ocean today. White circles show study cores and open symbols mark the location of ice cores that document past changes in atmospheric CO2 (CO2,atm; as in Figs 2 and 3). Thick lines show the modern positions of the PF, the sub-Antarctic Front (SAF) and the sub-Tropical Front (STF) (south to north). Arrows show general pathways of North Atlantic Deep Water (NADW), AABW (Antarctic Bottom Water), CDW (Circumpolar Deep Water) and Antarctic Intermediate Water (AAIW).
Figure 2
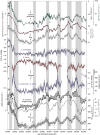
Figure 2. Sub-Antarctic Atlantic bottom-water [O2] and productivity changes during the last deglacial and glacial periods.
(a) Sedimentary opal content (line) and 230Thorium-normalized opal fluxes (circles), (b) flux of TOC in PS2498-1 (ref. ; age scale adjusted as outlined in Methods), (c) Antarctic (EDC ice core) dust fluxes, (d) C. kullenbergi δ13C (versus Vienna Pee Dee Belemnite (VPDB) standard), (e) G. affinis δ13C (versus VPDB), (f) Δδ13CC. kullenbergiG. affinis and corresponding bottom-water [O2] (ref. 16), arrow shows modern [O2] at the core site, (g) G. bulloides (circles) and Uvigerina spp. (triangles) U/Mnc, (h) authigenic uranium concentrations in TN057-21 (ref. 27), (i) CO2,atm variations recorded in the Antarctic ice cores BYRD (diamonds), EDML (crosses), EDC (right-pointed triangles), Siple Dome (squares), Talos Dome (triangles), Taylor Dome (circles) and WDC (inverted triangles). All data refer to the AICC2012 age scale. Lines in df show 500 year-running averages with envelopes indicating the 500 year-window one-sigma standard deviation. Grey bars indicate periods of rising CO2,atm.
Figure 3
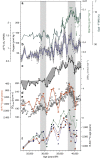
Figure 3. Mid-glacial ventilation and carbon sequestration changes in the deep sub-Antarctic Atlantic.
(a) Sedimentary opal content (line) and 230Thorium-normalized opal fluxes (circles), (b) Δδ13CC. kullenbergiG. affinis and corresponding bottom-water [O2] (ref. 16), (c) G. bulloides (circles) and Uvigerina spp. (triangles) U/Mnc, (d) Benthic-Planktonic (B-Pl) 14C ventilation ages and the corresponding 1,000 years-running mean (thick line) plotted on top of (e) variations in CO2,atm recorded in the Antarctic ice cores (open symbols, refs as in Fig. 2), (f) benthic foraminifer 14C age offset from atmospheric 14C (Lake Suigetsu (green), Cariaco Basin (orange), Intcal09 (blue) and Intcal13 (dark blue)77) shown as 1,000 years-running means (lines). Line and grey envelope in b show a 500 year-running average and the 500 year-window one-sigma standard deviation, respectively. Grey bars indicate periods of rising CO2,atm.
Figure 4
Figure 4. Schematic view on the southern high-latitude Atlantic during millennial-scale CO2,atm variations based on new and existing proxy evidence.
(a) Dust-driven decreases of export production in the sub-Antarctic Atlantic during the last glacial and deglacial periods were accompanied by decreases in deep carbon storage in the Southern Ocean (this study and ref. 48). The latter was further promoted by increases in the air-sea CO2 exchange south of the PF and in the ventilation of the deep carbon pool (this study and ref. 48), causing millennial-scale increases in CO2,atm, as postulated earlier. (b) Enhanced dust-driven, biological export of carbon to the deep sub-Antarctic Atlantic paralleled increases in deep Southern Ocean respired carbon levels during the last glacial period and the last deglaciation (this study and ref. 48). The enhanced Southern Ocean carbon pool was effectively isolated from the atmosphere by decreases in air–sea CO2 equilibration in the Antarctic region and a poor 'ventilation' of the deep-ocean during these times (this study and ref. 48), leading to decreases in CO2,atm during the last 70,000 years, as proposed previously. Accompanying changes in sea ice and the westerly position/strength are debated and remain speculative. The modern positions of ocean fronts (as in Fig. 1) and ocean density surfaces (white lines) are shown as reference.

References

    1. Sigman D. M. & Boyle E. A. Glacial/interglacial variations in atmospheric carbon dioxide. Nature 407, 859–869 (2000). - PubMed
    1. Ito T. & Follows M. J. Preformed phosphate, soft tissue pump and atmospheric CO2. J. Mar. Res. 63, 813–839 (2005).
    1. Schmittner A. & Galbraith E. D. Glacial greenhouse-gas fluctuations controlled by ocean circulation changes. Nature 456, 373–376 (2008). - PubMed
    1. Martin J. H. Glacial-interglacial CO2 change: the iron hypothesis. Paleoceanography 5, 1–13 (1990).
    1. Ferrari R. et al.. Antarctic sea ice control on ocean circulation in present and glacial climates. Proc. Natl. Acad. Sci. USA 111, 8753–8758 (2014). - PMC - PubMed

Publication types

LinkOut - more resources