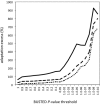
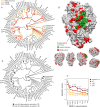
. 2016 May 17:5:e12469.
doi: 10.7554/eLife.12469.

Viruses are a dominant driver of protein adaptation in mammals

Affiliations

Viruses are a dominant driver of protein adaptation in mammals

David Enard et al. Elife. .

Abstract

Viruses interact with hundreds to thousands of proteins in mammals, yet adaptation against viruses has only been studied in a few proteins specialized in antiviral defense. Whether adaptation to viruses typically involves only specialized antiviral proteins or affects a broad array of virus-interacting proteins is unknown. Here, we analyze adaptation in ~1300 virus-interacting proteins manually curated from a set of 9900 proteins conserved in all sequenced mammalian genomes. We show that viruses (i) use the more evolutionarily constrained proteins within the cellular functions they interact with and that (ii) despite this high constraint, virus-interacting proteins account for a high proportion of all protein adaptation in humans and other mammals. Adaptation is elevated in virus-interacting proteins across all functional categories, including both immune and non-immune functions. We conservatively estimate that viruses have driven close to 30% of all adaptive amino acid changes in the part of the human proteome conserved within mammals. Our results suggest that viruses are one of the most dominant drivers of evolutionary change across mammalian and human proteomes.

Keywords: adaptive evolution; computational biology; evolutionary biology; genomics; host/pathogen interactions; human; human evolution; mammals; systems biology; viruses.


Conflict of interest statement

The authors declare that no competing interests exist.

Figures
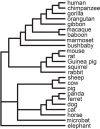
Figure 1.
Figure 1.. Tree of 24 mammals used in the analysis.
DOI: http://dx.doi.org/10.7554/eLife.12469.003
Figure 2.
Figure 2.. Number of VIPs discovered per year until 2014.
DOI: http://dx.doi.org/10.7554/eLife.12469.004
Figure 3.
Figure 3.. Patterns of purifying selection in VIPs.
(A) Distribution of pN/pS in VIPs (blue) and non-VIPs (pink). The blue curve is the density curve of pN/(pS+1) for 1256 VIPs. We use pN/(pS+1) instead of pN/pS to account for those coding sequences where pS=0. pN and pS are measured using great ape genomes from the Great Ape Genome Project (Materials and methods). The pink area represents the superimposition of the density curves for each of 5000 sets of randomly sampled non-VIPs. (B) Average pN/pS in VIPs (blue dot) versus average pN/pS in non-VIPs (red dot and red 95% confidence interval) within ten viruses with more than 50 VIPs The number between parentheses is the number of VIPs for each virus. KSHV: Kaposi’s Sarcoma Herpesvirus. HIV-1: Human Immunodeficiency Virus type 1. HBV: Hepatitis B Virus. ADV: Adenovirus. HPV: Human Papillomavirus. HSV: Herpes Simplex Virus. EBV: Epstein-Barr Virus. Influenza: Influenza Virus. HTLV: Human T-lymphotropic Virus. HCV: Hepatitis C virus. (C) Same as B), but for the 20 most high level GO processes with the highest number of VIPs. The full GO process name for “protein modification” as written in the figure is “post-translational protein modification”. DOI: http://dx.doi.org/10.7554/eLife.12469.005
Figure 3—figure supplement 1.
Figure 3—figure supplement 1.. Site Frequency Spectrum of non-synonymous variants in VIPs and non-VIPs in African populations Red: VIPs.
Blue: non-VIPs. The number pN for non-VIPs is rescaled to the actual number pN multiplied by the number of VIPs divided by the number of non-VIPs so that VIPs and non-VIPs can be compared. The x-axis gives the upper threshold for each bin. For example for the second bin, the upper frequency threshold is 0.002 and the lower frequency is 0.001, which is also the upper threshold of the first bin. DOI: http://dx.doi.org/10.7554/eLife.12469.006
Figure 4.
Figure 4.. Patterns of human adaptation in VIPs.
(A) Classic MK test (Materials and methods) for VIPs (blue dot) and non-VIPs (red dot and 95% confidence interval) for the ten viruses with 50 or more VIPs. (B) Same as A) but for the 20 top high level GO processes with the most VIPs below the dotted black line. Above the dotted black line: the classic MK test for all VIPs, for non-immune VIPs and for immune VIPs (Supplementary file 1D). (C) Asymptotic MK test (Materials and methods) for the proportion of adaptive amino acid substitutions (α) in VIPs (blue dots and curve) and non-VIPs (red dots and curve). Pink area: superposition of fitted logarithmic curves (Materials and methods) for 5000 random sets of 1256 non-VIPs (as many as VIPs) where the estimated α falls within α‘s 95% confidence interval. DOI: http://dx.doi.org/10.7554/eLife.12469.007
Figure 5.
Figure 5.. Excess of adaptation across mammals in VIPs The excess of adaptation is measured as the extra percentage of adaptation in VIPs compared to non-VIPs.
For example, if VIPs have 1.5 times or 50% more adaptation, then the adaptation excess is 50%. (A) Thick black curve: average excess of adaptation in all VIPs. Dotted black curves: 95% confidence interval for the excess of adaptation in all VIPs. Thick grey curve: excess of adaptation in non-immune VIPs. Dotted grey curves: 95% confidence interval for the excess of adaptation in non-immune VIPs. (B) Virus-by-virus excess of adaptation in VIPs. Black dot is the average excess and the represented interval is the 95% confidence interval. Excess is shown for BUSTED p≤0.5. (C) Excess of adaptation within the top 20 high-level GO processes with the most VIPs. Excess is shown for BUSTED p≤0.5. (D) Proportions of selected codons in VIPs (blue dot) and non-VIPs (red dot and 95% confidence interval) in the mammalian clades represented by more than one species in the tree. All: entire tree. Primata: primates. Glires: rodents and rabbit. Cetartyodactyla: sheep, cow, pig. Zooamata: carnivores and horse. Excess is shown for BUSTED p≤0.5. DOI: http://dx.doi.org/10.7554/eLife.12469.008
Figure 5—figure supplement 1.
Figure 5—figure supplement 1.. How to compare VIPs and non-VIPs across mammals Red: part of dN/dS explained by adaptive evolution.
Grey: part of dN/dS explained by neutral evolution. Non-VIP I has the same amount of purifying selection as the VIP. Non-VIPs number II, III and IV have the same dN/dS as the VIP. Non-VIP II has the same amount of purifying selection as the VIP, non-VIP III has less purifying selection (more neutral evolution) and non-VIP IV has more purifying selection. In all cases, matching by dN/dS would be overly conservative. Upper arrow: observed dN/dS. Lower arrow: expected dN/dS if there was no adaptive evolution and only neutral evolution. DOI: http://dx.doi.org/10.7554/eLife.12469.009
Figure 5—figure supplement 2.
Figure 5—figure supplement 2.. Scheme for the permutation test with a target average using the example of purifying selection.
A full explanation of the permutation scheme is provided in Materials and methods. In brief, we sample non-VIPs that maintain the cumulated average of all sampled non-VIPs within the target interval [dN(inf);dN(sup)] (blue dots on the scheme). Every fixed number of sampled non-VIPs, we authorize one non-VIPs to drive the cumulated average outside of the target interval (red dots). When it does happen that the cumulated average is driven outside of the interval, we sample as many non-VIPs as necessary that decrease or increase the cumulated average back to the target interval based on whether the cumulated average is above or below the target interval (grey dots). DOI: http://dx.doi.org/10.7554/eLife.12469.010
Figure 5—figure supplement 3.
Figure 5—figure supplement 3.. Contributions of the number of genes, number of branches and proportion of selected codons to the excess of adaptation in VIPs.
The excess of adaptation could be due to more genes with evidence of adaptation, more branches per gene with adaptation, and/or a greater proportion of selected codons per branch. Upper plain line: excess of adaptation in VIPs measured using the proportion of selected codons. Middle dotted line: excess of adaptation in VIPs measured using the number of branches with evidence of adaptation. Lower dotted line: excess of adaptation measured by counting the number of genes with evidence of adaptation. DOI: http://dx.doi.org/10.7554/eLife.12469.011
Figure 6.
Figure 6.. Examples of mammalian orthologs with adaptation spread across clades.
(A) Signals of adaptation in eight antiviral proteins with well-known adaptation across mammals. Red: BS-REL p≤0.001. Orange: BS-REL p≤0.05. Yellow: BS-REL p≤0.1. (B) Top eight antiviral proteins with the highest number of branches under selection, and no previously know adaption spread across mammals. Note that adaptation was previously found for TRIM21 in primates but no other mammalian clade (Malfavon-Borja et al., 2013). (C) Top eight non-antiviral proteins with well-known functions and the highest number of branches under selection across mammals. Proteins are ordered according to the number of branches with signals of adaptation. DOI: http://dx.doi.org/10.7554/eLife.12469.012
Figure 7.
Figure 7.. Patterns of adaptation to coronaviruses in aminopeptidase N.
(A) BS-REL test results for ANPEP in a tree of 84 mammalian species. Legend is on the figure. (B) Contact surface with PRCV and TGEV on ANPEP structure (PDB 4FYQ). The figure includes visualizations of all the six different faces of ANPEP. Legend is in the figure. (C) Excess of adaptation in and near the contact interface with PRCV and TGEV. Within the contact interface plus a given number of neighboring amino acids (one, five, ten or 20 in the figure), adaptation excess (y axis) is defined as the number of observed codons with a MEME P-value lower than the P-value threshold on the x axis, divided by the average number of codons under the same P-value threshold obtained after randomizing the location of adaptation signals over the entire ANPEP coding sequence 5000 times. Dark red curve: adaptation excess within the contact interface with TGEV and PRCV plus one neighboring amino acid. Red curve: plus five neighboring amino acids. Orange: plus ten neighboring amino acids. Light orange: plus 20 neighboring amino acids. Numbers in the figure represent the number of adapting codons, and the stars give the significance of the excess. One star: excess p≤0.05. Two stars: p≤0.01. (D) Losses and gains of the N-glycosylation across the mammalian phylogeny. DOI: http://dx.doi.org/10.7554/eLife.12469.013

Comment in

  • At the mercy of viruses.
    Wilke CO, Sawyer SL. Wilke CO, et al. Elife. 2016 May 17;5:e16758. doi: 10.7554/eLife.16758. Elife. 2016. PMID: 27187565 Free PMC article.

References

    1. Abecasis GR, Auton A, Brooks LD, DePristo MA, Durbin RM, Handsaker RE, Kang HM, Marth GT, McVean GA, 1000 Genomes Project Consortium An integrated map of genetic variation from 1,092 human genomes. Nature. 2012;491:56–65. doi: 10.1038/nature11632. - DOI - PMC - PubMed
    1. GTEx Consortium Human genomics. the genotype-tissue expression (gtex) pilot analysis: Multitissue gene regulation in humans. Science. 2015;348:648–660. doi: 10.1126/science.1262110. - DOI - PMC - PubMed
    1. Ashburner M, Ball CA, Blake JA, Botstein D, Butler H, Cherry JM, Davis AP, Dolinski K, Dwight SS, Eppig JT, Harris MA, Hill DP, Issel-Tarver L, Kasarskis A, Lewis S, Matese JC, Richardson JE, Ringwald M, Rubin GM, Sherlock G. Gene ontology: Tool for the unification of biology. the gene ontology consortium. Nature Genetics. 2000;25:25–29. doi: 10.1038/75556. - DOI - PMC - PubMed
    1. Bause E. Structural requirements of n-glycosylation of proteins. studies with proline peptides as conformational probes. The Biochemical Journal. 1983;209:331–336. doi: 10.1042/bj2090331. - DOI - PMC - PubMed
    1. Bierne N, Eyre-Walker A. The genomic rate of adaptive amino acid substitution in drosophila. Molecular Biology and Evolution. 2004;21:1350–1360. doi: 10.1093/molbev/msh134. - DOI - PubMed

Publication types