

Reprogramming of Pancreatic Exocrine Cells AR42J Into Insulin-producing Cells Using mRNAs for Pdx1, Ngn3, and MafA Transcription Factors
- PMID: 27187823
- PMCID: PMC5014516
- DOI: 10.1038/mtna.2016.33
Reprogramming of Pancreatic Exocrine Cells AR42J Into Insulin-producing Cells Using mRNAs for Pdx1, Ngn3, and MafA Transcription Factors
Abstract
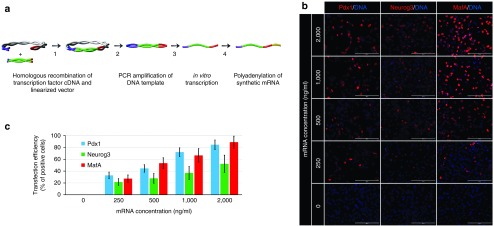
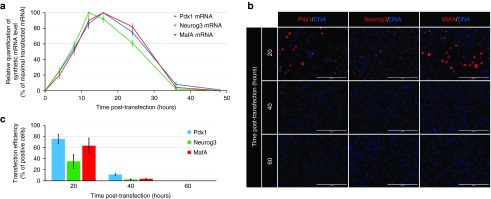
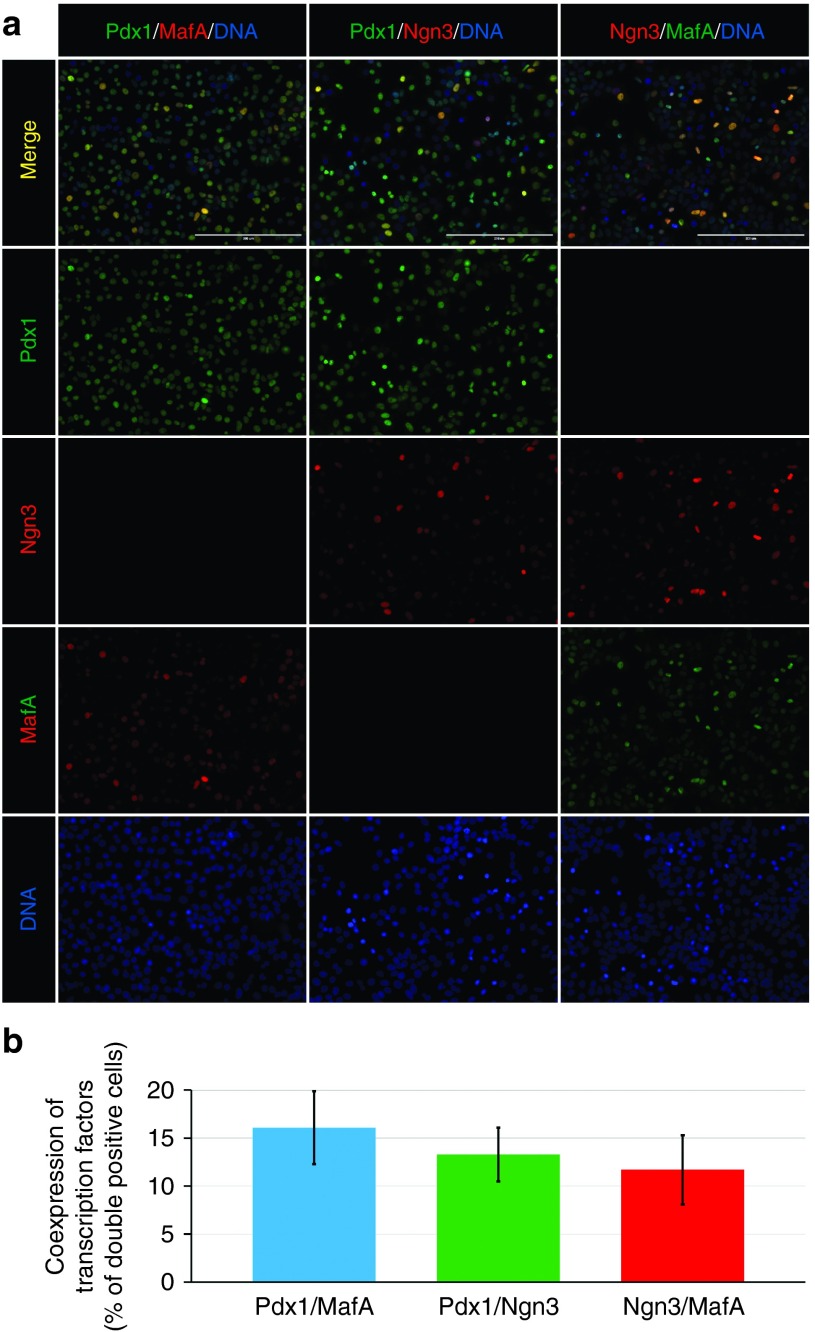
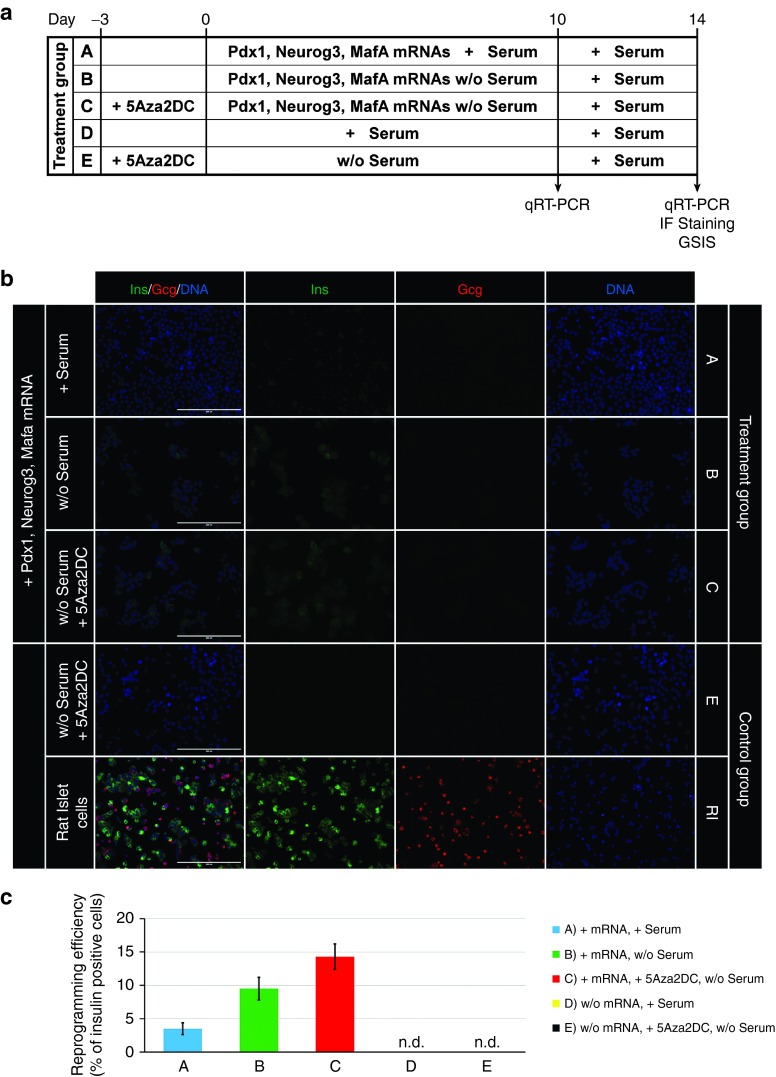
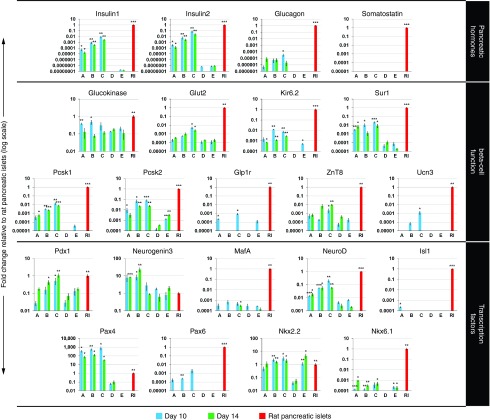
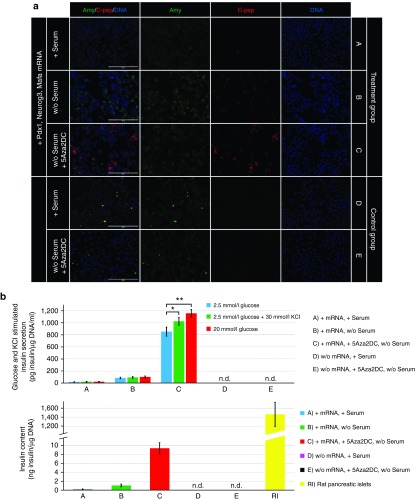
Direct reprogramming of pancreatic nonendocrine cells into insulin-producing β-cells represents a promising approach for the treatment of insulin-dependent diabetes. However, its clinical application is limited by the potential for insertional mutagenesis associated with the viral vectors currently used for cell reprogramming. With the aim of developing a nonintegrative reprogramming strategy for derivation of insulin-producing cells, here, we evaluated a new approach utilizing synthetic messenger RNAs encoding reprogramming transcription factors. Administration of synthetic mRNAs encoding three key transcription regulators of β-cell differentiation-Pdx1, Neurogenin3, and MafA-efficiently reprogrammed the pancreatic exocrine cells into insulin-producing cells. In addition to the insulin genes expression, the synthetic mRNAs also induced the expressions of genes important for proper pancreatic β-cell function, including Sur1, Kir6.2, Pcsk1, and Pcsk2. Pretreating cells with the chromatin-modifying agent 5-Aza-2'-deoxycytidine further enhanced reprogramming efficiency, increasing the proportion of insulin-producing cells from 3.5 ± 0.9 to 14.3 ± 1.9% (n = 4). Moreover, 5-Aza-2'-deoxycytidine pretreatment enabled the reprogrammed cells to respond to glucose challenge with increased insulin secretion. In conclusion, our results support that the reprogramming of pancreatic exocrine cells into insulin-producing cells, induced by synthetic mRNAs encoding pancreatic transcription factors, represents a promising approach for cell-based diabetes therapy.
Figures
Similar articles
-
Reprogramming of pancreatic exocrine cells towards a beta (β) cell character using Pdx1, Ngn3 and MafA.Biochem J. 2012 Mar 15;442(3):539-50. doi: 10.1042/BJ20111678. Biochem J. 2012. PMID: 22150363 Free PMC article.
-
Enhanced insulin production and reprogramming efficiency of mesenchymal stem cells derived from porcine pancreas using suitable induction medium.Xenotransplantation. 2019 Jan;26(1):e12451. doi: 10.1111/xen.12451. Epub 2018 Sep 5. Xenotransplantation. 2019. PMID: 30252163
-
Reprogramming Mouse Cells With a Pancreatic Duct Phenotype to Insulin-Producing β-Like Cells.Endocrinology. 2015 Jun;156(6):2029-38. doi: 10.1210/en.2014-1987. Epub 2015 Apr 2. Endocrinology. 2015. PMID: 25836667 Free PMC article.
-
PDX1, Neurogenin-3, and MAFA: critical transcription regulators for beta cell development and regeneration.Stem Cell Res Ther. 2017 Nov 2;8(1):240. doi: 10.1186/s13287-017-0694-z. Stem Cell Res Ther. 2017. PMID: 29096722 Free PMC article. Review.
-
Molecular mechanisms of transcription factor mediated cell reprogramming: conversion of liver to pancreas.Biochem Soc Trans. 2021 Apr 30;49(2):579-590. doi: 10.1042/BST20200219. Biochem Soc Trans. 2021. PMID: 33666218 Free PMC article. Review.
Cited by
-
Advancing diabetes management: Exploring pancreatic beta-cell restoration's potential and challenges.World J Gastroenterol. 2024 Oct 28;30(40):4339-4353. doi: 10.3748/wjg.v30.i40.4339. World J Gastroenterol. 2024. PMID: 39494103 Free PMC article. Review.
-
Forward programming of hiPSCs towards beta-like cells using Ngn3, Pdx1, and MafA.Sci Rep. 2024 Jun 13;14(1):13608. doi: 10.1038/s41598-024-64346-4. Sci Rep. 2024. PMID: 38871849 Free PMC article.
-
Direct Reprogramming of Somatic Cells into Induced β-Cells: An Overview.Adv Exp Med Biol. 2023;1410:171-189. doi: 10.1007/5584_2022_756. Adv Exp Med Biol. 2023. PMID: 36515866
-
Synthetic mRNA is a more reliable tool for the delivery of DNA-targeting proteins into the cell nucleus than fusion with a protein transduction domain.PLoS One. 2017 Aug 14;12(8):e0182497. doi: 10.1371/journal.pone.0182497. eCollection 2017. PLoS One. 2017. PMID: 28806415 Free PMC article.
-
Biomedical applications of mRNA nanomedicine.Nano Res. 2018 Oct;11(10):5281-5309. doi: 10.1007/s12274-018-2146-1. Epub 2018 Jul 27. Nano Res. 2018. PMID: 31007865 Free PMC article.
References
-
- Shapiro, AM, Ricordi, C, Hering, BJ, Auchincloss, H, Lindblad, R, Robertson, RP et al. (2006). International trial of the Edmonton protocol for islet transplantation. N Engl J Med 355: 1318–1330. - PubMed
-
- Kroon, E, Martinson, LA, Kadoya, K, Bang, AG, Kelly, OG, Eliazer, S et al. (2008). Pancreatic endoderm derived from human embryonic stem cells generates glucose-responsive insulin-secreting cells in vivo. Nat Biotechnol 26: 443–452. - PubMed
-
- Ben-David, U, Arad, G, Weissbein, U, Mandefro, B, Maimon, A, Golan-Lev, T et al. (2014). Aneuploidy induces profound changes in gene expression, proliferation and tumorigenicity of human pluripotent stem cells. Nat Commun 5: 4825. - PubMed
LinkOut - more resources
Full Text Sources
Other Literature Sources
