. 2016 Jul 13;8(7):692-708.
doi: 10.1039/c6mt00070c.

Ferric ions accumulate in the walls of metabolically inactivating Saccharomyces cerevisiae cells and are reductively mobilized during reactivation

Affiliations

Ferric ions accumulate in the walls of metabolically inactivating Saccharomyces cerevisiae cells and are reductively mobilized during reactivation

Joshua D Wofford et al. Metallomics. .

Abstract

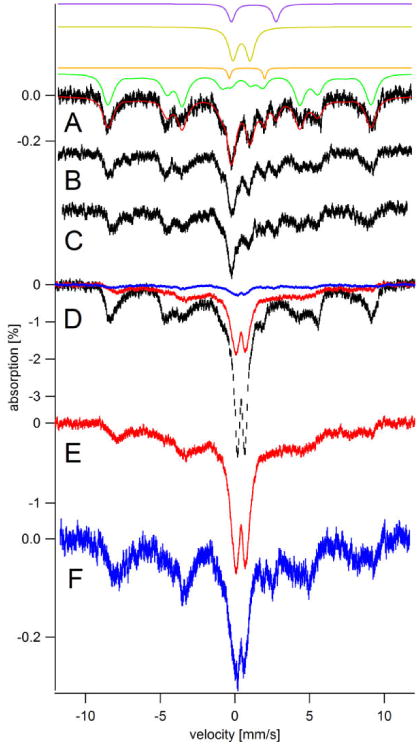
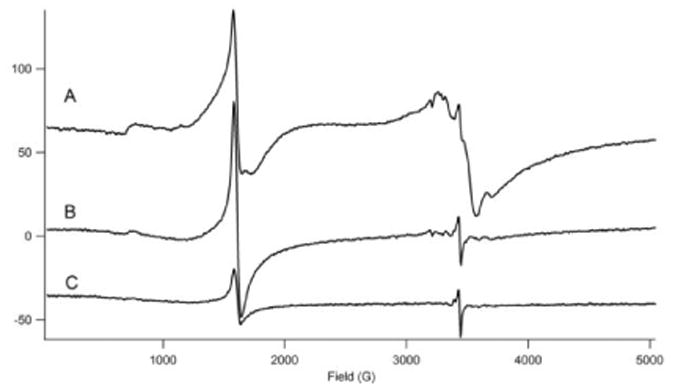
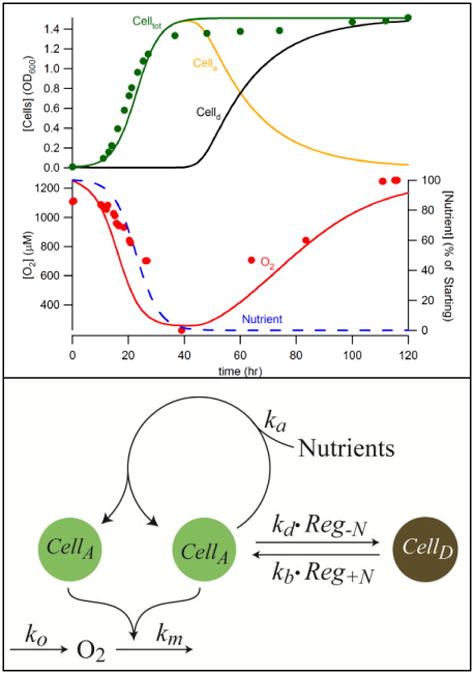
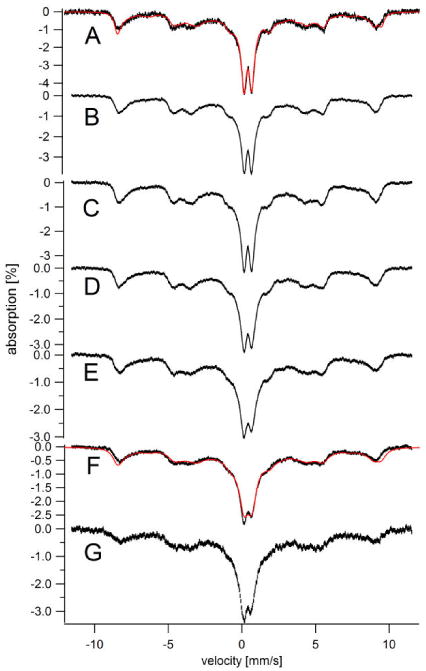
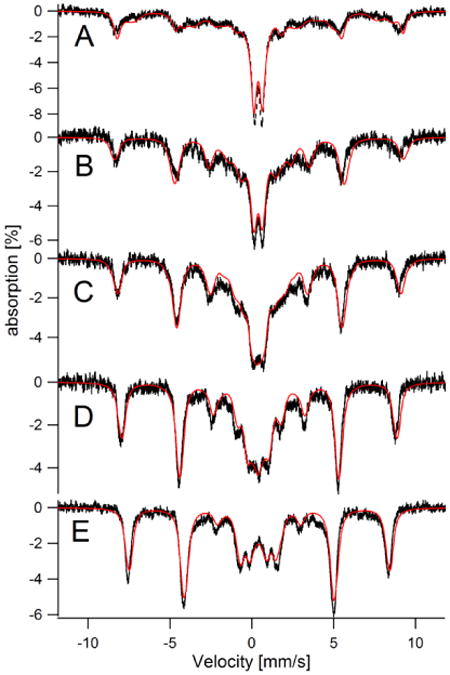
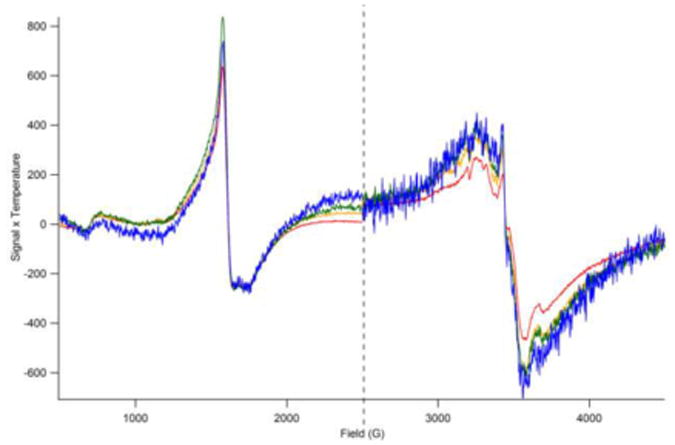
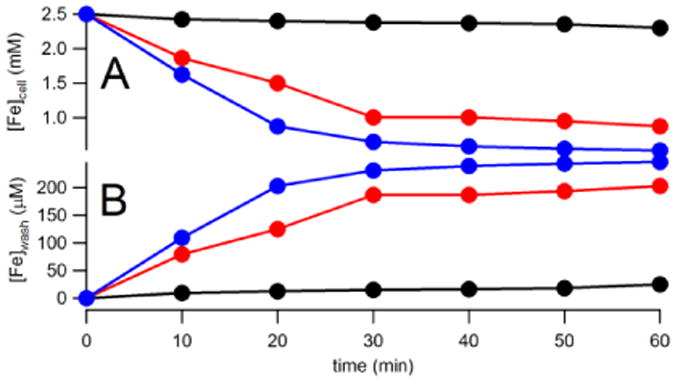
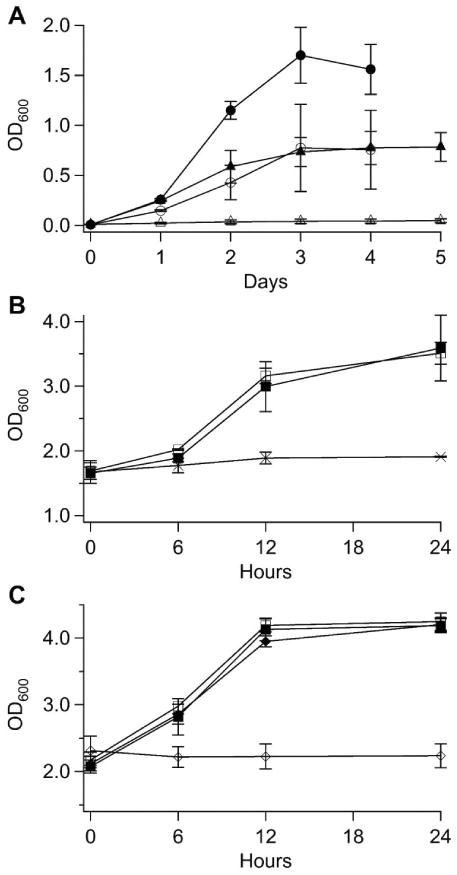
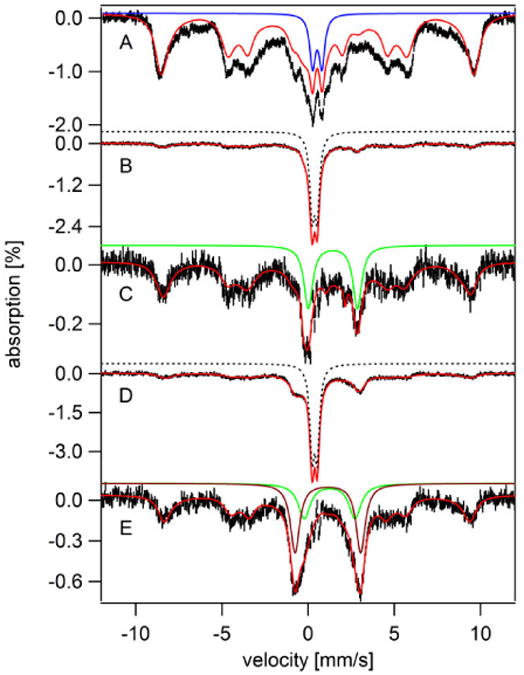
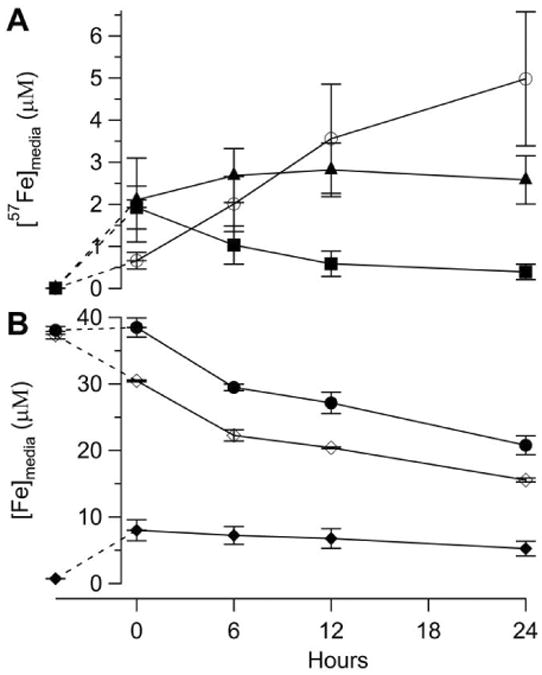
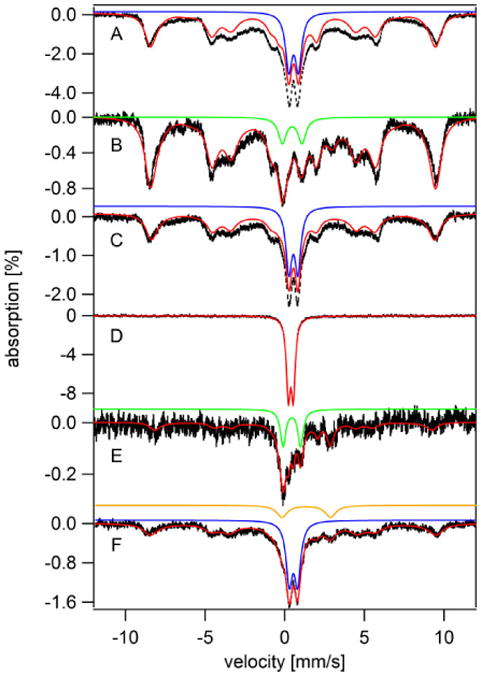
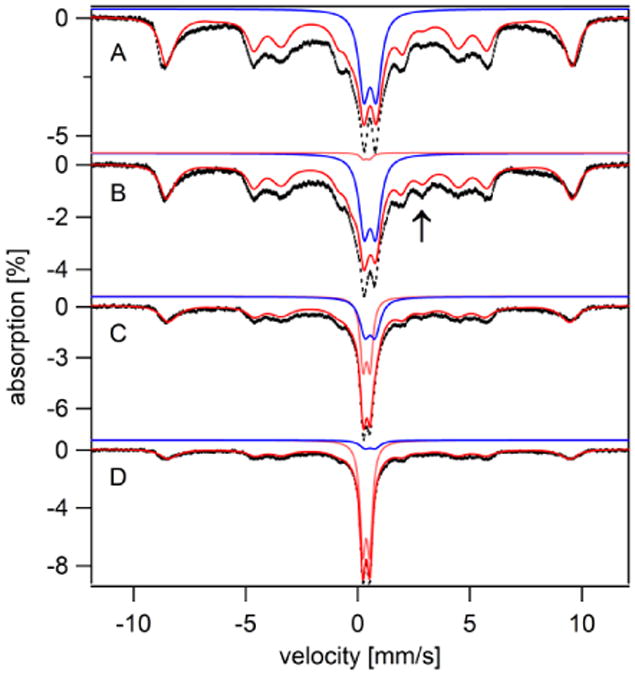
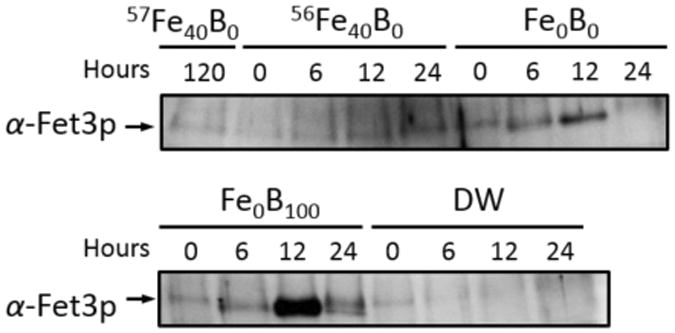
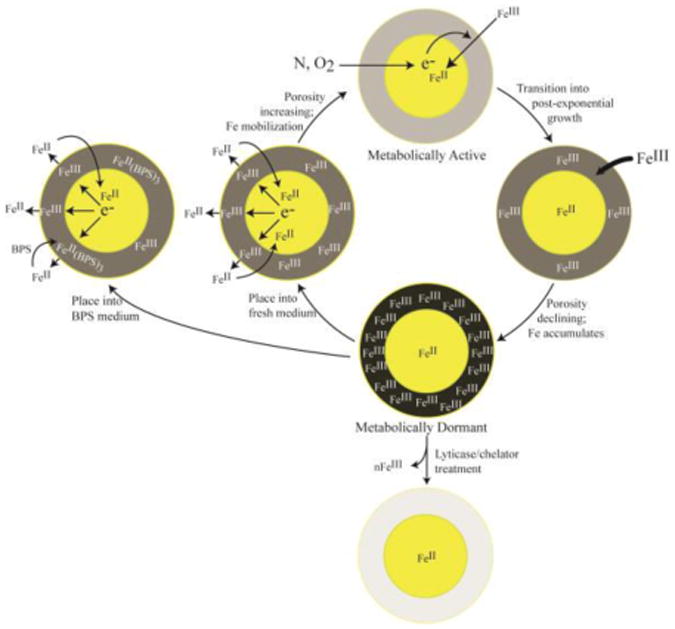
Mössbauer and EPR spectra of fermenting yeast cells before and after cell wall (CW) digestion revealed that CWs accumulated iron as cells transitioned from exponential to post-exponential growth. Most CW iron was mononuclear nonheme high-spin (NHHS) Fe(III), some was diamagnetic and some was superparamagnetic. A significant portion of CW Fe was removable by EDTA. Simulations using an ordinary-differential-equations-based model suggested that cells accumulate Fe as they become metabolically inactive. When dormant Fe-loaded cells were metabolically reactivated in Fe-deficient bathophenanthroline disulfonate (BPS)-treated medium, they grew using Fe that had been mobilized from their CWs AND using trace amounts of Fe in the Fe-deficient medium. When grown in Fe-deficient medium, Fe-starved cells contained the lowest cellular Fe concentrations reported for a eukaryotic cell. During metabolic reactivation of Fe-loaded dormant cells, Fe(III) ions in the CWs of these cells were mobilized by reduction to Fe(II), followed by release from the CW and reimport into the cell. BPS short-circuited this process by chelating mobilized and released Fe(II) ions before reimport; the resulting Fe(II)(BPS)3 complex adsorbed on the cell surface. NHHS Fe(II) ions appeared transiently during mobilization, suggesting that these ions were intermediates in this process. In the presence of chelators and at high pH, metabolically inactive cells leached CW Fe; this phenomenon probably differs from metabolic mobilization. The iron regulon, as reported by Fet3p levels, was not expressed during post-exponential conditions; Fet3p was maximally expressed in exponentially growing cells. Decreased expression of the iron regulon and metabolic decline combine to promote CW Fe accumulation.


Figures

Figure 1
Figure 1. Low field (0.05 T) low temperature (5 K) Mössbauer spectra of whole intact fermenting WT cells grown on 57Fe40B0 medium and harvested at different growth stages
A, harvested at OD600 = 0.4 (exponential stage) and washed with water; B, harvested at OD600 = 0.7 (exponential stage) and washed with water; C, same as B except treated with lyticase/EDTA; D, black hash-marks, harvested at OD600 = 1.5 (post-exponential stage; 5 days) and water washed; E, same as D except washed with EDTA; F, same as D and E except treated with lyticase/EDTA. Red and blue hashmarks in D are the same spectra as shown in E and F, respectively, scaled to the spectrum in black. Solid red line in A is a simulation consisting of NHHS S = 5/2 FeIII from vacuoles (green line; 74%; δ = 0.41 mm/s; ΔEQ = 0.3 mm/s; Aiso/gnβn = -228 kG; D = 0.5 cm-1; E/D = 0.33; η = 3; Γ = 0.7 mm/s), HS Heme FeII (orange line: δ = 0.8 mm/s; ΔEQ = 2.4 mm/s; Γ = 0.3 mm/s), central doublet (gold line: δ = 0.45 mm/s; ΔEQ = 1.15 mm/s; Γ = 0.7 mm/s), and NHHS FeII (purple line: δ = 1.26 mm/s; ΔEQ = 3.0 mm/s; Γ = 0.6 mm/s). The Y-axis scale for A, B, and C are the same.
Figure 2
Figure 2. 10 K X-Band EPR spectra of whole intact fermenting yeast cells
A, treated with water; B, treated with EDTA; C, treated with EDTA/lyticase. Other EPR conditions: microwave power, 0.2 mW; microwave frequency, 9.645 GHz; modulation amplitude, 9.2 G; sweep time, 160 sec. Samples were the same as those used to generate Figure 1 D, E, and F, respectively, obtained by transferring samples from MB holder to EPR tubes while maintained near 77 K.
Figure 3
Figure 3. Model of cell growth and O2 consumption in a batch culture of WT fermenting S. cerevisiae
Upper panel: plots of OD600 and [O2] in 57Fe40B0 medium vs. time after inoculation. Data are solid green (OD600) and red (O2) circles. Simulations are green (total cells), yellow (active cells), black (dormant cells), blue (nutrient concentration) and red (O2 concentration) lines. Lower panel: chemical model showing generation of O2, consumption of O2 by active cells, self-replication of active cells, and interconversion of active and dormant cells as regulated by the nutrient concentration.
Figure 4
Figure 4. Temperature-dependent Mössbauer spectra of 57Fe-loaded cells (water washed)
A, 5; B, 15; C, 25; D, 50; E, 75; F, 100; G, 150 (all in K). A field of 0.05 T was applied parallel to the gamma radiation. The sample used was the same as in Figure 1D. Overall simulations (red lines in A and F) were the sum of two simulated spectra, including an S = 5/2 species (Aiso/gnβn = -216 kG, D = 0.04 cm-1, E/D = 0.22, δ = 0.45 mm/s, ΔEQ = 0.5 mm/s, η = 10 and Γ = 0.4 – 0.7 mm/s) representing 70% of spectral intensity, and an S = 0 species (δ = 0.38 mm/s, ΔEQ = 0.5 mm/s, η = 1 and Γ = 0.4 – 0.7 mm/s) representing 30% of spectral intensity. With increasing temperature, spectral features broadened.
Figure 5
Figure 5. Variable-Field 4.2 K Mössbauer spectra of 57Fe-loaded (water washed) cells
A, 0; B, 0.75; C, 1.5; D, 3.0, and E, 6.0 (all in T). Fields were applied perpendicular to the gamma radiation. Overall simulations (red lines) were generated using the same model as in the Figure 4 legend. The sample was the same as used in Figures 1D and 4. The simulation in A assumed an applied field of 0.02 T and that the sextet represented 65% of spectral intensity and the doublet 35%.
Figure 6
Figure 6. Temperature-dependent EPR spectra of 57Fe-loaded cells (water washed)
Low-field spectra show the g = 4.3 signal while high-field spectra exhibit a broad g = 2 signal. Spectra were collected at 10 K (red line), 20 K (yellow), 40 K (green), and 80 K (blue). Signal intensities have been multiplied by temperature. The sample used was the same as in Figure 1D, 4 and 5. Microwave power was 2 mW and 0.2 mW for the low- and high-field spectra, respectively. Other conditions were as in Figure 2.
Figure 7
Figure 7. Iron concentrations in WT post-exponential cells and the corresponding washes after various treatments
A, [Fe]cell; B, [Fe]wash. Data are solid circles. Black, washed with water only; Red, washed with EDTA only; Blue, washed with lyticase and EDTA.
Figure 8
Figure 8. Panel A, Growth of Fe-loaded or Fe-starved Cells after transfer to various media
Solid circles, Fe-loaded cells transferred to Fe0B30 medium. Open circles, Fe-starved cells transferred to Fe0B30 medium. Solid triangles, Fe-loaded cells transferred to Fe0B100. Open triangles, Fe-starved cells transferred to Fe0B100 medium. Panel B, Growth of Fe-loaded cells transferred to various media inoculated at conserved cell density. Solid squares, transferred to 57Fe40B0 medium. Open squares, transferred to Fe0B100 medium. Crosses, transferred to Fe0B100-NAB medium. Panel C, same as Panel B, but a different experiment. Solid squares, transferred to 56Fe40B0 medium. Open squares, transferred to Fe0B100 medium. Solid diamonds, transferred to Fe0B0 medium. Open diamonds, transferred to DW.
Figure 9
Figure 9. Mössbauer spectra (5 K, 0.05 T) of whole WT yeast cells before (A) and after (B – E) switching growth media
Results from this experiment are also presented in Figure 8B. A, Fe-loaded cells. The blue line is a simulation of FeIII nanoparticles (δ = 0.53 mm/s; ΔEQ = 0.52 mm/s; Γ = 0.45 mm/s). The red line is a composite simulation including 20% absorption due to nanoparticles and 65% to NHHS FeIII (Aiso/gnβn = -235 kG; E/D = 0.33; D = 1.15 cm-1; δ = 0.55 mm/s; ΔEQ = 0 mm/s; Γ = 0.8 mm/s). B, Fe-loaded cells 5 days after being transferred to Fe0B100. Red line is a composite simulation including NHHS FeIII and the quadrupole doublet due to 57FeII(BPS)3. Simulation parameters are given in Table S3. C, same as B but after removing the quadrupole doublet due to 57FeII(BPS)3. The green line is a simulation of the NHHS FeII doublet and the red line is a composite simulation defined in Table S3. D, Fe-loaded cells 1 day after being transferred to Fe0B100-NAB medium. Red line is a composite simulation. E, same as D but after removing the quadrupole double due to FeII(BPS)3. Green and maroon lines are simulations of the two NHHS FeII species described in the text. The red line is a composite simulation.
Figure 10
Figure 10. Iron concentrations in growth medium before and after inoculation with 57Fe-loaded cells
Other results of this experiment are presented in Figure 1C. Panel A, 57Fe concentration in media: Solid squares, medium before and after 57Fe-loaded cells were transferred to Fe0B100 medium. The datum at t < 0 was of medium prior to inoculation. Other data are of the medium 0, 6, 12 and 24 hr after the transfer and after cells were removed by centrifugation. Solid triangles, same but for Fe0B0 medium. Blank circles, same but for DW. Panel B, Fe concentration in 56Fe40B0 medium: Solid circles, total [Fe]; Open diamonds, [56Fe]; Solid diamonds [57Fe].
Figure 11
Figure 11. Whole-cell Mössbauer spectra (5 K, 0.05 T) obtained from the experiment of Figure 8C
A, 57Fe-loaded cells; B – F, 57Fe-loaded cells after 1 day incubation in the following media: B, Fe0B0; C, DW; D, Fe0B100; E, same as D, but cells were rinsed with 100 mM Tris-HCl buffer (pH 9.4) three times prior to obtaining the spectrum; F, 56Fe40B0. Red and blue lines in A and C are the same as in Figure 9A. The green line in B simulates the CD while the red line is a composite simulation as defined in Table S3. The red line in D simulates the FeII(BPS)3 doublet, the green line in E simulates the CD, and the orange line in F simulates the NHHS FeII doublet.
Figure 12
Figure 12. Mössbauer spectra (5 K, 0.05 T) of 57Fe-loaded cells before (A) and at increasing times after (B – E) transfer to Fe0B100 medium
Time after transfer: B, 30 min; C, 3 hr; D, 6 hr. Blue and pink lines are simulations of the FeIII nanoparticle and FeII(BPS)3 quadrupole doublets, respectively. The red lines are composite simulations as defined in Table S3. The arrow in B indicates the position of the high energy line of the NHHS FeII doublet.
Figure 13
Figure 13. Western Blot showing Fet3p expression levels in WT cells in various media
Top panel, Fe-loaded cells transferred to Fe40B0, 56Fe40B0, and Fe0B0 media and harvested at the indicated times (in hr) after the transfer. Bottom panel, same as top panel but with cells transferred to Fe0B100 and DW media.
Figure 14
Figure 14. Model for iron accumulation into the cell wall
Metabolically active (exponentially-growing) cells do not accumulate Fe in their CWs; FeIII from the environment is reduced by metabolic processes in the cell and it enters the cell as FeII. As cells transition into a post-exponential (or dormant) state, FeIII begins to accumulate in the CW. CW Fe can be removed by chelation or CW digestion. When dormant cells become metabolically active (by placing them into fresh media), the CW FeIII becomes reductively mobilized to the FeII state. The FeII is released from the CW where it can: a) dissociate from the cell and diffuse into the environment; b) enter the cytosol to support cell growth; or c) chelate with BPS (if BPS is in the medium). A significant portion of the neutral FeII(BPS)3 species adsorbs onto the CW.

References

    1. Lesage G, Bussey H. Cell wall assembly in Saccharomyces cerevisiae. Microbiol and Mol Biol Rev. 2006;70:317–343. - PMC - PubMed
    1. De Nobel JG, Klis FM, Priem J, Munnik T, VanDenEnde H. The gluconase-soluble mannoproteins limit cell wall porosity in Saccharomyces cerevisiae. Yeast. 1990;6:491–499. - PubMed
    1. DeGroot PWJ, Ram AF, Klis FM. Features and functions of covalently linked proteins in fungal cell walls. Fungal Genet Biol. 2005;42:657–675. - PubMed
    1. Klis FM, de Jong M, Brul S, de Groot PWJ. Extraction of cell surface-associated proteins from living yeast cells. Yeast. 2007;24:253–258. - PubMed
    1. DeGroot PWJ, Ruiz C, Vazquez de Aldana CR, Euienas E, Cid VJ, Del Rey F, et al. A genomic approach for the identification and classification of genes involved in cell wall formation and its regulation in Saccharomyces cerevisiae. Comp Funct Genomics. 2001;2:124–142. - PMC - PubMed

MeSH terms

Substances

LinkOut - more resources