

Genetic manipulation of putrescine biosynthesis reprograms the cellular transcriptome and the metabolome
- PMID: 27188293
- PMCID: PMC4870780
- DOI: 10.1186/s12870-016-0796-2
Genetic manipulation of putrescine biosynthesis reprograms the cellular transcriptome and the metabolome
Abstract
Background: With the increasing interest in metabolic engineering of plants using genetic manipulation and gene editing technologies to enhance growth, nutritional value and environmental adaptation, a major concern is the potential of undesirable broad and distant effects of manipulating the target gene or metabolic step in the resulting plant. A comprehensive transcriptomic and metabolomic analysis of the product may shed some useful light in this regard. The present study used these two techniques with plant cell cultures to analyze the effects of genetic manipulation of a single step in the biosynthesis of polyamines because of their well-known roles in plant growth, development and stress responses.
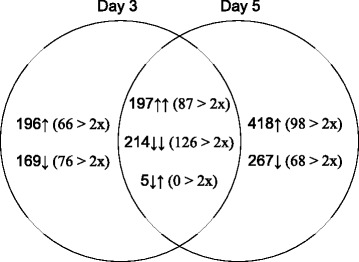
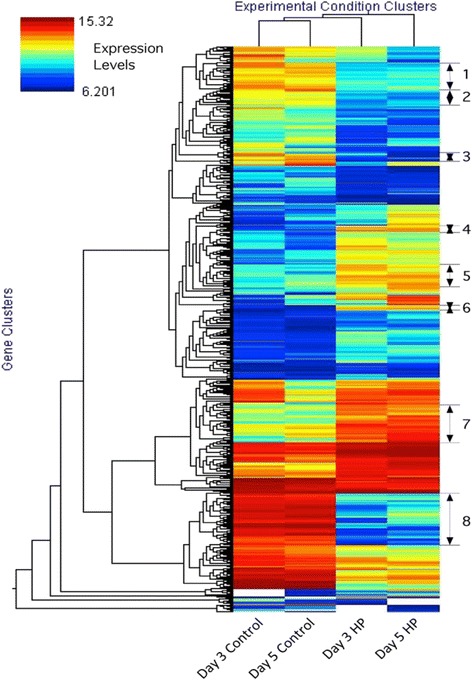
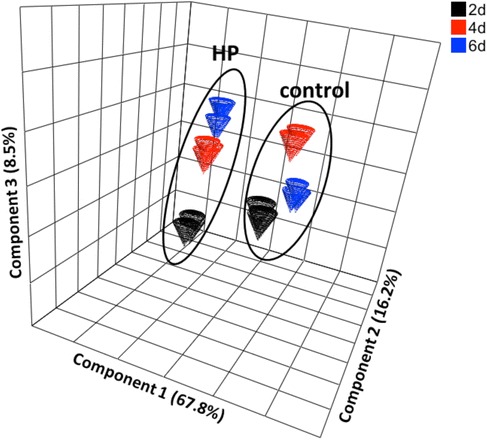
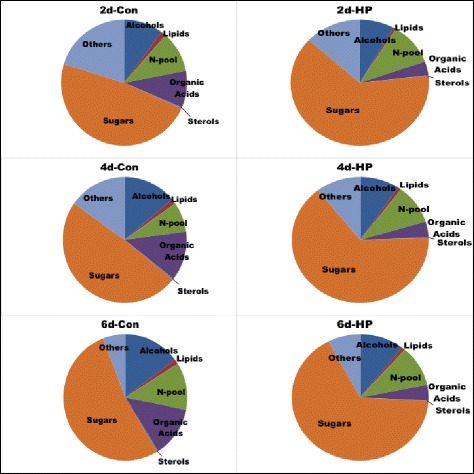
Results: The transcriptomes and metabolomes of a control and a high putrescine (HP) producing cell line of poplar (Populus nigra x maximowiczii) were compared using microarrays and GC/MS. The HP cells expressed an ornithine decarboxylase transgene and accumulated several-fold higher concentrations of putrescine, with only small changes in spermidine and spermine. The results show that up-regulation of a single step in the polyamine biosynthetic pathway (i.e. ornithine → putrescine) altered the expression of a broad spectrum of genes; many of which were involved in transcription, translation, membrane transport, osmoregulation, shock/stress/wounding, and cell wall metabolism. More than half of the 200 detected metabolites were significantly altered (p ≤ 0.05) in the HP cells irrespective of sampling date. The most noteworthy differences were in organic acids, carbohydrates and nitrogen-containing metabolites.
Conclusions: The results provide valuable information about the role of polyamines in regulating nitrogen and carbon use pathways in cell cultures of high putrescine producing transgenic cells of poplar vs. their low putrescine counterparts. The results underscore the complexity of cellular responses to genetic perturbation of a single metabolic step related to nitrogen metabolism in plants. Combined with recent studies from our lab, where we showed that higher putrescine production caused an increased flux of glutamate into ornithine concurrent with enhancement in glutamate production via additional nitrogen and carbon assimilation, the results from this study provide guidance in designing transgenic plants with increased nitrogen use efficiency, especially in plants intended for non-food/feed applications (e.g. increased biomass production for biofuels).
Keywords: Genetic manipulation; Metabolome; Microarrays; Ornithine decarboxylase; Polyamines; Populus; Transcriptome.
Figures
References
-
- Böttcher C, von Roepenack-Lahaye E, Schmidt J, Schmotz C, Neumann S, Scheel D, Clemens S. Metabolome analysis of biosynthetic mutants reveals a diversity of metabolic changes and allows identification of a large number of new compounds in Arabidopsis. Plant Physiol. 2008;147:2107–2120. doi: 10.1104/pp.108.117754. - DOI - PMC - PubMed
Publication types
MeSH terms
Substances
LinkOut - more resources
Full Text Sources
Other Literature Sources
Molecular Biology Databases
Research Materials
Miscellaneous
