. 2016 May 18:6:26087.
doi: 10.1038/srep26087.

Topological distortion and reorganized modular structure of gut microbial co-occurrence networks in inflammatory bowel disease

Affiliations

Topological distortion and reorganized modular structure of gut microbial co-occurrence networks in inflammatory bowel disease

Steven N Baldassano et al. Sci Rep. .

Abstract

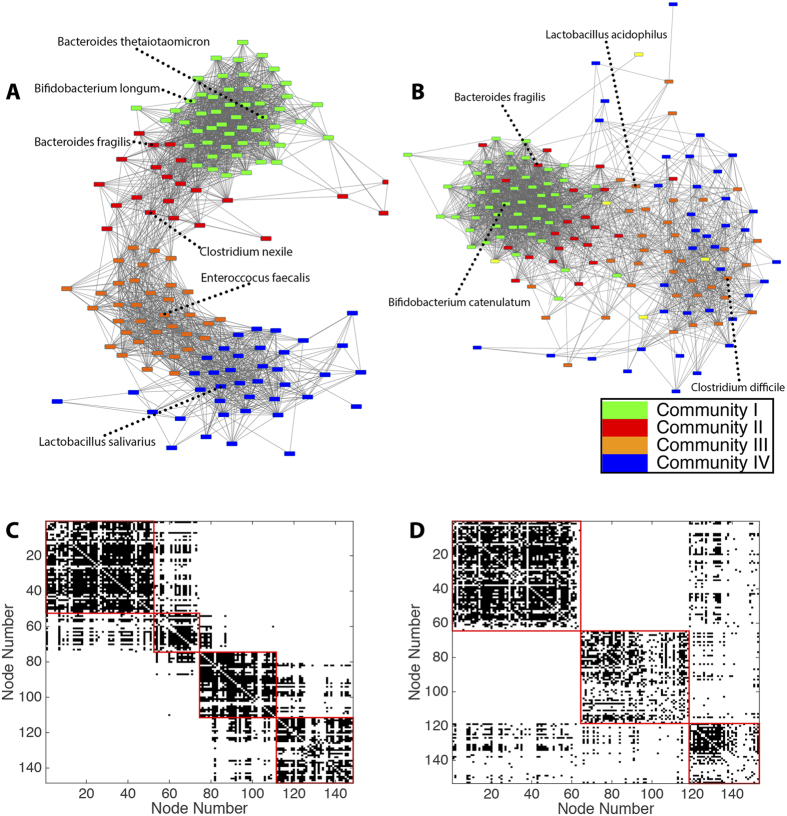
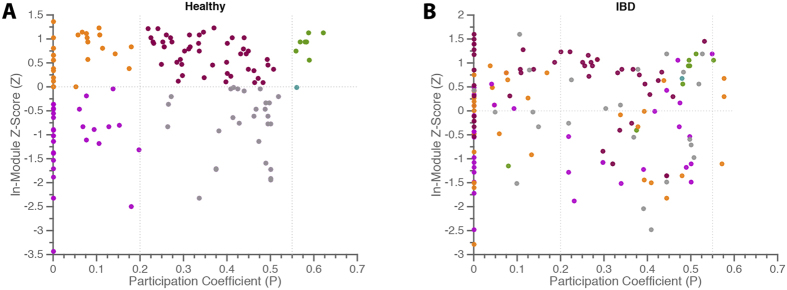
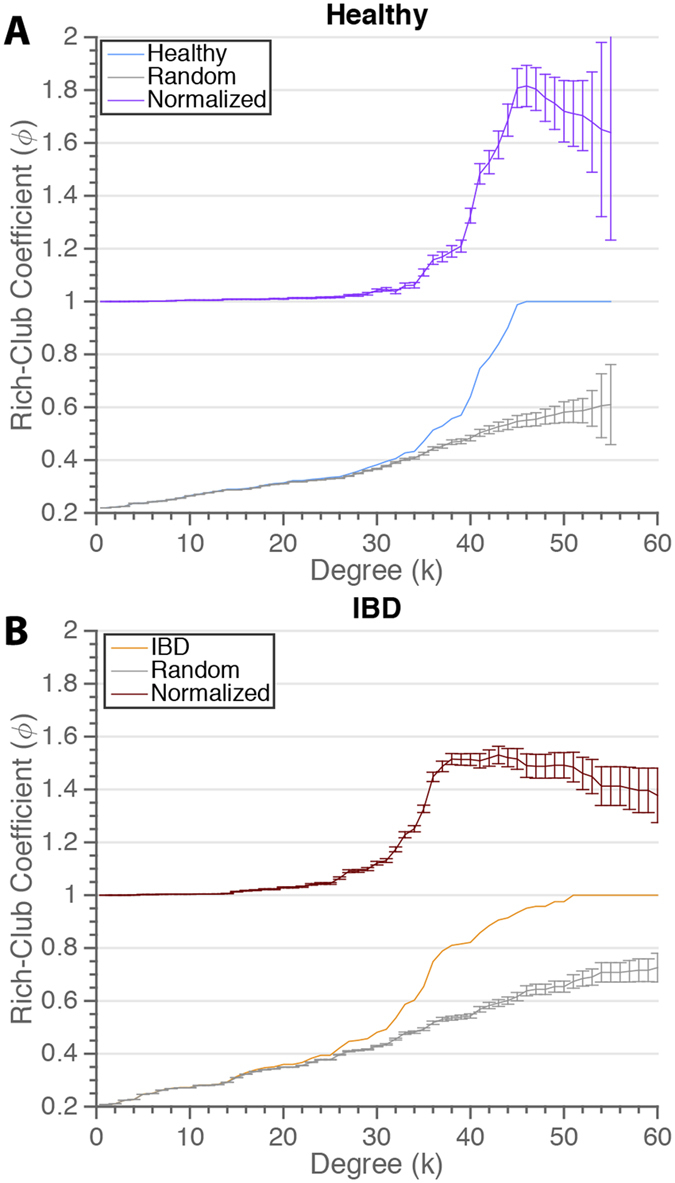
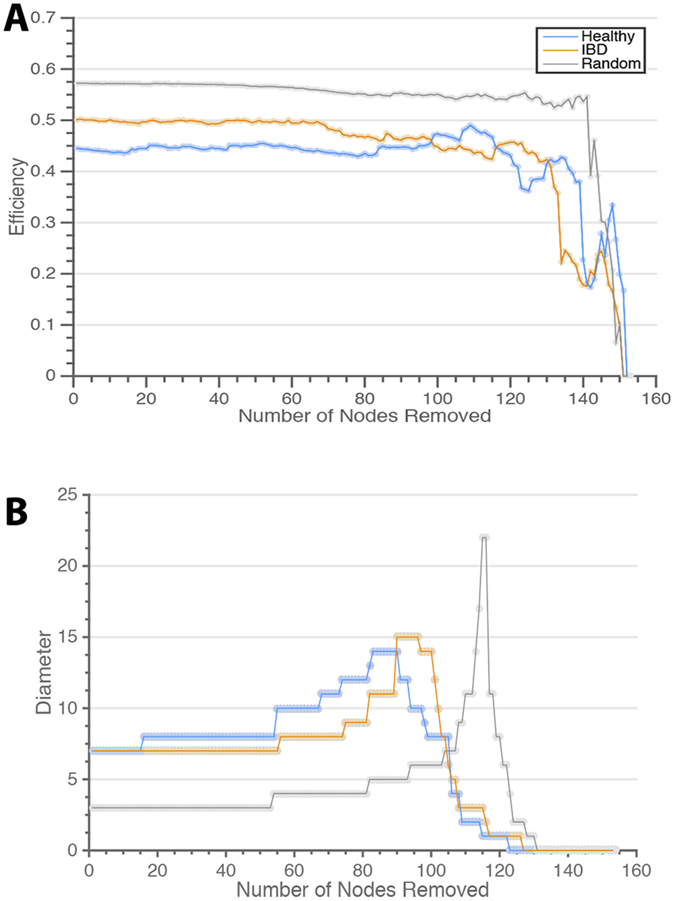
The gut microbiome plays a key role in human health, and alterations of the normal gut flora are associated with a variety of distinct disease states. Yet, the natural dependencies between microbes in healthy and diseased individuals remain far from understood. Here we use a network-based approach to characterize microbial co-occurrence in individuals with inflammatory bowel disease (IBD) and healthy (non-IBD control) individuals. We find that microbial networks in patients with IBD differ in both global structure and local connectivity patterns. While a "core" microbiome is preserved, network topology of other densely interconnected microbe modules is distorted, with potent inflammation-mediating organisms assuming roles as integrative and highly connected inter-modular hubs. We show that while both networks display a rich-club organization, in which a small set of microbes commonly co-occur, the healthy network is more easily disrupted by elimination of a small number of key species. Further investigation of network alterations in disease might offer mechanistic insights into the specific pathogens responsible for microbiome-mediated inflammation in IBD.


Figures

Figure 1
Figure 1. Microbial co-occurrence networks.
(A) Fecal samples harvested from healthy subjects and subjects with IBD. Organisms identified by total DNA deep sequencing and alignment with reference genomes. (B) Co-occurrence matrices generated from abundance data using Jaccard similarity. The raw co-occurrence matrix containing weighted data from healthy population is shown. (C) Healthy co-occurrence matrix after thresholding to isolate the strongest 20% of connections. For additional details regarding data and computational methods, see Methods. Panel (A) reprinted by permission from Macmillan Publishers Ltd: Nature, Qin, et al., copyright 2010.
Figure 2
Figure 2. Motifs in microbial co-occurrence networks.
Illustration of bidirectional motifs of 3 (A) and 4 (B) nodes. IBD networks have a significantly higher frequency of 4-node motif number 3.
Figure 3
Figure 3. Identification of Microbial Communities in Health and Disease.
(A) Healthy network color-coded by consensus partition. Community I = Green; Community II = Red; Community III = Orange; Community IV = Blue. Representative, high-degree species from each module are labeled. (B) IBD network color-coded by consensus partition of healthy network. (C) Heat map of control network and (D) Heat map of IBD network with nodes arranged according to consensus partition.
Figure 4
Figure 4. Network Roles of Microbial Species within Co-Occurrence Communities.
Stratification of node roles in healthy (A) and IBD (B) networks using the intra-module degree Z-score, Z, and the participation coefficient, P. Nodes are color coded by their role in the healthy network.
Figure 5
Figure 5. Role of Hubs in the Microbial Co-Occurrence Networks.
Rich-club coefficients in healthy (A) and IBD (B) networks as a function of minimum node degree. The normalized coefficient curve is the ratio of coefficient curves of the real networks and comparable random networks. A normalized coefficient greater than one indicates more rich-club organization that expected by chance.
Figure 6
Figure 6. Network Robustness and Resilience.
(A) Global network efficiencies measured as nodes are randomly removed from the networks. Network efficiencies are robust to random attack. (B) Network diameter measured as the highest-degree nodes are removed. Network diameter is affected by targeted attack, especially in the healthy network.

References

    1. Huttenhower C. Structure, function and diversity of the healthy human microbiome. Nature 486, 207–214 (2012). - PMC - PubMed
    1. Cho I. & Blaser M. The human microbiome: at the interface of health and disease. Nat Rev Genet 13, 260–270 (2012). - PMC - PubMed
    1. Arumugam M. et al. Enterotypes of the human gut microbiome. Nature 473, 174–180 (2011). - PMC - PubMed
    1. Kau A. L. & Ahern G. P. P., N.W., Goodman, A. & Gordon, J. Human nutrition, the gut microbiome and the immune system. Nature 474, 327–336 (2011). - PMC - PubMed
    1. Zhao L. The gut microbiota and obesity: from correlation to causality. Nature Rev Microbiol 11, 639–647 (2013). - PubMed

Publication types

MeSH terms

LinkOut - more resources