. 2016 May 18:7:11626.
doi: 10.1038/ncomms11626.

Blood coagulation factor XII drives adaptive immunity during neuroinflammation via CD87-mediated modulation of dendritic cells

Affiliations

Blood coagulation factor XII drives adaptive immunity during neuroinflammation via CD87-mediated modulation of dendritic cells

Kerstin Göbel et al. Nat Commun. .

Abstract

Aberrant immune responses represent the underlying cause of central nervous system (CNS) autoimmunity, including multiple sclerosis (MS). Recent evidence implicated the crosstalk between coagulation and immunity in CNS autoimmunity. Here we identify coagulation factor XII (FXII), the initiator of the intrinsic coagulation cascade and the kallikrein-kinin system, as a specific immune cell modulator. High levels of FXII activity are present in the plasma of MS patients during relapse. Deficiency or pharmacologic blockade of FXII renders mice less susceptible to experimental autoimmune encephalomyelitis (a model of MS) and is accompanied by reduced numbers of interleukin-17A-producing T cells. Immune activation by FXII is mediated by dendritic cells in a CD87-dependent manner and involves alterations in intracellular cyclic AMP formation. Our study demonstrates that a member of the plasmatic coagulation cascade is a key mediator of autoimmunity. FXII inhibition may provide a strategy to combat MS and other immune-related disorders.


Conflict of interest statement

M.W.N. is an employee of CSL Behring GmbH and owns employee shares in CSL Limited. C.P. is an employee of CSL Limited and owns employee shares in CSL Limited. K.G., M.W.N., C.K. and S.G.M. hold a patent to treat neuroinflammatory disorders with FXIIa inhibitors. The remaining authors declare no competing financial interests.

Figures
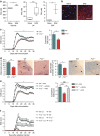
Figure 1
Figure 1. FXII-deficient animals are less susceptible to neuroinflammation.
(a) FXII levels in plasma, LN and CSF of naive and active EAE-induced WT animals at dmax (day 16) were analysed by ELISA. Data are given as mean±s.e.m. from three independent experiments, each with five animals per group (Student's t-test). (b) Histological analysis of spinal cord sections from the lumbar region of MOG35–55-immunized WT animals at dmax is shown. Sections were stained for FXII (red) and nucleus (4,6-diamidino-2-phenylindole (DAPI), blue). Scale bar, 50 μm. (c) Active EAE was induced in WT and F12−/− mice. Data are mean clinical scores±s.e.m. and mean cumulative scores±s.e.m. of WT and F12−/− animals from three independent experiments (non-parametric Mann–Whitney U-test). For detailed animal numbers and additional information, see Supplementary Table 1. (d) Identification of inflammatory foci (left panels) and demyelination (right panels) in spinal cord sections from the lumbar region of WT and F12−/− animals by haematoxylin and eosin (HE) or Luxol fast blue (LFB) staining. Scale bars, 100 μm. Quantification and representative histological sections from dmax of EAE are shown. Data are presented as mean±s.e.m. (n=3 slices of six mice per group, Student's t-test). Arrows indicate inflammation or demyelinated areas, respectively. (e) Mean clinical scores and mean cumulative scores±s.e.m. over time of WT or F12−/− mice treated daily with intravenous injections of FXII (200 mg kg−1 body weight) or corresponding vehicle since MOG35–55 immunization are shown. (f) EAE development in WT and F12−/− mice after adoptive transfer of encephalitogenic LN cells is shown. LN cells were isolated from WT or F12−/− mice on day 12 post immunization and restimulated in vitro with 10 μg ml−1 MOG35–55 and 0.5 ng ml−1 interleukin-12. After 72 h, 8.4 × 10⁶ LN cells were either transferred into WT or F12−/− recipient mice. Mean clinical scores±s.e.m. over time of three independent experiments are given (non-parametric Mann–Whitney U-test). *P<0.05, **P<0.01, ***P<0.001; NS, not significant.
Figure 2
Figure 2. Factor XII deficiency alters T-cell differentiation.
(a) Tbx21, Gata3, Rorc and Foxp3 expression from LN cells at day 10 (d10) or dmax as well as from brain-infiltrating leukocytes (BILs) at dmax after MOG35–55 immunization is determined by real-time reverse transcription–PCR using 18S rRNA for normalization. Data (mean±s.e.m. of five experiments) are given as fold change in normalized gene expression in animals relative to WT controls. (b) At d10 after MOG35–55 immunization, proliferation and cytokine production by CD4+ T cells purified from LN and restimulated with 10 μg ml−1 MOG35–55 and irradiated (35 Gy) antigen-presenting cells in vitro for 48 h (upper panels), and by CD11c+ DCs purified from spleens and incubated with 1 μg ml−1 LPS in vitro for 48 h (lower panels) are shown. (c) Mononuclear cells were isolated from the LN of WT and F12−/− animals at d10 post induction of EAE. Cells were polyclonal restimulated in vitro, stained with anti-CD3 and anti-CD4, fixed and permeabilized, stained intracellularly with anti-IL-17A and analysed by flow cytometry for the percentage of IL-17A-producing CD4+ T cells. (d) Cytokine production by purified BILs from MOG35–55-immunized WT or F12−/− mice at dmax after restimulation with 10 μg ml−1 MOG35–55 for 48 h. (e,f) BILs and LNs were isolated from WT and F12−/− animals at dmax post induction of EAE and polyclonal restimulated in vitro. For the detection of the percentage of IL-17A-producing lymphocytes (CD45highCD11bneg cells or CD4+CD3+ T cells), BILs or LNs were stained with anti-CD11b and anti-CD45, or anti-CD3 and anti-CD4, fixed and permeabilized, stained intracellularly with anti-IL-17A and analysed by flow cytometry. In bf, data are given as means±s.e.m. of three independent experiments, each performed in triplicate. For c,e and f, representative dot plots for IL-17A expression are shown. For af, non-parametric Mann–Whitney U-test. *P<0.05, **P<0.01, ***P<0.001; NS, not significant.
Figure 3
Figure 3. FXII favours the emergence of TH17 cells via DC.
(a) Real-time reverse transcription–PCR (rRT–PCR) analyses for Cd87 gene expression in CD4+, CD8+ and B220+ cells isolated from lymphocytes as well as in CD11b+ and CD11c+ cells isolated from spleens of naive WT mice. (b) rRT–PCR analyses for Cd87 gene expression in CD4+CD25 (Crtl) and CD4+CD25+ (Treg) cells isolated from lymph nodes under basal conditions or after a 48-h incubation with antibodies against CD3 and CD28 under neutral conditions (TH0) or in the presence of the appropriate cytokine and neutralizing antibody mixtures for differentiation into TH1 or TH17 cells as well as in splenic cDCs or pDCs. (c) Flow cytometry analysis for CD87 expression in cDCs (stained with CD11c, left panel) and pDCs (stained with CD317, right panel) isolated from the spleen under basal conditions or after a 24-h stimulation with 1 μg ml−1 LPS or 10 μg ml−1 CpG oligodeoxynucleotide 1,826, respectively. For cDCs and pDCs, representative dot plots for CD87 expression are shown. (d) rRT–PCR analyses for Par1, Par2, Par3, Par4 and Cd87 expression in cDCs and pDCs isolated from the spleen. (e) Splenic cDCs and pDCs from WT animals were incubated with medium only (Ctrl) or stimulated with 1 μg ml−1 LPS (for cDCs) or with 10 μg ml−1 CpG oligodeoxynucleotide 1,826 (for pDCs) in the absence or presence of 60 nM FXII, respectively. After 48 h, cytokine concentrations were measured in culture supernatants. In a,b and d, data are given as mean±s.e.m. of three independent experiments and presented as fold change in transcript expression relative to 18S rRNA. In c and e, data are given as mean±s.e.m. of three independent experiments, each performed in triplicate (non-parametric Mann–Whitney U-test). *P<0.05; ND, not detected; NS, not significant.
Figure 4
Figure 4. FXII controls cytokine production via CD87.
(a) Splenic cDCs from naive WT animals were stimulated with 1 μg ml−1 LPS in the absence and presence of 60 nM activated FXII (FXIIa). After 48 h, cytokine concentrations were measured in culture supernatants by ELISA. (b) Cytokine production of splenic cDCs from WT animals stimulated with 1 μg ml−1 LPS in the absence and presence of 60 nM non-cleavable FXII. After 48 h, cytokine concentrations were determined in culture supernatants by ELISA. (c) Cytokine production of splenic cDCs from CD87-deficient (Cd87−/−) mice stimulated with 1 μg ml−1 LPS alone or in the absence and presence of 60 nM FXII for 48 h. (d) Cytokine production of splenic cDCs from CD11b-deficient (Itgam−/−) animals stimulated with 1 μg ml−1 LPS in the absence and presence of 60 nM FXII for 48 h. (e) Cytosolic cAMP formation measured in cDCs from WT or Cd87−/− mice that were incubated with medium only (Ctrl) or stimulated with 1 μg ml−1 LPS for 10 min in the absence (Ctrl) or presence of 60 nM FXII. (f) Cytokine concentrations of IL-6 (left panel) and IL-23 (right panel) in the supernatants of WT cDCs stimulated with 1 μg ml−1 LPS or 60 nM FXII for 48 h in the presence of protein kinase A inhibitors (3 μM H-89 and 100 μM Rp-8-Br-cAMP). (g) Cytokine concentrations of IFN-γ, IL-17A, IL-6, IL-12 and IL-23 were measured in the supernatants from co-cultures of CD4+ T lymphocytes from WT (upper panel) or Cd87−/− (lower panel) that were polyclonal activated together with cDCs from WT and Cd87−/− in the absence or presence of 60 nM FXII. In ag, data are given as means±s.e.m. of three independent experiments, each performed in duplicate (non-parametric Mann–Whitney U-test). *P<0.05, **P<0.01, ***P<0.001; NS, not significant.
Figure 5
Figure 5. FXII influences DCs in the CNS.
(a) EAE development is shown in WT mice after adoptive transfer of CD4+ lymphocytes and CD11c+ cells isolated from WT or Cd87−/− mice on day 12 post immunization and restimulated with 10 μg ml−1 MOG35–55 and 0.5 ng ml−1 IL-12 with or without 60 nM FXII for 72 h. Mean clinical and mean cumulative scores±s.e.m. over time of three independent experiments are given (non-parametric Mann–Whitney U-test). (b) BM chimeras were created by transferring WT and Cd87−/− BM into WT and Cd87−/− recipient mice after radiation. Mean clinical and mean cumulative scores±s.e.m. of EAE from three independent experiments are shown (non-parametric Mann–Whitney U-test). (c,d) Brain-infiltrating leukocytes (BILs) were separated into cDC+ and cDC by sorting via flow cytometry based on indicated surface markers at dmax after EAE induction. Both subsets from WT or F12–/– mice were analysed for Il-6 expression by real-time reverse transcription–PCR using 18s rRNA for normalization. Data are given as mean±s.e.m. of two experiments, each experiment generated from pooled brain and spinal-cord-derived cells of n=6–7 mice per group and presented as fold change in normalized gene expression relative to WT controls. (e) Flow cytometric analysis of BILs from WT and F12−/− animals at dmax after EAE induction determined the expression of CD80, CD86 and MHC-II in cDCs that were pre-gated for CD45highCD11b+CD11c+ cells. Data are representative of two independent experiments with four mice per genotype. (f) Histological analysis of spinal cord sections stained for the nucleus (4,6-diamidino-2-phenylindole (DAPI), blue), FXII (red) and CD11c (green) from the lumbar region of EAE WT animals at dmax. Scale bar, 100 μm. *P<0.05.
Figure 6
Figure 6. FXII blockade protects from neuroinflammation and contact hypersensitivity.
(a) Clinical scores of WT mice treated with rHA-Infestin-4 or vehicle starting on day 1 after EAE induction are shown. Representative data from two independent experiments are depicted (Supplementary Table 3). (b,c) Histological analysis of spinal cord sections of WT and rHA-Infestin-4-treated mice at dmax. Lumbar sections were stained with haematoxylin and eosin (HE) (b) to evaluate inflammatory foci or immunostained for Luxol fast blue (LFB) (c) to assess demyelination. Arrows indicate inflammation or demyelinated areas. Scale bars, 100 μm. (d) Cytokines produced by CD4+ T lymphocytes and DCs from WT mice treated with rHA-Infestin-4 or vehicle 10 days after immunization. Data from three independent experiments, each performed in duplicate are shown. Clinical scores of (e) MOG35–55-immunized WT mice and (f) proteolipid protein peptide 139–151-immunized SJL/JRj mice treated with rHA-Infestin-4 or vehicle starting at the first day of neurologic symptoms (arrow; for detailed information, see Supplementary Table 4). (g) Clinical, cumulative EAE scores and (h) disease incidence of Devic mice treated with rHA-Infestin or vehicle starting at postnatal day 20. (i) The motor coordination of Devic mice was assessed using the rotarod. The time the mice remained on the rod was recorded. For each mouse, the average time of three trials followed by 30-min breaks was recorded daily. (j) Number of infiltrating CD4+ T cells within the central nervous system of Devic mice was analysed by flow cytometry at postnatal day 40. (k) Ear swelling of WT or F12−/− mice following induction of contact hypersensitivity. Representative data from three independent experiments are shown. Quantification of 2,4-dinitrobenzenesulfonic acid sodium salt-induced proliferation, and IFN-γ and IL-17A production of LN cells from WT and F12−/− mice. Representative data in quadruplicate wells from two independent experiments are shown. In aj, 200 mg kg−1 body weight of rHA-Infestin-4 or vehicle was given once daily. In ak, data are given as mean±s.e.m. *P<0.05, **P<0.01, ***P<0.001 (for a,d and ek, non-parametric Mann–Whitney U-test; for b and c, Student's t-test); NS, not significant.
Figure 7
Figure 7. Evidence for the involvement of FXII in human autoimmune CNS inflammation.
(a) FXII plasma levels in individuals with clinically isolated syndrome (CIS) and MS patients (relapsing–remitting MS (RRMS), primary progressive MS (PPMS) and secondary progressive MS (SPMS)) compared with HDs. (b) FXII plasma levels in individuals with RRMS during relapse compared with HDs. (c) Correlation of FXII plasma levels with relapse-free time in individuals with RRMS. R value: −0.4226. (d) Histological analysis of CNS tissue from individuals with MS or from HDs. Sections were stained for FXII (red) and nucleus (4,6-diamidino-2-phenylindole (DAPI), blue). Scale bar, 100 μm. (e) Histological analysis of CNS tissue of individuals with MS. Sections were stained for CD11c (red), FXII (green) and nucleus (DAPI, blue). Scale bar, 100 μm. (fk) Flow cytometric analysis of human PBMCs from HDs that were incubated with medium only (Ctrl) or stimulated with 60 nM FXII for 24 h. Cells were gated for CD1c+CD11c+CD11b+CD19neg (cDC) based on indicated surface markers (shown in f) and their expressions of (g) CD80, (h) CD86, (i) CD40, (j) MHC-II and (k) CD87 were determined. Representative fluorescence-activated cell sorting plots for indicated surface markers are shown. (l) Cytokine concentrations of IL-6 (left panel) and IL-23 (right panel) in the supernatants of human PBMCs treated with 60 nM FXII or untreated (Ctrl) for 24 h. In a,b and gl, data are given as mean±s.e.m. (non-parametric Mann–Whitney U-test or Student's t-test). *P<0.05, **P<0.01, ***P<0.001; MFI, mean fluorescence intensity; NS, not significant.

Similar articles

Cited by

References

    1. Ganguly D., Haak S., Sisirak V. & Reizis B. The role of dendritic cells in autoimmunity. Nat. Rev. Immunol. 13, 566–577 (2013). - PMC - PubMed
    1. Bhat R. & Steinman L. Innate and adaptive autoimmunity directed to the central nervous system. Neuron 64, 123–132 (2009). - PubMed
    1. Steinman L. A brief history of T(H)17, the first major revision in the T(H)1/T(H)2 hypothesis of T cell-mediated tissue damage. Nat. Med. 13, 139–145 (2007). - PubMed
    1. Korn T., Bettelli E., Oukka M. & IL-17 Kuchroo VK. and Th17 Cells. Annu. Rev. Immunol. 27, 485–517 (2009). - PubMed
    1. Steinman L. A rush to judgment on Th17. J. Exp. Med. 205, 1517–1522 (2008). - PMC - PubMed

Publication types

MeSH terms