

doi: 10.1259/bjr.20151025.
Epub 2016 Jun 10.
Imaging follow-up after liver transplantation
Affiliations
- PMID: 27188846
- PMCID: PMC5124875
- DOI: 10.1259/bjr.20151025
Item in Clipboard
Imaging follow-up after liver transplantation
Br J Radiol.
2016 Aug.
Abstract
Liver transplantation (LT) represents the best treatment for end-stage chronic liver disease, acute liver failure and early stages of hepatocellular carcinoma. Radiologists should be aware of surgical techniques to distinguish a normal appearance from pathological findings. Imaging modalities, such as ultrasound, CT and MR, provide for rapid and reliable detection of vascular and biliary complications after LT. The role of imaging in the evaluation of rejection and primary graft dysfunction is less defined. This article illustrates the main surgical anastomoses during LT, the normal appearance and complications of the liver parenchyma and vascular and biliary structures.
Figures
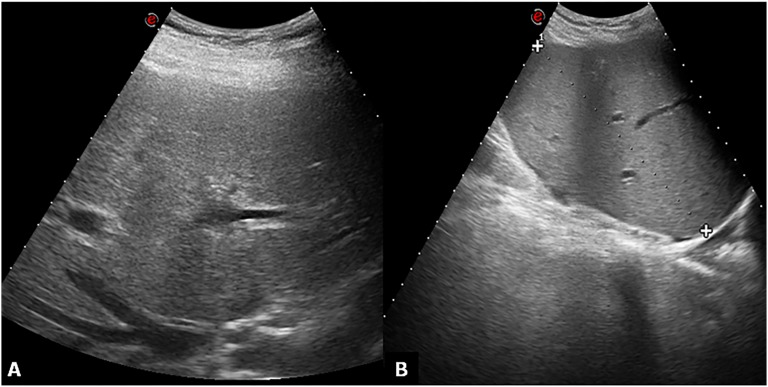
Ultrasound normal appearance greyscale. (a) Subcostal oblique ultrasound image obtained through the hepatic confluence shows the right hepatic vein. The hepatic parenchyma appears homogeneous. (b) No fluid collections are found in the hepatorenal space.

Ultrasound Doppler evaluation of hepatic vessels. (a) Doppler ultrasound image and pulsed Doppler waveform of the hepatic artery in a recipient with liver transplantation. The waveform indicates a resistive index of 0.79 (normal range, 0.5–0.8). (b) The main portal vein shows a normal continuous waveform with mild velocity variations due to respiration. (c) The hepatic vein Doppler examination shows fluctuations across the baseline, which characterizes the normal triphasic pattern.
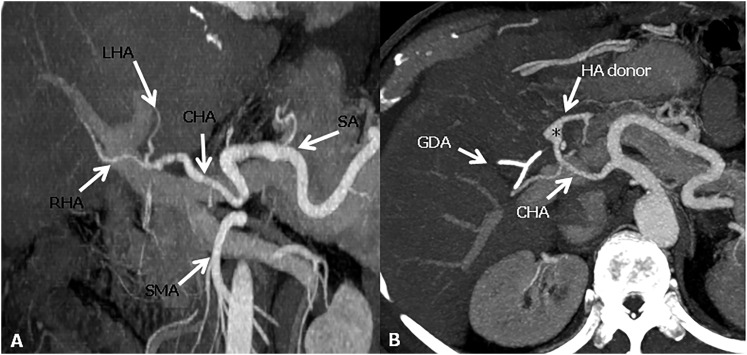
Hepatic artery anastomoses. (a) The conventional “fish mouth” anastomosis between and the common hepatic artery (CHA) of the recipient and the CHA of the donor. (b) Axial maximum intensity projections image shows a pseudoaneurysm appearance (asterisk) of the anastomotic site between the gastroduodenal artery (GDA) of the recipient and the CHA of the donor. HA donor, hepatic artery donor; LHA, left hepatic artery; RHA, right hepatic artery; SA, splenic artery; SMA, superior mesenteric artery.
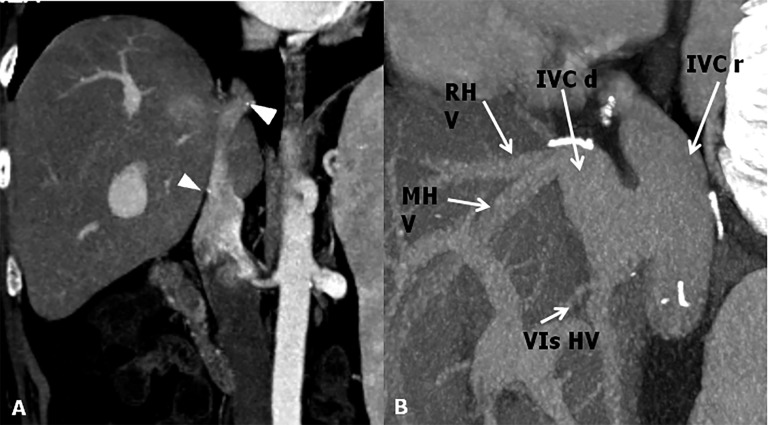
Inferior vena cava (IVC) anastomoses. (a) CT post-contrast image shows end-to-end anastomosis. To note the surgical clips at the superior and inferior anastomotic sites (arrowheads). (b) Maximum intensity projections sagittal shows a cavoplasty outflow connection, where the graft of the IVC is patched directly onto an incised recipient IVC. IVC d, IVC donor; IVC r, IVC recipient; MHV, mid hepatic vein; RHV, right hepatic vein; VIs HV, hepatic vein for the sixth segment.
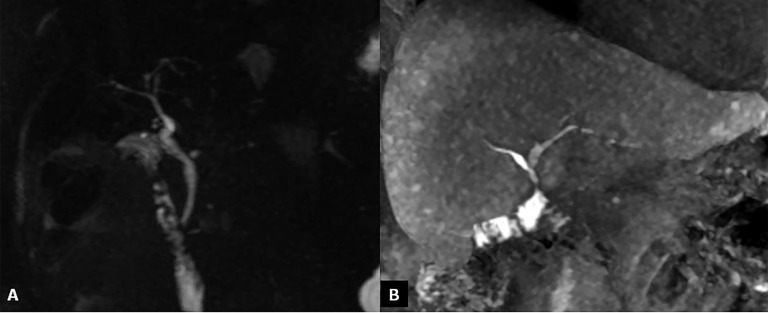
Bile duct anastomoses. (a) Maximum intensity projections reconstruction of three-dimensional thin-slab fast spin-echo T2 weighted images show a regular hepaticocholedochostomy. (b) Coronal MR contrast-enhanced image obtained after intravenous administration of a hepatobiliary contrast agent (gadoxetic acid); cholangiography shows a normal hepaticojejunostomy.
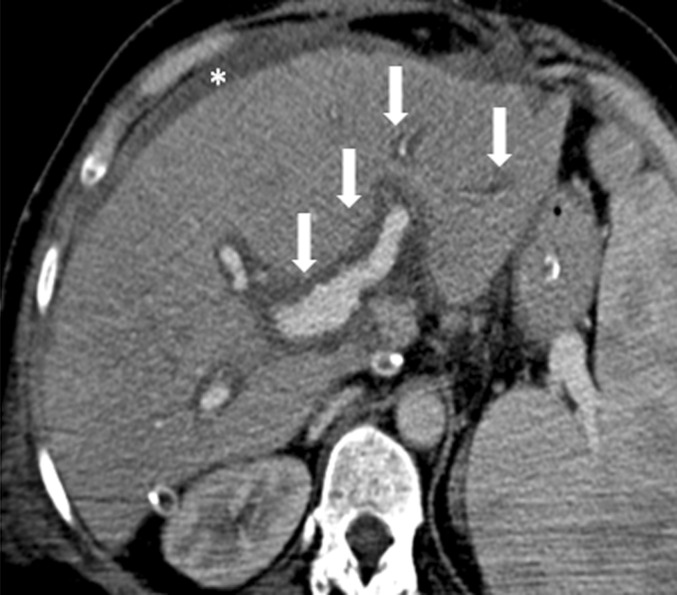
Acute rejection. Axial contrast-enhanced CT image shows low attenuation of the liver parenchyma due to tissue patency, periportal oedema space (arrows) and ascites (asterisk).
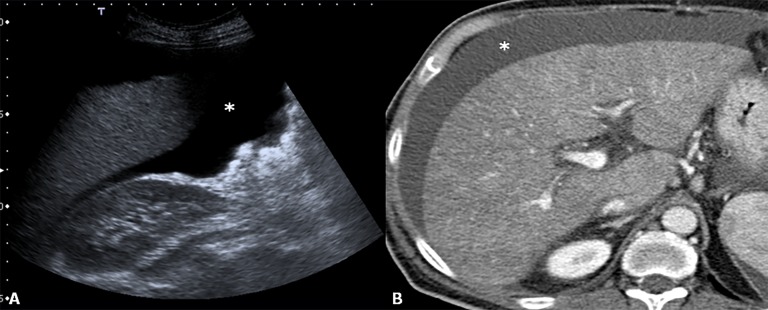
Primary non-function. Ultrasound (a) and CT (b); after intravenous administration of contrast agent, images revel non-homogeneity of liver parenchyma. To note the presence of ascites (asterisks) which is a sign of liver patency.
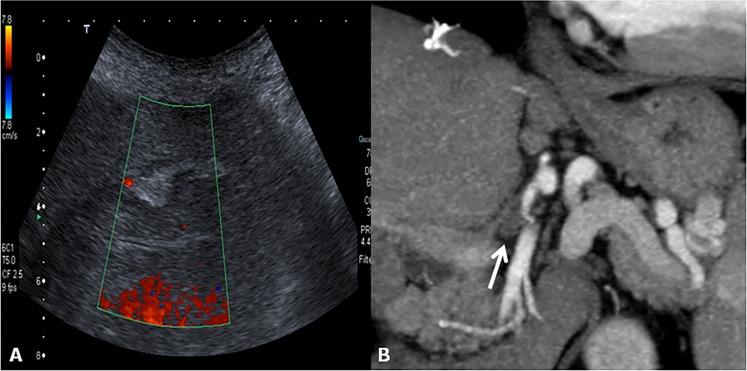
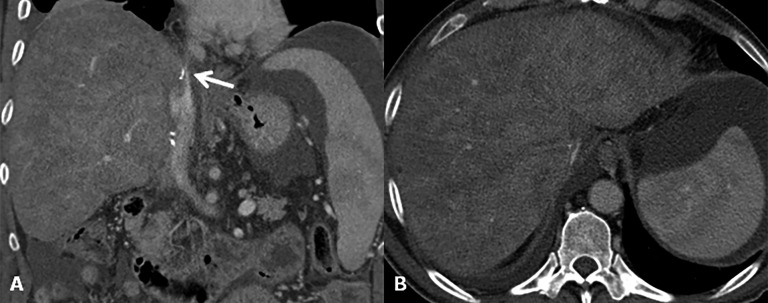
Hepatic artery thrombosis. (a) Colour Doppler image at the “porta hepatis” does not reveal blood flow within the hepatic artery. (b) The corresponding CT coronal image acquired during the arterial phase shows the thrombosis of the hepatic artery of the donor at the anastomotic site (arrow).
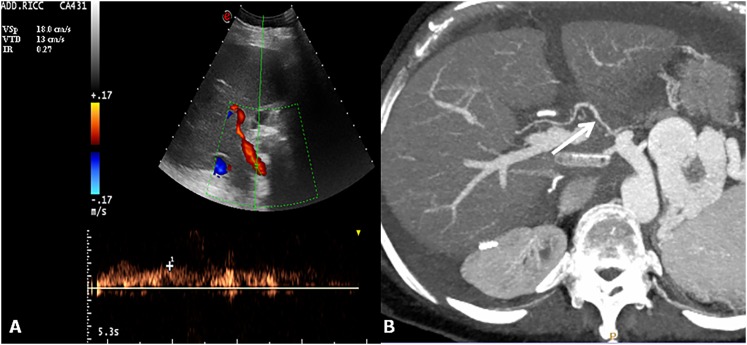
Hepatic artery stenosis. Colour and spectral Doppler image of hepatic artery shows a tardus–parvus waveform with a prolonged acceleration time and decreased resistive index 0.27 (normal range, 0.5–0.8). Axial maximum intensity projection of the hepatic artery shows tiny calibre and irregular margins of the arterial vessel (arrow).
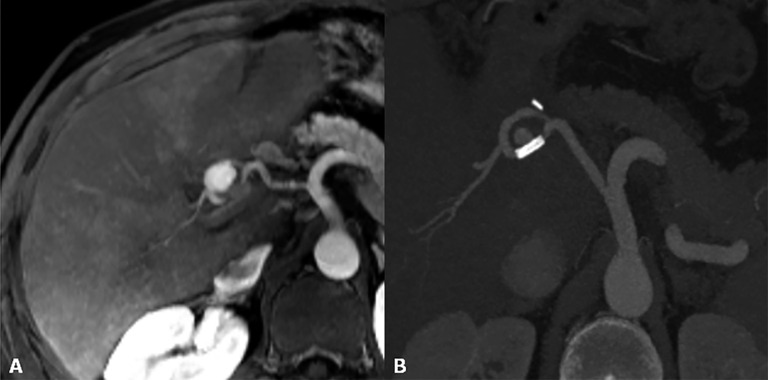
Hepatic artery pseudoaneurysm. (a) MR angiography reveals a rounded lesion along the hepatic artery at the anastomotic site with homogeneous contrast enhancement. (b) After stent placement, the pseudoaneurysm is not completely excluded.
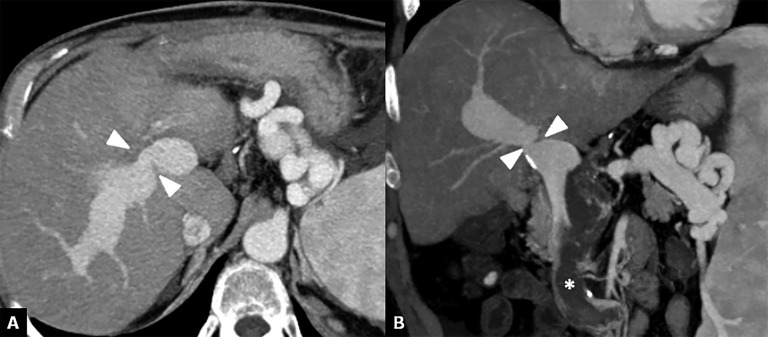
Portal vein stenosis. (a, b) Axial and coronal CT images show a severe portal vein stenosis (arrowheads) at site of the anastomosis. To note the presence of thrombus within the superior mesenteric vein (asterisk).
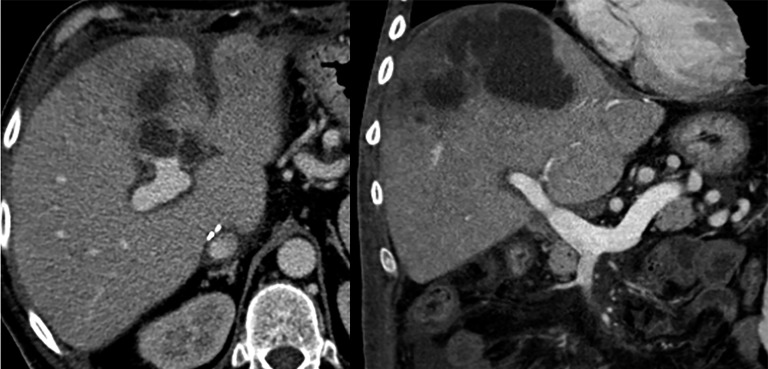
Outflow obstruction. (a) Coronal CT image after contrast agent injection reveals a supraanastomotic stenosis of the inferior vena cava (arrow). To note on the axial image (b) secondary findings including hepatomegaly, ascites and signs of Budd–Chiari syndrome (liver mosaic pattern perfusion).
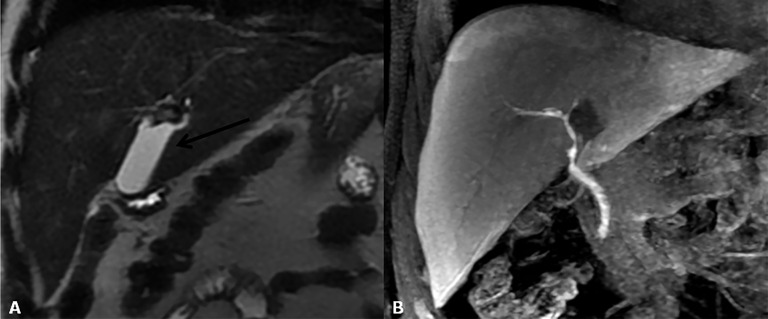
Biloma. (a) Coronal T2 weighted image shows a fluid collection at the “porta hepatis”. (b) Contrast-enhanced MR cholangiography demonstrates the absence of connection between the bile ducts and biloma.
Bile leakage. (a–c) Contrast-enhanced MR cholangiography reveals (at different levels) a biliary leakage along the surgical cut in split liver transplantation. To note the extravasation of contrast material into the fluid collection (arrows in a, b) before it has opacified the bile ducts (open arrowhead in c).
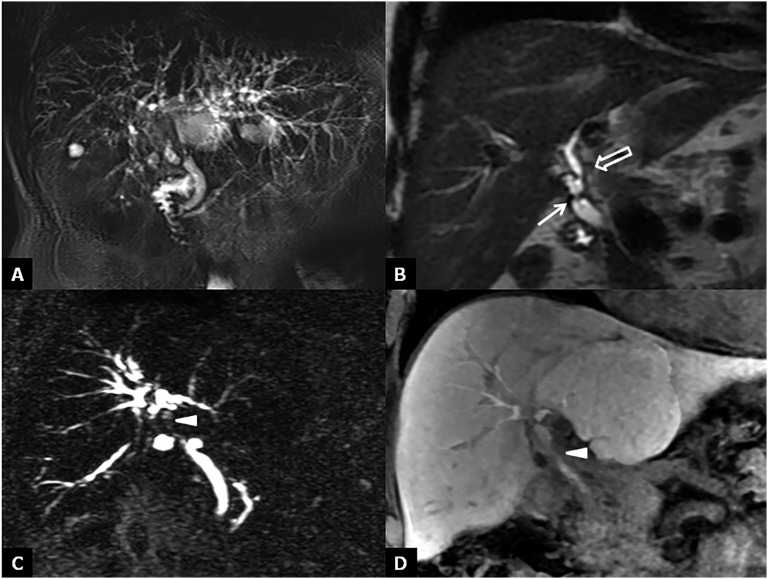
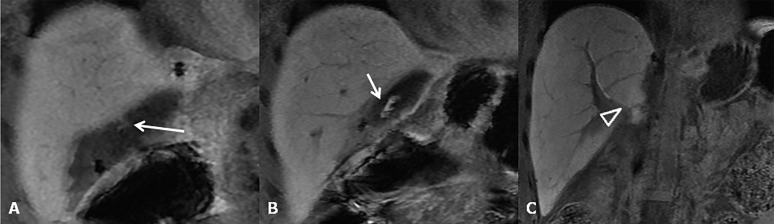
Bile duct strictures. (a) Maximum intensity projections of three-dimensional (3D) thin-slab fast spin-echo T2 weighted image demonstrates the dilation and strictures of the intrahepatic biliary of both left and right lobes. (b) Coronal T2 weighted image shows intrahepatic (open arrow) and anastomotic (arrow) strictures. (c, d) Maximum intensity projections of 3D thin-slab fast spin-echo T2 weighted image and the corresponding T1 weighted MR cholangiography obtained after intravenous administration of a hepatobiliary contrast agent (gadoxetic acid) show an anastomotic stricture (arrowheads). To note that MR cholangiography tends to overestimate biliary stricture.
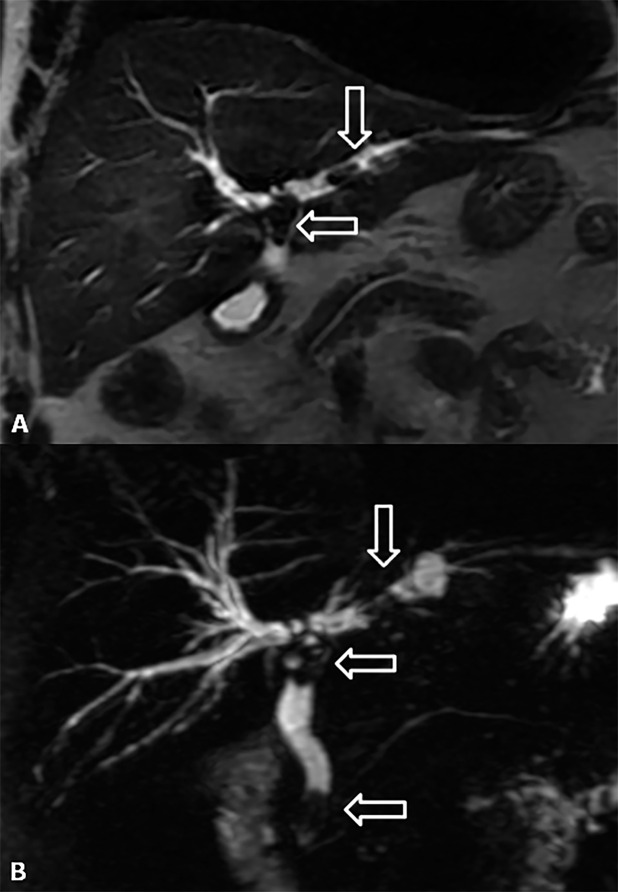
Lithiasis of the bile ducts. (a, b) Coronal T2 weighted image and maximum intensity projections of three-dimensional thin-slab fast spin-echo T2 weighted image show the dilation of both intra- and extrahepatic biliary tracts with the presence of three stones (arrows) at the level of hepatic bifurcation, in the left hepatic duct and in juxtapapillary site.
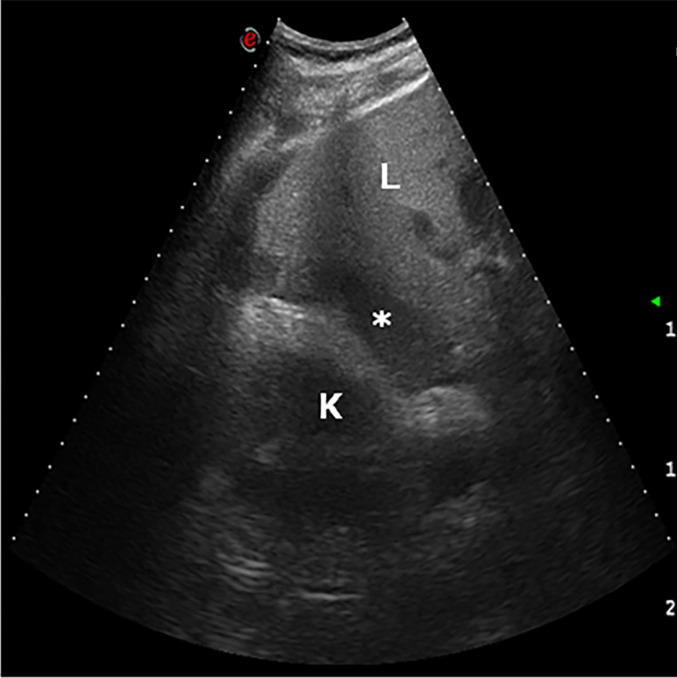
Haematoma. The day after liver transplantation, ultrasound examination demonstrates a low-echogenicity fluid collection in the hepatorenal region (asterisk). K, kidney; L, liver.
Abscess. Axial and coronal CT post-contrast-enhanced images show a large multiloculated lesion in the right lobe of the liver surrounded by other smaller fluid collections.
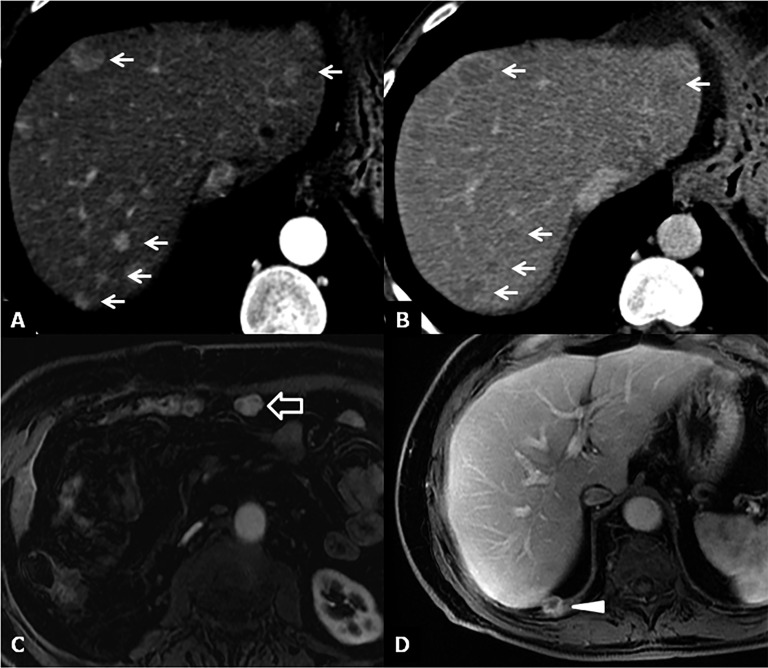
Recurrence of disease. (a, b) CT images 6 months after liver transplantation show multiple hypervacular nodules on the arterial phase (a) with washout during the delayed phase (b) suggestive for hepatocellular carcinoma (HCC) recurrence (arrows). (c) Axial MR image acquired during the arterial phase shows a hypervascular nodule near the anterior abdominal wall, as recurrence of HCC (open arrow). (d) Axial MR image during the venous phase demonstrates a focal lesion on the surface of the diaphragm as recurrence of hepatocholangiocarcinoma (arrowhead).
References
LinkOut - more resources
Full Text Sources
Other Literature Sources
