. 2016 May 18;16(1):38.
doi: 10.1186/s12880-016-0140-1.

Development of a morphology-based modeling technique for tracking solid-body displacements: examining the reliability of a potential MRI-only approach for joint kinematics assessment

Affiliations

Development of a morphology-based modeling technique for tracking solid-body displacements: examining the reliability of a potential MRI-only approach for joint kinematics assessment

Niladri K Mahato et al. BMC Med Imaging. .

Abstract

Background: Single or biplanar video radiography and Roentgen stereophotogrammetry (RSA) techniques used for the assessment of in-vivo joint kinematics involves application of ionizing radiation, which is a limitation for clinical research involving human subjects. To overcome this limitation, our long-term goal is to develop a magnetic resonance imaging (MRI)-only, three dimensional (3-D) modeling technique that permits dynamic imaging of joint motion in humans. Here, we present our initial findings, as well as reliability data, for an MRI-only protocol and modeling technique.

Methods: We developed a morphology-based motion-analysis technique that uses MRI of custom-built solid-body objects to animate and quantify experimental displacements between them. The technique involved four major steps. First, the imaging volume was calibrated using a custom-built grid. Second, 3-D models were segmented from axial scans of two custom-built solid-body cubes. Third, these cubes were positioned at pre-determined relative displacements (translation and rotation) in the magnetic resonance coil and scanned with a T1 and a fast contrast-enhanced pulse sequences. The digital imaging and communications in medicine (DICOM) images were then processed for animation. The fourth step involved importing these processed images into an animation software, where they were displayed as background scenes. In the same step, 3-D models of the cubes were imported into the animation software, where the user manipulated the models to match their outlines in the scene (rotoscoping) and registered the models into an anatomical joint system. Measurements of displacements obtained from two different rotoscoping sessions were tested for reliability using coefficient of variations (CV), intraclass correlation coefficients (ICC), Bland-Altman plots, and Limits of Agreement analyses.

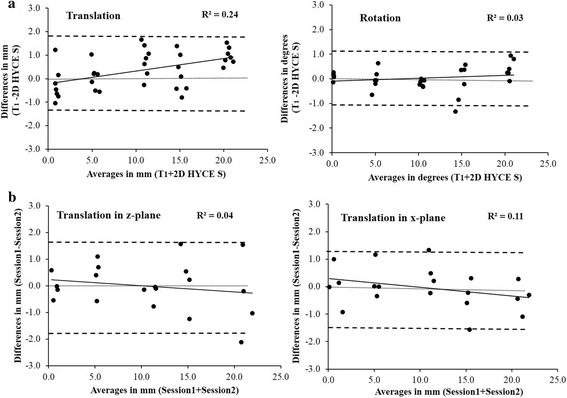
Results: Between-session reliability was high for both the T1 and the contrast-enhanced sequences. Specifically, the average CVs for translation were 4.31 % and 5.26 % for the two pulse sequences, respectively, while the ICCs were 0.99 for both. For rotation measures, the CVs were 3.19 % and 2.44 % for the two pulse sequences with the ICCs being 0.98 and 0.97, respectively. A novel biplanar imaging approach also yielded high reliability with mean CVs of 2.66 % and 3.39 % for translation in the x- and z-planes, respectively, and ICCs of 0.97 in both planes.

Conclusions: This work provides basic proof-of-concept for a reliable marker-less non-ionizing-radiation-based quasi-dynamic motion quantification technique that can potentially be developed into a tool for real-time joint kinematics analysis.

Keywords: Back pain; Dynamic sequence; MRI; Scientific rotoscoping; Stereophotogrammetry.


Figures

Fig. 1
Fig. 1
Steps involved in the technique and types of displacements quantified. a Overview of the quantification technique. b Number of trials for each type of displacement performed. Note that for each displacement paradigm, data from two different pulse sequences were obtained
Fig. 2
Fig. 2
Overview of the animation processes leading to the quantification of a single-plane and biplanar displacements. a Imaging volume calibration: (i) the calibration grid with orientation of the plates in space, (ii) MRI coil with orientation of the imaging volume, (iii) & (iv) pre- and post-digitized bead images from the grid. b (i) Shows positioning of a translation trial. The solid-body models are spaced ~10 mm apart flat on a foam platform. The lower cube has been translated by 0.5 mm to the right relative to the upper cube, indicated by a wooden pointer (asterisk) and measured by the caliper. The orientation of the displacement has been shown by the coordinate axis. (ii) View of the wooden cubes. (iii) High-resolution axial T1 image slice through a cube. (iv) Representative 3-D model of a segmented cube. (v) Model as viewed after being imported into the animation environment. c (i) Representative image from a single-plane translation trial with the T1 sequence. (ii) Representative image from a single-plane rotation trial with the contrast-enhanced sequence. d (i) Representative single-plane rotoscoping “scene.” The image slice (off-white background) lies obliquely across the figure. The solid-body shadow is visible with its outline in the image slice (lower arrow). Upper half of the superimposed cube model is visible (upper arrow) with the anatomical axis. (ii) Image frame from a translation trial viewed from the top of the animation scene. The two cube models are cut through by the image slice (dark horizontal plane) across the hourglass holes within the models. (iii) Orthogonal image slices with registered 3D models
Fig. 3
Fig. 3
Bland–Altman plots of translation (a) and rotation (b) trials for each sequence. a: Plots of the translation displacements quantified with the two sequences. The dashed lines representing the 95 % confidence interval of test-retest differences for all translations show that the between-session differences were within ±1.24 mm (mean/bias = 0.02 mm) and ±1.59 mm (mean/bias = -0.34 mm) for the T1 (left) and the 2D HYCE S (right) sequences, respectively. b: Plots of the rotation displacements quantified with the two sequences. The dashed lines representing the 95 % confidence interval of all rotations show that the test-retest differences were within ±1.27° (mean/bias = -0.14°) and ±0.65° (mean/bias = 0.09°) for the T1 (left) and the 2D HYCE S (right) sequences, respectively. The central narrow line denotes zero difference mark. The dark line at the center represents the trend line. Homoscedasticity (R2 values < 0.1) indicated that the between-session differences in the measurements did not increase with an increase in the magnitude of the measured displacement. Heteroscedasticity was represented by R2 values > 0.1, indicating that the between-session differences in the measurements increased with an increase in the magnitude of the measured displacement
Fig. 4
Fig. 4
Bland-Altman plots comparing outcomes between T1 and the 2D HYCE S sequences (a). Plots of the bi-planar translation quantified with the 2D HYCE S sequence (b). a. Plots comparing outcomes using T1 and the 2D HYCE S sequences. The dashed lines representing the 95 % confidence intervals show that the between-session differences in the measurements obtained with the T1 and the 2D HYCE S sequences fell within ±1.85 mm (mean/bias = 0.35 mm) for translations (left) and within ±0.950 (mean/bias = 0.020) for all rotations (right) quantified. b. Bland–Altman plots for biplanar translations. The dashed lines representing the 95 % confidence intervals show that the test-retest differences for translations fell within ±1.77 mm (mean/bias = -0.01 mm) and ±1.41 mm (mean/bias = -0.04 mm) for the z- and x-planes, respectively. The central narrow line denotes zero difference mark. The dark line at the center represents the trend line. Homoscedasticity (R2 values < 0.1) indicated that the random errors did not increase with an increase in the magnitude of the measured values. Homoscedasticity (R2 values < 0.1) indicated that the differences in the measurements did not increase with the increase in the magnitude of the measured displacement. Heteroscedasticity was represented by R2 values > 0.1, indicating that the differences in the measurements increased with the increase in the magnitude of the measured displacement

References

    1. Cappozzo A, et al. Human movement analysis using stereophotogrammetry. Part 1: theoretical background. Gait Posture. 2005;21(2):186–96. - PubMed
    1. Della Croce U, et al. Human movement analysis using stereophotogrammetry. Part 4: assessment of anatomical landmark misplacement and its effects on joint kinematics. Gait Posture. 2005;21(2):226–37. doi: 10.1016/j.gaitpost.2004.05.003. - DOI - PubMed
    1. Reinschmidt C, et al. Effect of skin movement on the analysis of skeletal knee joint motion during running. J Biomech. 1997;30(7):729–32. doi: 10.1016/S0021-9290(97)00001-8. - DOI - PubMed
    1. Cereatti A, Della Croce U, Cappozzo A. Reconstruction of skeletal movement using skin markers: comparative assessment of bone pose estimators. J Neuroeng Rehabil. 2006;3:7. doi: 10.1186/1743-0003-3-7. - DOI - PMC - PubMed
    1. Chiari L, et al. Human movement analysis using stereophotogrammetry. Part 2: instrumental errors. Gait Posture. 2005;21(2):197–211. doi: 10.1016/j.gaitpost.2004.04.004. - DOI - PubMed

Publication types

MeSH terms