. 2016 May 18:17:369.
doi: 10.1186/s12864-016-2701-7.

Seasonal immunoregulation in a naturally-occurring vertebrate

Affiliations

Seasonal immunoregulation in a naturally-occurring vertebrate

Martha Brown et al. BMC Genomics. .

Abstract

Background: Fishes show seasonal patterns of immunity, but such phenomena are imperfectly understood in vertebrates generally, even in humans and mice. As these seasonal patterns may link to infectious disease risk and individual condition, the nature of their control has real practical implications. Here we characterize seasonal dynamics in the expression of conserved vertebrate immunity genes in a naturally-occurring piscine model, the three-spined stickleback.

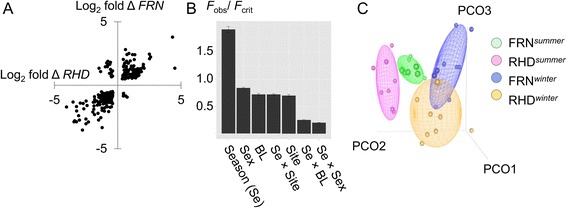
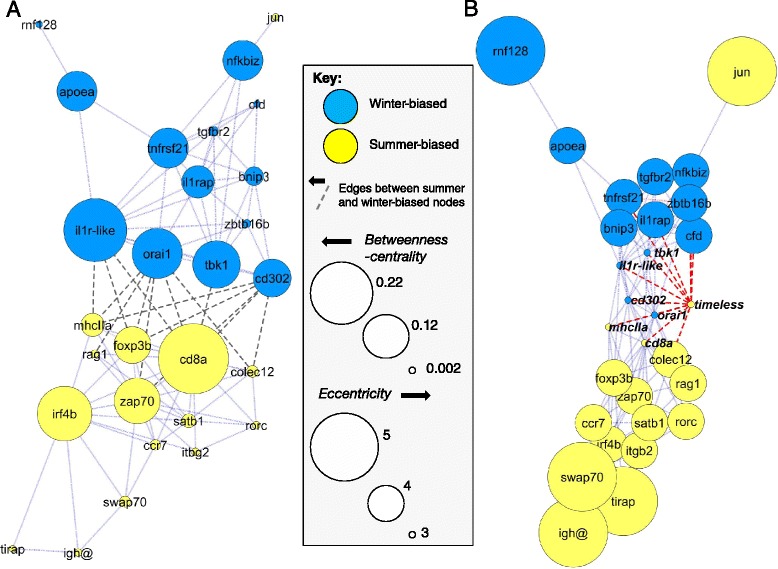
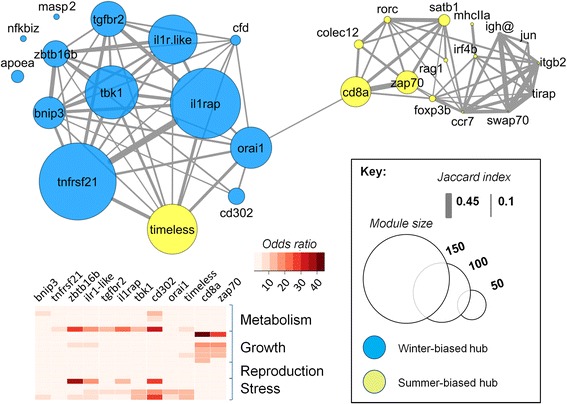
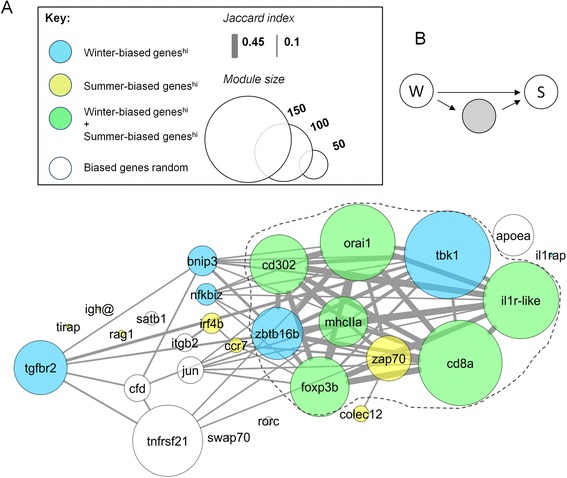
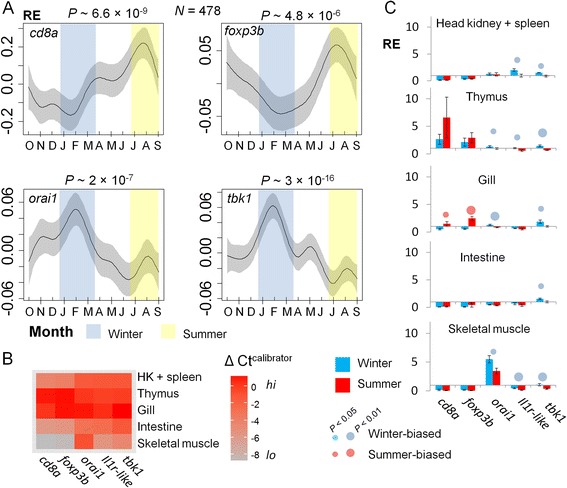
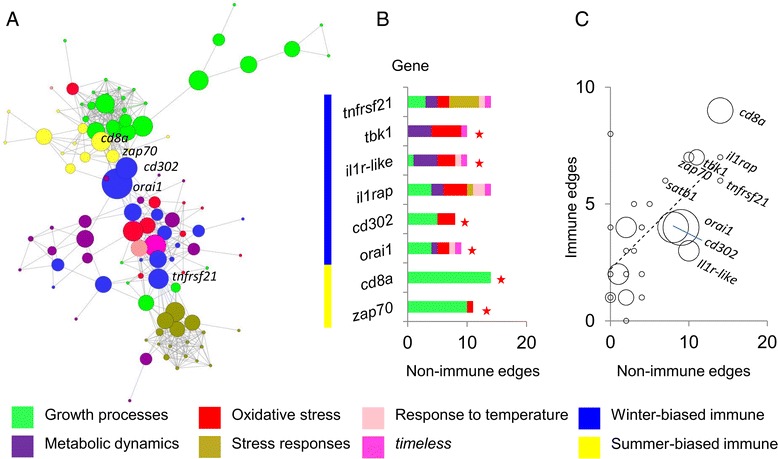
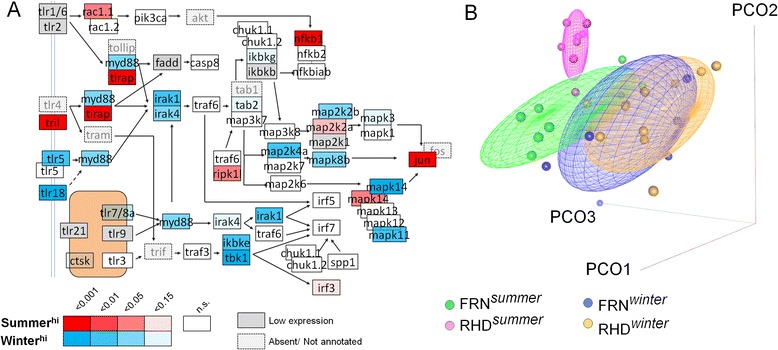
Results: We made genome-wide measurements (RNAseq) of whole-fish mRNA pools (n = 36) at the end of summer and winter in contrasting habitats (riverine and lacustrine) and focussed on common trends to filter habitat-specific from overarching temporal responses. We corroborated this analysis with targeted year-round whole-fish gene expression (Q-PCR) studies in a different year (n = 478). We also considered seasonal tissue-specific expression (6 tissues) (n = 15) at a third contrasting (euryhaline) locality by Q-PCR, further validating the generality of the patterns seen in whole fish analyses. Extremes of season were the dominant predictor of immune expression (compared to sex, ontogeny or habitat). Signatures of adaptive immunity were elevated in late summer. In contrast, late winter was accompanied by signatures of innate immunity (including IL-1 signalling and non-classical complement activity) and modulated toll-like receptor signalling. Negative regulators of T-cell activity were prominent amongst winter-biased genes, suggesting that adaptive immunity is actively down-regulated during winter rather than passively tracking ambient temperature. Network analyses identified a small set of immune genes that might lie close to a regulatory axis. These genes acted as hubs linking summer-biased adaptive pathways, winter-biased innate pathways and other organismal processes, including growth, metabolic dynamics and responses to stress and temperature. Seasonal change was most pronounced in the gill, which contains a considerable concentration of T-cell activity in the stickleback.

Conclusions: Our results suggest major and predictable seasonal re-adjustments of immunity. Further consideration should be given to the effects of such responses in seasonally-occurring disease.

Keywords: Ecoimmunology; Immunity; Immunoregulation; RNAseq; Seasonality; Teleost; Three-spined stickleback; Wildlife.


Figures

Fig. 1
Fig. 1
Distinctive immunological and genome-wide gene expression signatures occurred at seasonal extremes. a Gene sets with significant summer (red) or winter (blue) expression bias as indicated by gene set enrichment analysis (GSEA). Ranked differential gene expression was compared, separately for the RHD and FRN sites, to global KEGG and REACTOME gene sets, and sets are shown where the combined FDR P value was significant (<0.05); gene set names are truncated but shown in full in Additional file 2: Table S2; stars indicate immunologically-relevant gene sets; the central dendrogram indicates the degree of overlap between gene sets. b Analyses of selected gene sets (Additional file 3: Table S3) representing immunological pathways and organismal signatures of stress, reproduction, growth and metabolism. Individual colour panels correspond, left to right, to the order of gene sets in Additional file 3: Table S3. These sets were considered by GSEA for RHD and FRN separately, and by gene overlap (hypergeometric distribution) for the overall summer and winter-biased gene sets (defined as those genes having significant expression differences, in the same direction, at both FRN and RHD)
Fig. 2
Fig. 2
Extremes of season were the dominant predictor of immune gene expression. a Scatterplot of log2 winter-summer fold expression change (log2 fold Δ) for all immune-associated (ImmPort list) genes with significant seasonal difference (individual P < 0.05) at both RHD and FRN sites. Overwhelmingly such genes were regulated in the same direction across sites. b Season was overwhelmingly the most important predictor of immune gene expression, in comparison to site, sex and body size (analysis based on all ImmPort list genes, n = 3648). Bar chart summarizes results from general linear models (LMs) fitted to each individual log2 immune-associated gene expression variable; bars are the mean observed F value (± 1 SE) for each model term (BL, body length; Se, season), expressed as a proportion of the critical value (P = 0.05) and relate to models lacking interaction terms in the case of the main effects. c Principal co-ordinates (PCO) ordination of immune-associated gene expression (all ImmPort list genes), indicating strong divergence between summer and winter samples along similar site-specific trajectories; plot showing scatter of individual points against the 3 major axes (PCO-1-3) and concentration ellipsoids containing 50 % of points
Fig. 3
Fig. 3
ARACNe networks of seasonally-biased core immune genes. Winter- and summer-biased nodes segregate to different regions of networks and interface via a small set of central nodes that are highly connected amongst themselves and also within their respective winter- or summer-biased set. a Network 1. Nodes sized according to their betweenness-centrality (a measure of centrality and thus potential influence within a network); network shown with a force-directed layout, modified to highlight edges (dashed) between summer and winter-biased genes (entire network stretched laterally with winter and summer regions displaced from each other vertically). b Network 1 re-analyzed with summer-biased timeless added as an extra node; nodes sized according to eccentricity (an inverse centrality measure) and shown with an unmodified force-directed layout. Edges from timeless connect to winter-summer interface genes and further winter-biased genes
Fig. 4
Fig. 4
ARACNe network (Network 2) of all seasonally-biased genes, specifying core immune genes and timeless as hubs. Nodes, shown in a modified force-directed layout, represent gene module sizes associated with hubs and edges are Jaccard similarity coefficients for module composition (cut-off, 0.1). Modules associated with winter and summer-biased immune hubs segregate to different regions of the network, with the strongest winter-summer module similarity between orai1 and cd8a. The module associated with the summer-biased timeless is primarily similar to modules associated with winter-biased hubs. For larger modules the heat map (bottom left) shows significant odds ratio gene overlaps with gene sets representing organismal signatures of metabolism, growth, reproduction and stress
Fig. 5
Fig. 5
ARACNe network (Network 3) of all immune-associated genes (ImmPort comprehensive list of immune-related genes), specifying seasonally-biased core immune genes as hubs. a Nodes, shown in a modified force-directed network, represent gene module sizes associated with hubs and edges are Jaccard similarity coefficients for module composition (cut-off, 0.1). Node colours indicate modules significantly enriched in winter-biased genes, summer-biased genes or both (see key). Modules associated with hubs that were winter-summer interface nodes in Network 1 tended to be large, to share a high degree of similarity in composition, and to contain significant enrichments of both winter- and summer-biased genes. b Form of simple structural equation model (path analysis) used in assessing the influence of winter-summer interface (key) genes from Network 1; W, main axis of covariation in winter-biased core immune genes (represented by the first principal component of a principal components analysis); S, main axis of covariation in summer-biased core immune genes; grey circle, expression of individual winter-summer interfacing gene
Fig. 6
Fig. 6
Corroborative whole-fish and tissue-specific Q-PCR gene expression measurements. a Temporal variation from October 2013 to September 2014 in whole-fish gene expression for winter-summer interface (key) genes from Network 1, n = 478. Relative expression (RE) (normalized to endogenous control genes and indexed to a calibrator sample) is indicated on the y-axis. Plots show thin-plate-spline smoothers for time fitted in a generalized additive model (GAM) with fixed effects for habitat, sex and length; shaded areas represent 95 % confidence regions. Samples were derived from FRN, RHD and artificial outdoors habitats stocked from FRN. The other key gene examined, il1r-like, also demonstrated significant seasonal variation (P = 0.0019) with peak expression in December (not shown), if log10 transformed. b Tissue-specific expression of key genes at STO (summer, n = 5; winter n = 10). Heat map showing relative gene expression across tissues; significant differences occurred for all genes (P <0.001). c Tissue-specific seasonal variation in key genes at STO. Mean relative expression (RE) ± 1 SE is shown on the y-axis. P values (c) relate to directional (1-tailed) t-tests of seasonal shifts in the same direction as the whole-fish RNAseq study; 13/25 of these tests were significant but, in comparison (post-hoc), 0/25 of 1-tailed tests in the opposite direction were significant. The calibrator sample for tissue-specific analyses was pooled whole-fish RNA from 20 individuals in September. The STO samples showed no significant difference in fish length between winter and summer and were balanced for sex ratio (see Additional file 8: Table S6)
Fig. 7
Fig. 7
Association between seasonal core immune genes and wider organismal signatures of growth, metabolism and stress. a ARACNe network (Network 4) including seasonal core immune genes, timeless, and seasonal genes from curated sets representing growth, metabolism, and aspects of stress (oxidative stress, stress responses, temperature responses); specifying all genes as hubs; nodes sized according to their betweenness-centrality. Network shown in an unmodified force-directed layout. b Bar chart showing, for the most highly connected core immune genes in Network 4, the distribution of edges with genes representing wider organismal signatures (stars indicate winter-summer interface “key” genes in Network 1). Colour bar outside vertical axis indicates winter- or summer expression bias. c Scatterplot showing, for core immune genes in Network 4, numbers of edges to other immune genes vs numbers of edges to non-immune genes (Pearson r = 0.65, P = 1.6 × 10−4); point sizes are proportional to the number of winter-summer edges for the gene in Network 1 (key genes from Network 1 were significantly more likely to show > 7 non-immune edges in Network 4, compared to other core immune genes, P = 0.006)
Fig. 8
Fig. 8
Seasonal bias in toll-like receptor (TLR) signalling pathway. a Differential winter-summer gene expression in pathway members (based on modified KEGG TLR signalling pathway), demonstrating winter bias in some cases and summer bias in others. Categorization of differential expression is based on overall significance levels in general linear models (LMs) with explanatory terms for site, sex and length (less stringent criteria than used in initial genome-wide analyses). b Principal co-ordinates (PCO) ordination of gene expression in all pathway members, revealing considerable winter-summer discrimination; scatter of individual points against the 3 major axes (PCO-1-3) and concentration ellipsoids containing 50 % of points

References

    1. Martin LB, Weil ZM, Nelson RJ. Seasonal changes in vertebrate immune activity: mediation by physiological trade-offs. Philos Trans R Soc Lond B Biol Sci. 2008;363:321–339. doi: 10.1098/rstb.2007.2142. - DOI - PMC - PubMed
    1. Dopico XC, Evangelou M, Ferreira RC, Guo H, Pekalski ML, et al. Widespread seasonal gene expression reveals annual differences in human immunity and physiology. Nat Commun. 2015;6:7000. doi: 10.1038/ncomms8000. - DOI - PMC - PubMed
    1. Paynter S, Ware RS, Sly PD, Williams G, Weinstein P. Seasonal immune modulation in humans: Observed patterns and potential environmental drivers. J Infect. 2014;70:1–10. doi: 10.1016/j.jinf.2014.09.006. - DOI - PubMed
    1. Curtis AM, Bellet MM, Sassone-Corsi P, O’Neill LA. Circadian clock proteins and immunity. Immunity. 2014;40:178–186. doi: 10.1016/j.immuni.2014.02.002. - DOI - PubMed
    1. Zhang R, Lahens NF, Ballance HI, Hughes ME. Hogenesch JB (2014) A circadian gene expression atlas in mammals: Implications for biology and medicine. Proc Natl Acad Sci U S A. 2014;111:16219–16224. doi: 10.1073/pnas.1408886111. - DOI - PMC - PubMed

Publication types

Substances

LinkOut - more resources