. 2016 Jul;64(7):1252-64.
doi: 10.1002/glia.22997.

Neuronal activity mediated regulation of glutamate transporter GLT-1 surface diffusion in rat astrocytes in dissociated and slice cultures

Affiliations

Neuronal activity mediated regulation of glutamate transporter GLT-1 surface diffusion in rat astrocytes in dissociated and slice cultures

Sana Al Awabdh et al. Glia. 2016 Jul.

Abstract

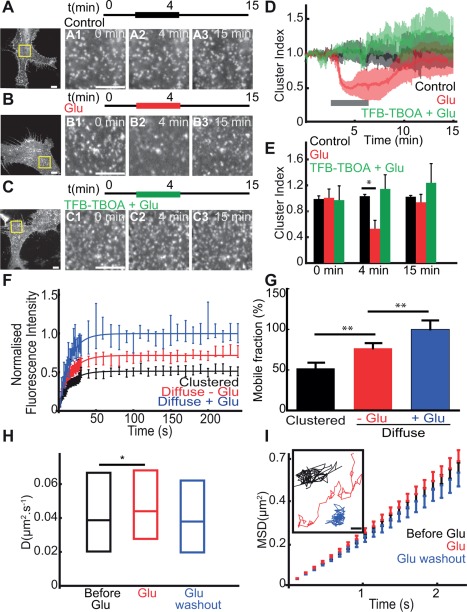
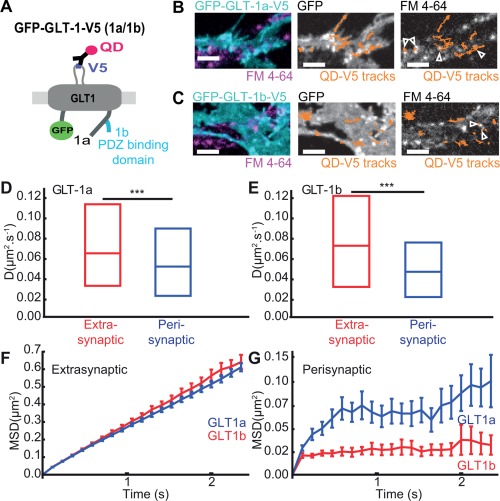
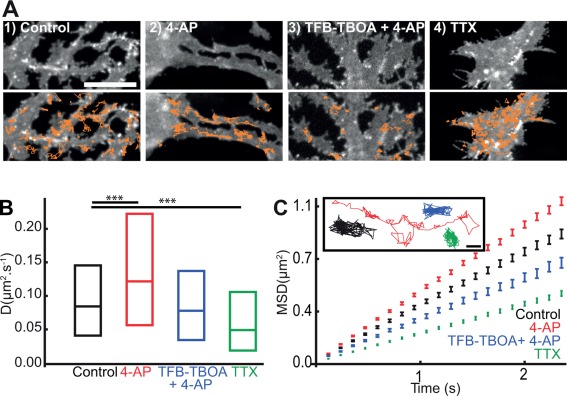
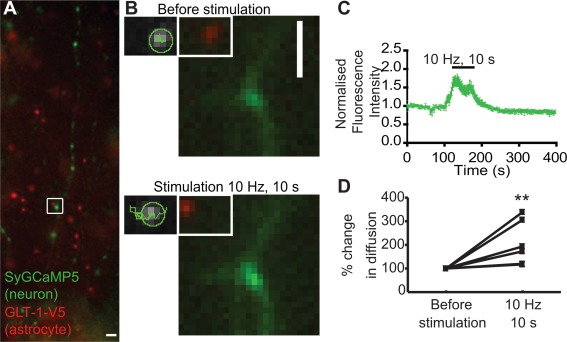
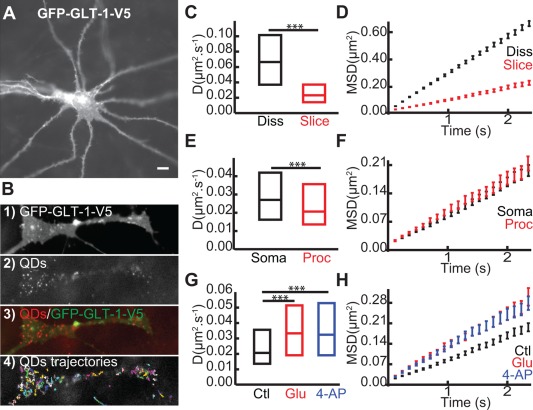
The astrocytic GLT-1 (or EAAT2) is the major glutamate transporter for clearing synaptic glutamate. While the diffusion dynamics of neurotransmitter receptors at the neuronal surface are well understood, far less is known regarding the surface trafficking of transporters in subcellular domains of the astrocyte membrane. Here, we have used live-cell imaging to study the mechanisms regulating GLT-1 surface diffusion in astrocytes in dissociated and brain slice cultures. Using GFP-time lapse imaging, we show that GLT-1 forms stable clusters that are dispersed rapidly and reversibly upon glutamate treatment in a transporter activity-dependent manner. Fluorescence recovery after photobleaching and single particle tracking using quantum dots revealed that clustered GLT-1 is more stable than diffuse GLT-1 and that glutamate increases GLT-1 surface diffusion in the astrocyte membrane. Interestingly, the two main GLT-1 isoforms expressed in the brain, GLT-1a and GLT-1b, are both found to be stabilized opposed to synapses under basal conditions, with GLT-1b more so. GLT-1 surface mobility is increased in proximity to activated synapses and alterations of neuronal activity can bidirectionally modulate the dynamics of both GLT-1 isoforms. Altogether, these data reveal that astrocytic GLT-1 surface mobility, via its transport activity, is modulated during neuronal firing, which may be a key process for shaping glutamate clearance and glutamatergic synaptic transmission. GLIA 2016;64:1252-1264.

Keywords: neuron-astrocyte interaction; organotypic slices; single particle tracking; synapse.


Figures

Figure 1
Figure 1
Regulation of GLT‐1 surface diffusion by glutamate is transporter activity dependent. Astrocytes cultured alone and transfected with GFP‐GLT‐1 or GFP‐GLT‐1‐V5 and imaged live after 4 to 7 days expression. AC: Representative time lapse imaging illustrates the GFP‐GLT‐1 clusters in control untreated astrocytes (A), treated with 100 μM Glu (B) or with 10 μM TFB‐TBOA + 100 μM Glu (C). Control images before treatment of a whole astrocyte (left panel). Schematic of recovery experiments. Regions boxed in left panels shown before treatment at 0 min, during treatment at 4min and after recovery at 15 min. Scale bars, 10 μm. D: Time course of GFP‐GLT‐1 de‐clustering (cluster index, V/V0) in astrocytes control untreated (black, n = 7 cells), Glu treated (green, n = 8 cells) and Glu + TFB‐TBOA treated (red, n = 7 cells) astrocytes. E: Cluster index at 0, 4, and 15 min. Loss of fluorescence in GFP‐GLT‐1 clusters at 4 min is significant compared with untreated control (P = 0.023) but is not significantly different at 15 min (P > 0.05). F: Fluorescence Recovery after Photobleaching. Quantification of GFP fluorescence intensity shows the recovery of diffuse GLT‐1 (red) is greater than clustered GLT‐1 (black) and that glutamate increases GLT‐1 recovery (blue). Data points represent an average of movies and are fitted with single exponentials (black, red, and blue lines). G: The mobile fraction, quantified as the final amount of recovered fluorescence presented as a percentage of the total bleached fluorescence, for diffuse GLT‐1 (black, n = 12 videos, 74.67 ± 4.890) is significantly increased compared with that for GLT‐1 in clusters (red, n = 9 videos, 51.92 ± 5.120; P = 0.002, t test) and GLT‐1 in glutamate is significantly increased compared with before treatment (blue, n = 6 videos, 100.2 ± 8.769; P = 0.01, t test). H: Instantaneous diffusion coefficients and (I) MSD versus time, MSDt plot, and representative single trajectories, Scale bar, 0.5 μm of QD‐tagged GFP‐GLT‐1‐V5. Control before treatment (black, median = 0.039 μm2/s; n = 579 trajectories), after 2 min with 100 μM glutamate (red, median = 0.044 μm2/s; n = 504 trajectories) and after drug washout (blue, median = 0.038 μm2/s; n = 276 trajectories). Median D is significantly increased upon 100 μM glutamate treatment (P = 0.005, Mann‐Whitney test) but is not significantly different after glutamate washout (P > 0.05).
Figure 2
Figure 2
GLT‐1 is stable and confined inside synaptic areas under basal conditions. Astrocytes in hippocampal neuron‐astrocyte mixed culture transfected with GFP‐GLT‐1a‐V5 or GFP‐GLT‐1b‐V5 at DIV10 and imaged at DIV13 after FM4‐64 staining. A: Schematic representation of GFP‐GLT‐1(a/b)‐V5 labelled by an anti‐V5 antibody/QD complex. B,C: Representative time lapse imaging illustrates GFP‐GLT‐1a‐V5 (B) and GFP‐GLT‐1b‐V5 (C) in a region of an astrocyte. GFP‐GLT‐1‐V5 overlaid with FM4‐64 stained synapses (left panels), or by QD‐tagged GFP‐GLT‐1‐V5 trajectories shown in orange (middle panels), and FM4‐64 stained synapses overlaid by QD‐tagged GFP‐GLT‐1‐V5 trajectories shown in orange (right panels), Scale bars 5 μm. D: Instantaneous diffusion coefficients of extrasynaptic GLT‐1a (red, median = 0.065 μm2/s; n = 599 trajectories) and perisynaptic GLT‐1a (blue, median = 0.052 μm2/s; n = 112 trajectories), median D is significantly decreased in perisynaptic areas (P= 6x10 − 3, Mann‐Whitney test). E: Instantaneous diffusion coefficients of extrasynaptic GLT‐1b (red, median = 0.071 μm2/s; n = 255 trajectories) and perisynaptic GLT‐1b (blue, median = 0.047 μm2/s; n = 62 trajectories). Median D is significantly decreased in perisynaptic areas (P = 8 × 10⁻⁵, Mann‐Whitney test). MSDt plot of extrasynaptic (F) and perisynaptic (G) GLT‐1a and GLT‐1b.
Figure 3
Figure 3
Neuronal activity mediated GLT‐1 surface diffusion increase is transporter activity dependent. Hippocampal neuron‐astrocytes mixed culture transfected with GFP‐GLT‐1a‐V5 at DIV10 and imaged at DIV13. A: Representative time lapse imaging illustrates GFP‐GLT‐1a‐V5 in a region of interest of an astrocytic process (top panel) and overlaid by QD‐tagged GFP‐GLT‐1a‐V5 trajectories shown in orange (bottom panels) in control untreated (1), treated 20 min with 1 mM 4‐AP (2), 20 min with TFB‐TBOA 10 μM + 4‐AP 1mM (3) or 1 µM of TTX (4), Scales bars 10 μm. Instantaneous diffusion coefficients (B) and MSDt plot and single trajectories (C) of QD‐tagged GFP‐GLT‐1‐V5. Control untreated (black, median = 0.08 μm2/s; n = 1061 trajectories), after 20 min with 1 mM 4‐AP (red, median = 0.12 μm2/s; n = 779 trajectories), after 20 min of TFB‐TBOA 10 μM + 4‐AP 1 mM (blue, median = 0.08 μm2/s; n = 282 trajectories) and after 20 min with 1 µM of TTX (green, median = 0.05 μm2/s; n = 1191 trajectories). Median D is significantly increased upon 4‐AP (P = 2 × 10⁻¹⁴, Mann‐Whitney test) and is significantly decreased upon TTX (P = 1.2 × 10⁻¹⁴, Mann‐Whitney test) but is not significantly different upon TFB‐TBOA 10 μM + 4‐AP 1 mM (P > 0.05).
Figure 4
Figure 4
Electrical stimulation mediates GLT‐1 transporter surface mobility at activated synapses. A: Representative images of hippocampal neurons transfected with SyGCaMP5 (green) at 7‐10 DIV, cocultured with astrocytes pretransfected with GLT‐1‐V5 (Red). Cocultures were maintained for 3‐4 DIV and imaged using an image splitter. Scale bar, 10 μm. B: Region boxed in (A) and representative single trajectories shown before stimulation (top panel), and during (bottom panel, 10 Hz for 10 s, 100 PA). Scale bar, 2 μm. C: Time course of SyGCaMP5 fluorescence F/F0 (6 synapses). Background signal at each corresponding time point was subtracted from the SyGCaMP5 signal before normalizing to the first 10 frames (F/F0). D: Percentage of change in GLT‐1 surface diffusion significantly increased during stimulation compared to before (n = 6 trajectories, P = 0.04, Mann‐Whitney test).
Figure 5
Figure 5
Glutamate and neuronal activity regulate GLT‐1 surface diffusion in brain slices. A: Example of astrocyte expressing GFP‐GLT‐1‐V5 and imaged 3–5 days after transfection. Scale bar, 10 μm. B: Zoomed region on an astrocytic process expressing GFP‐GLT‐1‐V5 (B1), QDs (B2), QDs overlaid with GFP‐GLT‐1‐V5 (B3) and representative QD trajectories (B4). Instantaneous diffusion coefficients (C,E,G) and MSDt plot of QD‐tagged GLT‐1 (D,F,H). C,D: In dissociated culture (black, median D = 0.067 μm2/s; n = 783 trajectories) and in slice cultures (red, median = 0.021 μm2/s; n = 325 trajectories), median D is significantly decreased in slice cultures compared with in dissociated cultures (P = 3.5 × 10−80, Mann‐Whitney test). D,E: In soma (black, median D = 0.027 μm2/s; n = 108 trajectories) and in processes (red, median D = 0.021 μm2/s; n = 325 trajectories), median D is significantly decreased in processes compared with in soma (P = 0.005, Mann‐Whitney test). G,H: After 2 min of glutamate 100 μM (red, median D = 0.033 μm2/s; n = 234 trajectories), and after 20 min of 4‐AP 1 mM (blue, median D = 0.032 μm2/s; n = 174 trajectories), median D is significantly increased in both treatment conditions compared with control (P glu = 1.15 × 10⁻¹⁰ and P 4‐AP = 0.03, Mann‐Whitney test).

References

    1. Akerboom J, Chen TW, Wardill TJ, Tian L, Marvin JS, Mutlu S, Calderón NC, Esposti F, Borghuis BG, Sun XR, Gordus A, Orger MB, Portugues R, Engert F, Macklin JJ, Filosa A, Aggarwal A, Kerr RA, Takagi R, Kracun S, Shigetomi E, Khakh BS, Baier H, Lagnado L, Wang SS, Bargmann CI, Kimmel BE, Jayaraman V, Svoboda K, Kim DS, Schreiter ER, Looger LL. 2012. Optimization of a GCaMP calcium indicator for neural activity imaging. J Neurosci 32:13819–13840. - PMC - PubMed
    1. Al Awabdh S, Miserey‐Lenkei S, Bouceba T, Masson J, Kano F, Marinach‐Patrice C, Hamon M, Emerit MB, Darmon M. 2012. A new vesicular scaffolding complex mediates the G‐protein‐coupled 5‐HT1A receptor targeting to neuronal dendrites. J Neurosci 32:14227–14241. - PMC - PubMed
    1. Arancibia‐Carcamo IL, Yuen EY, Muir J, Lumb MJ, Michels G, Saliba RS, Smart TG, Yan Z, Kittler JT, Moss SJ. 2009. Ubiquitin‐dependent lysosomal targeting of GABA(A) receptors regulates neuronal inhibition. Proc Natl Acad Sci U S A 106:17552–17557. - PMC - PubMed
    1. Asztely F, Erdemli G, Kullmann DM. 1997. Extrasynaptic glutamate spillover in the hippocampus: Dependence on temperature and the role of active glutamate uptake. Neuron 18:281–293. - PubMed
    1. Attwell D, Barbour B, Szatkowski M. 1993. Nonvesicular release of neurotransmitter. Neuron 11:401–407. - PubMed

Publication types

MeSH terms