Urokinase links plasminogen activation and cell adhesion by cleavage of the RGD motif in vitronectin
- PMID: 27189837
- PMCID: PMC4931562
- DOI: 10.15252/embr.201541681
Urokinase links plasminogen activation and cell adhesion by cleavage of the RGD motif in vitronectin
Abstract
Components of the plasminogen activation system including urokinase (uPA), its inhibitor (PAI-1) and its cell surface receptor (uPAR) have been implicated in a wide variety of biological processes related to tissue homoeostasis. Firstly, the binding of uPA to uPAR favours extracellular proteolysis by enhancing cell surface plasminogen activation. Secondly, it promotes cell adhesion and signalling through binding of the provisional matrix protein vitronectin. We now report that uPA and plasmin induces a potent negative feedback on cell adhesion through specific cleavage of the RGD motif in vitronectin. Cleavage of vitronectin by uPA displays a remarkable receptor dependence and requires concomitant binding of both uPA and vitronectin to uPAR Moreover, we show that PAI-1 counteracts the negative feedback and behaves as a proteolysis-triggered stabilizer of uPAR-mediated cell adhesion to vitronectin. These findings identify a novel and highly specific function for the plasminogen activation system in the regulation of cell adhesion to vitronectin. The cleavage of vitronectin by uPA and plasmin results in the release of N-terminal vitronectin fragments that can be detected in vivo, underscoring the potential physiological relevance of the process.
Keywords: RGD; cell adhesion; extracellular proteolysis; urokinase‐type plasminogen activator system; vitronectin.
© 2016 The Authors.
Figures

Effect of plasminogen activation on 293/uPAR cells morphology. 293/uPAR cells were seeded on VN and imaged by time‐lapse microscopy. Cells were treated with subsequent additions of 10 nM sc‐uPA and 30 nM plasminogen (Plg), and representative phase contrast images, taken just before and 2 h after addition of plasminogen, are shown. The complete time‐lapse recording can be found in Movie EV1. Scale bar, 20 μm.
Effect of plasminogen activation on 293/uPAR cells F‐actin cytoskeleton. 293/uPAR cells were seeded on VN and treated with 10 nM sc‐uPA (upper panel) or with a combination of 10 nM sc‐uPA and 30 nM Plg (lower panel). After 2 h, cells were fixed, permeabilized and stained with phalloidin. Representative images are shown.
Negative feedback between plasminogen activation and cell adhesion to VN. RTCA experiment of 293/uPAR cells seeded in VN‐coated E‐plates is shown. The data are from a representative experiment.
The catalytic activity of both uPA and plasmin (Pli) contributes to the negative feedback between plasminogen activation and cell adhesion. RTCA experiment was conducted with 293/uPARWT cells seeded in VN‐coated E‐plates and treated with 10 nM sc‐uPA, tc‐uPA and GFD, and 30 nM Plg and Pli as shown in the figure. A representative experiment is shown.
The cleavage of uPAR partially contributes to the negative feedback. 293/uPARR83/89A cells were seeded on VN and treated as in (D). A representative experiment is shown.
uPARR83/89A is not cleaved by uPA and plasmin. 293/uPARWT and 293/uPARR83/89A cells were seeded on FN‐coated tissue culture plates and allowed to adhere before treatment with the indicated reagents: 10 nM sc‐uPA and tc‐uPA, 30 nM Plg and Pli. After 1 h, cells were lysed, resolved by SDS–PAGE and analysed by immunoblotting using monoclonal antibodies recognizing different epitopes in uPAR 51. R2 binds an epitope in D3 of uPAR and recognizes the full‐length receptor (uPAR) as well as the truncated form lacking D1 (D2D3). R3 binds an epitope in D1 and only recognizes full‐length uPAR. The blot is from a representative experiment and the mobility of molecular weight standards is shown.


Pre‐treatment of VN with plasmin, but not uPA, inhibits subsequent cell adhesion mediated by uPAR and integrins. E‐plates wells coated with VN were incubated with a dilution curve of plasmin or tc‐uPA for 1 h at 37°C prior to cell seeding. After washing, 293/uPARWT or HeLa cells were seeded and their adhesion was followed by RTCA. The cell indexes recorded 1 h after seeding are shown. Data are reported as percentage of the cell index measured in non‐pre‐treated wells and represent the mean ± SD of three independent experiments.
Pre‐treatment of FN with plasmin or tc‐uPA does not affect subsequent cell adhesion. RTCA experiments were performed as described for (A), but with FN‐coated wells. Data are reported as percentage of the cell index measured in non‐pre‐treated wells and represent the mean ± SD of three independent experiments.
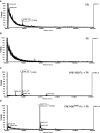
Plasmin cleaves VN at the 45RG peptide bond. Urea‐purified VN was incubated with plasmin (substrate/enzyme ratio: 10:1 w/w) for 2 h at 37°C and the reactions were analysed by MALDI‐TOF mass spectrometry.

- A, B
MALDI‐TOF spectra of untreated VN (A) and plasmin (Pli) alone (B).
- C, D
Representative MALDI‐TOF spectra of VN(1‐64)‐Fc (C) and VN(1‐64)R45A‐Fc (D) treated with plasmin.

- A
Cartoon illustrating the domain structure of human VN and the VN(1‐64)‐Fc chimera. The N‐terminal part of VN contains the SMB domain (residues 1–44) responsible for uPAR and PAI‐1 binding as well as the flanking 45RGD motif responsible for integrin binding. The remaining C‐terminal part contains hemopexin‐like repeats intersected by a heparin‐binding site and mediates binding to the ECM. The VN(1–64)‐Fc chimera contains residues 1–64 of human VN fused to the Fc region of a human IgG heavy chain. The locations of tc‐uPA and plasmin cleavage sites experimentally determined in this study are indicated in red while previously reported sites are reported in black.
- B
The R45A mutation in VN strongly impairs tc‐uPA‐mediated negative feedback. 293/uPARR83/89A cells were seeded on VNR45A or VNG46A and treated with 10 nM sc‐uPA or tc‐uPA at the indicated time point (stippled vertical line). A representative RTCA experiment is shown.
- C, D
Cleavage of VN in the RGD motif is responsible for the negative feedback of plasminogen activation on cell adhesion to VN. 293/uPARR83/89A cells were seeded on different VN variants and treated with 10 nM sc‐uPA, 10 nM tc‐uPA (C) or with a combination of 10 nM sc‐uPA, 30 nM Plg and 100 nM α2AP (D). To merge independent experiments, the cell index measured after 6 h of treatment is shown in % of the one measured for cells seeded on the same substrate, but treated with sc‐uPA, as depicted in (B). Dots are data from independent experiments and means ± SD are shown. The significance levels were evaluated using Student's t‐test (two‐tailed). *P < 0.05, **P < 0.01 and ***P < 0.001.

- A, B
RTCA analysis of 293/uPARWT or mutant cells (as indicated) seeded on VN(1‐64)R45A‐FcK78Q and treated with 10 nM sc‐uPA, 10 nM tc‐uPA (A) or with a combination of 10 nM sc‐uPA, 30 nM Plg and 100 nM α2AP (B). Independent experiments were merged as described for Fig 3C and D. Dots are data from independent experiments and means ± SD are shown. The significance levels were evaluated using Student's t‐test (two‐tailed). ns: P > 0.05, *P < 0.05 and **P < 0.01.

Plasminogen activation results in the generation of N‐terminal VN fragments containing the SMB domain. 293/uPAR cells were seeded on VN and treated with 10 nM sc‐uPA and tc‐uPA, 30 nM Plg and Pli, and 100 nM α2AP for 2 h at 37°C. The supernatants were harvested and the level of SMB‐containing VN fragments was measured by immunoassay (see Materials and Methods section). Values represent the mean ± SD of at least 3 independent experiments. The statistical significance was probed using Student's t‐test (two‐tailed). nd: not determined, ns: P > 0.05, ***P < 0.001 and ****P < 0.0001.
Cartoon illustrating the mechanism of action of the different compounds/mutation used in (C). The monoclonal antibody 8B12 is a competitive inhibitor of the interaction between uPAR and VN, having a binding site overlapping with that of VN 25. The Arg91 residue in uPAR is part of the VN binding epitope in uPAR. The GFD domain of uPA is a competitive antagonist of uPA binding to uPAR. ***P < 0.001 and ****P < 0.0001.
The generation of soluble VN fragments containing the SMB domain requires binding of both uPA and VN to uPAR. Cells were plated on VN and treated with 10 nM tc‐uPA. Where indicated, a 30 min pre‐incubation with 300 nM GFD or 30 μg/ml 8B12 was performed. Conditioned media were analysed as described in (A). Values represent the mean ± SD. The statistical significance was probed using Student's t‐test (two‐tailed).
uPAR accelerates the generation of SMB‐containing VN fragments by uPA. VN immobilized in 96‐well plates was incubated with 10 nM sc‐uPA or tc‐uPA together with increasing concentrations of soluble Fc‐tagged uPAR (uPARWT) or a mutant form specifically deficient in VN binding (uPARW32A/R91A). After a 1‐h incubation, the supernatants were recovered and analysed for the presence of N‐terminal VN fragments by immunoassay. The release is reported as percentage of the maximal signal observed in the experiment (10 nM uPARWT + tc‐uPA). Data points represent mean ± SD of three independent experiments.
Dose‐dependent binding of soluble uPAR to immobilized VN. The same experiment as in (D), but here quantifying the levels of VN‐bound uPAR. After the recovery of supernatants for VN‐fragment quantification, the 96‐well plates were washed and probed for bound uPAR‐Fc using an Eu3+‐labelled anti‐hFc antibody. The specific binding is reported in % of the maximal binding observed in the experiment (10 nM uPARWT + sc‐uPA). Data points represent the mean ± SD of three independent experiments.
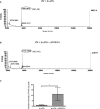
Levels of uPAR binding to VN and the release of VN fragments are strongly correlated. All the individual data points recorded in the three independent experiments described in (D and E) were analysed by plotting uPAR binding versus SMB release. Pearson's correlations are shown.


- A, B
VN was subjected to tc‐uPA digestion in the presence (B) or absence (A) of uPAR‐Fc. Reactions were analysed by MALDI‐TOF mass spectrometry and the intensity of 5,160‐Da peak was recorded.
- C
The graph shows the average relative intensity ± SD of the 5,160‐Da peak from 4 independent experiments. The statistical significance was probed by paired Student's t‐test (two‐tailed). *P < 0.05.

The complex between uPA and PAI‐1 is an agonist of the uPAR‐mediated cell adhesion to VN. RTCA analysis of 293/uPAR cells seeded on VN and treated with 10 nM sc‐uPA, PAI‐1 and uPA•PAI‐1 or a combination of 10 nM tc‐uPA and 10 nM PAI‐1. The time of the addition is indicated by a vertical dashed line.
Morphology of 293/uPAR cells treated with different agonists and antagonists of the uPAR‐VN interaction. 293/uPAR cells were seeded on VN‐coated coverslips, allowed to adhere and treated with 10 nM PAI‐1, sc‐uPA and uPA•PAI‐1 or vehicle for 1 h. The cells were fixed and DIC images recorded. Representative DIC images are shown. Scale bar, 10 μm.
Effect of the different treatments on 2D cell migration on VN. 293/uPAR cells were seeded in VN‐coated wells and treated as in (B). Cells were imaged by time‐lapse microscopy. Cell migration was quantified using ImageJ. The curves represent the average migration speed of 50 or more individual cells for each condition. The time at which cells were treated is depicted with a vertical dashed line.
In the presence of PAI‐1, plasminogen activation stimulates cell adhesion on VN. 293/uPARWT cells were seeded on VN‐coated plates. Cells were treated with 10 nM sc‐uPA and 10 nM PAI‐1 either alone or in combination followed by the addition of 30 nM Plg and 100 nM α2AP or vehicle as control. A representative RTCA experiment is shown.

The SMB domain is released by a wide variety of cancer cell lines. The cancer cell lines of epithelial origin belonging to the NCI‐60 panel (n = 38) were seeded on VN in the absence or presence of 30 nM Plg and 100 nM α2AP. The supernatants were harvested after 16 h and the level of SMB‐containing VN fragments was measured by immunoassay. Dots represent the concentration measured for the individual cell lines or the value obtained analysing control wells (no cells) from 10 independent experiments. Means ± SD are shown. The statistical significance was probed using paired Student's t‐test (two‐tailed). *P < 0.05 and ****P < 0.0001.
PLAU mRNA expression levels correlate with the SMB release. The levels of SMB released in the presence of Plg and α2AP were used as a query pattern and correlated with the expression levels of about 26,000 genes across the NCI‐60 panel, using the CellMiner web tool 32. The table shows the 10 most strongly correlated genes. The rank, gene name and Pearson's correlation coefficient (r) are reported.
Plasminogen activation induces a reduction in cell adhesion of human cancer cell lines. The epithelial cancer cell lines of the NCI panel were seeded on VN‐coated E‐plates and allowed to adhere for 4 h before the treatment with 30 nM Plg and 100 nM α2AP or vehicle. The graph shows the average normalized cell index of the 38 cell lines. The time of the addition (4 h) and the time at which the reduction of cell adhesion has been quantified (20 h) are depicted by dashed vertical lines.
Correlation between gene expression and basal cell adhesion to VN and reduction in cell adhesion upon Plg treatment. Adhesion 4 h after seeding the cells on VN (expressed as cell index) was measured in the experiment described in (C). The extent of cell adhesion reduction was calculated at the indicated time point in (C) as percentage of the cell index value measured in control wells treated with vehicle. Both parameters were correlated with the expression levels of the indicated genes. Gene expression data were downloaded from the CellMiner web tool. The table shows gene name, Pearson's correlation coefficient (r) and P‐value.
The negative regulation of cell adhesion correlates with the amount of released SMB. Scatter plot showing the correlation between the reduction in cell adhesion (panel C and Appendix Fig S7C) and SMB release (panel A and Appendix Fig S7B). The extent of cell adhesion reduction was calculated at the indicated time point in (C) as percentage of the cell index value measured in control wells treated with vehicle. Samples size (n), Pearson's correlation coefficient (r) and P‐value are reported.

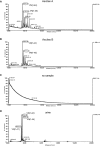
- A–D
Human ascites and urine samples were immunoprecipitated with HU3‐conjugated beads, and eluted material was analysed by MALDI‐TOF mass spectrometry. Representative spectra are shown.

Binding of sc‐uPA to uPAR induces conformational changes in the receptor increasing its avidity and affinity for matrix‐associated VN (I) leading to increased mechanical cell matrix coupling and subsequent cellular signalling. When at the plasma membrane, sc‐uPA and Plg activate each other (II) and cleave VN in the RGD motif (IIIa). Cleavage of VN at this position inactivates the pro‐adhesive properties of the molecule by destroying integrin binding and through release of the SMB domain from the extracellular matrix, thereby attenuating the mechanical coupling between cells and the extracellular matrix.
In conditions where PAI‐1 is also present, the activity of sc‐uPA in promoting cell adhesion is counterbalanced by PAI‐1 binding to an overlapping epitope in VN. When proteolysis is triggered, tc‐uPA reacts with VN‐associated PAI‐1 (IIIb) resulting in the formation of a transient quaternary uPAR:uPA•PAI‐1:VN complex (IV). The complex formation between uPA and PAI‐1 permanently inactivates the proteolytic activity of uPA and leads to major conformational changes in PAI‐1 that release it from VN (V) thereby liberating the SMB domain for interaction with uPAR (VI).
References
-
- Smith HW, Marshall CJ (2010) Regulation of cell signalling by uPAR. Nat Rev Mol Cell Biol 11: 23–36 - PubMed
-
- Ferraris GM, Sidenius N (2013) Urokinase plasminogen activator receptor: a functional integrator of extracellular proteolysis, cell adhesion, and signal transduction. Semin Thromb Hemost 39: 347–355 - PubMed
-
- Ellis V, Behrendt N, Danø K (1991) Plasminogen activation by receptor‐bound urokinase. A kinetic study with both cell‐associated and isolated receptor. J Biol Chem 266: 12752–12758 - PubMed
Publication types
MeSH terms
Substances
LinkOut - more resources
Full Text Sources
Other Literature Sources
Molecular Biology Databases
Miscellaneous

