. 2016 Jun 24;291(26):13699-714.
doi: 10.1074/jbc.M115.694422. Epub 2016 May 9.

Thiopurine Prodrugs Mediate Immunosuppressive Effects by Interfering with Rac1 Protein Function

Affiliations

Thiopurine Prodrugs Mediate Immunosuppressive Effects by Interfering with Rac1 Protein Function

Jin-Young Shin et al. J Biol Chem. .

Abstract

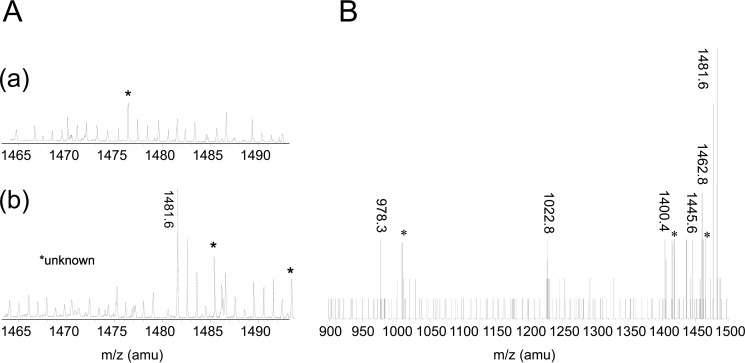
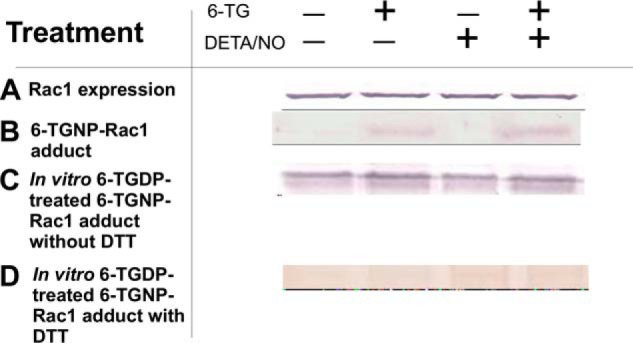
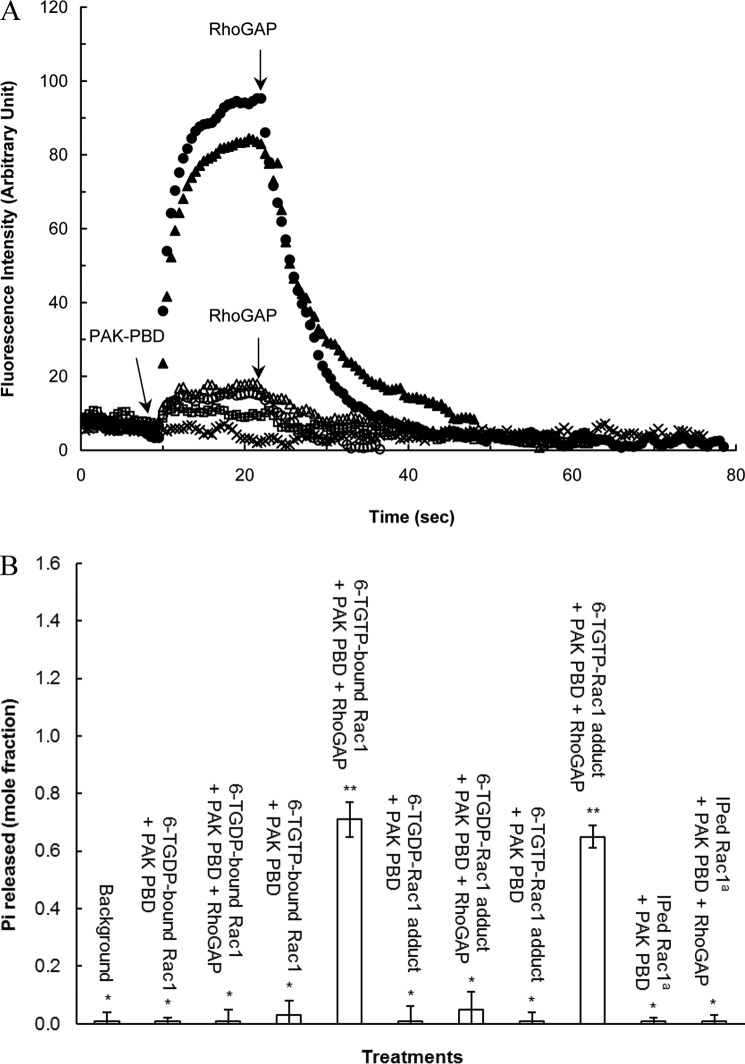
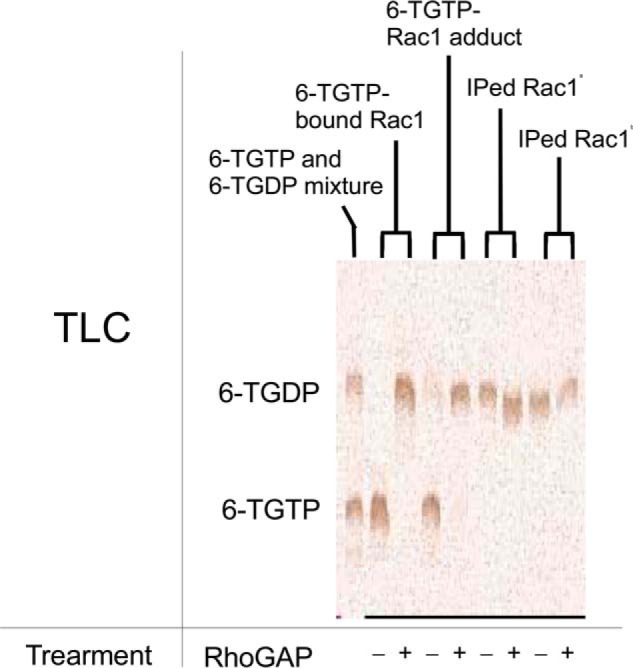
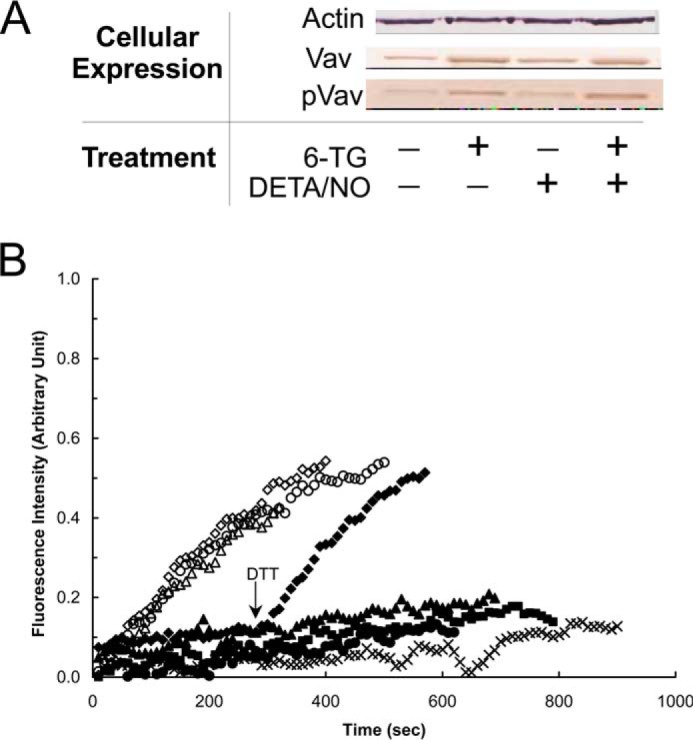
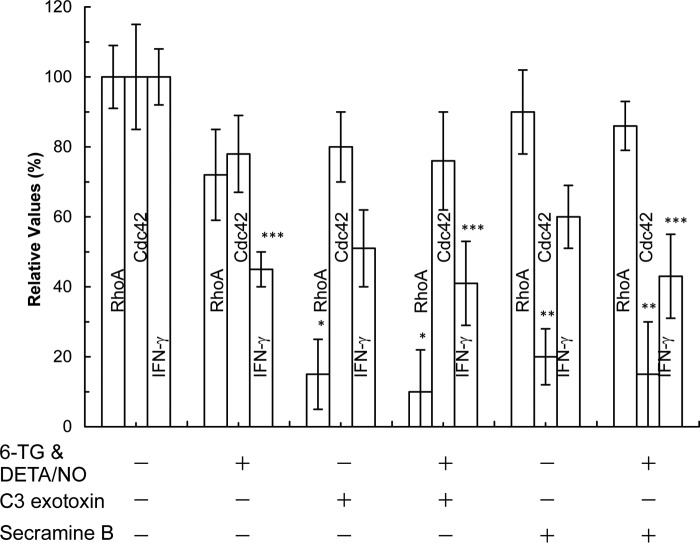
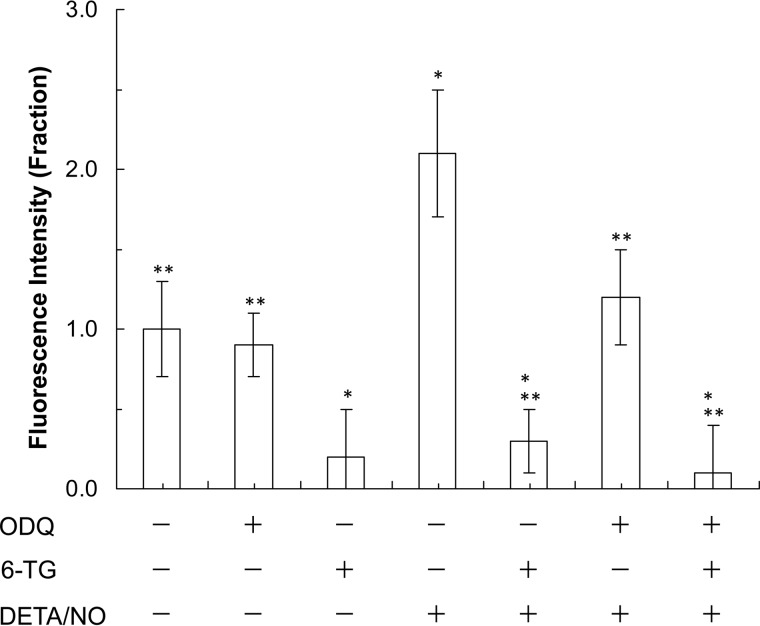
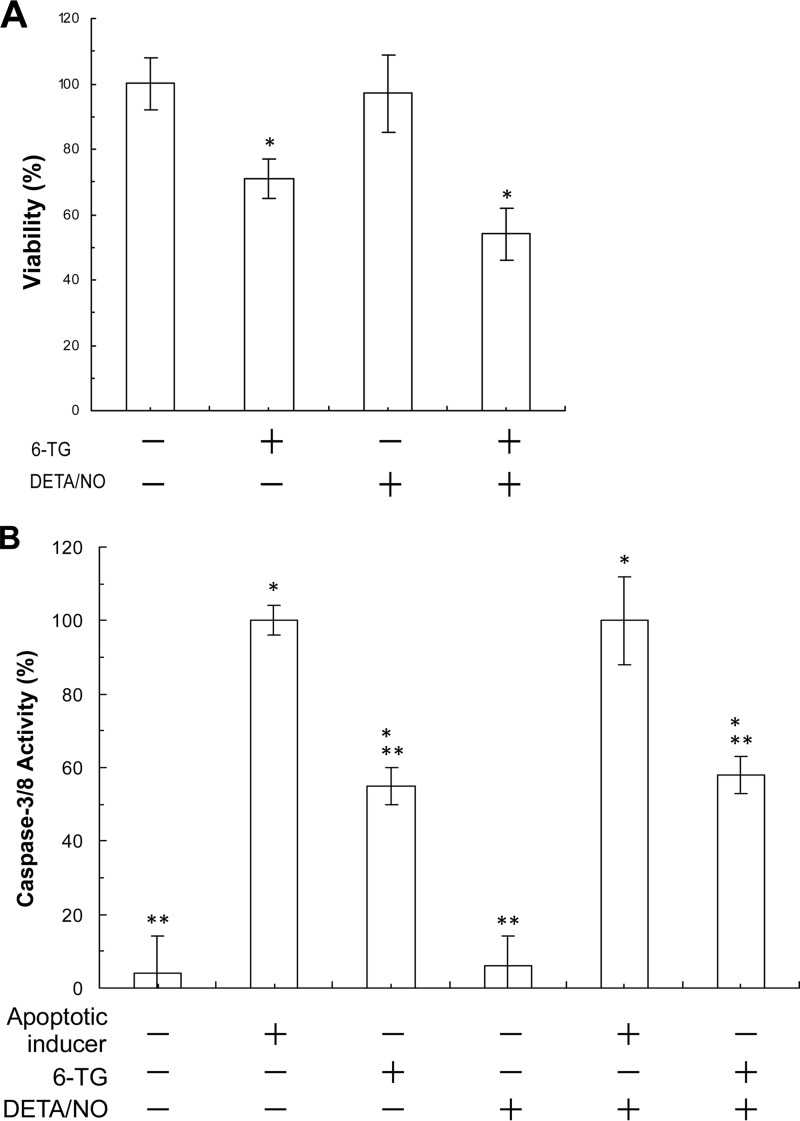
6-Thiopurine (6-TP) prodrugs include 6-thioguanine and azathioprine. Both are widely used to treat autoimmune disorders and certain cancers. This study showed that a 6-thioguanosine triphosphate (6-TGTP), converted in T-cells from 6-TP, targets Rac1 to form a disulfide adduct between 6-TGTP and the redox-sensitive GXXXXGK(S/T)C motif of Rac1. This study also showed that, despite the conservation of the catalytic activity of RhoGAP (Rho-specific GAP) on the 6-TGTP-Rac1 adduct to produce the biologically inactive 6-thioguanosine diphosphate (6-TGDP)-Rac1 adduct, RhoGEF (Rho-specific GEF) cannot exchange the 6-TGDP adducted on Rac1 with free guanine nucleotide. The biologically inactive 6-TGDP-Rac1 adduct accumulates in cells because of the ongoing combined actions of RhoGEF and RhoGAP. Because other Rho GTPases, such as RhoA and Cdc42, also possess the GXXXXGK(S/T)C motif, the proposed mechanism for the inactivation of Rac1 also applies to RhoA and Cdc42. However, previous studies have shown that CD3/CD28-stimulated T-cells contain more activated Rac1 than other Rho GTPases such as RhoA and Cdc42. Accordingly, Rac1 is the main target of 6-TP in activated T-cells. This explains the T-cell-specific Rac1-targeting therapeutic action of 6-TP that suppresses the immune response. This proposed mechanism for the action of 6-TP on Rac1 performs a critical role in demonstrating the capability to design a Rac1-targeting chemotherapeutic agent(s) for autoimmune disorders. Nevertheless, the results also suggest that the targeting action of other Rho GTPases in other organ cells, such as RhoA in vascular cells, may be linked to cytotoxicities because RhoA plays a key role in vasculature functions.

Keywords: 6-TGNP-Rac1 adduct; CD4+ cells; Rac1 inactivation; Ras-related C3 botulinum toxin substrate 1 (Rac1); T-cell; disulfide; immunosuppression; redox regulation; redox-sensitive GXXXXGK(S/T)C motif; thiopurine prodrugs.


Figures

FIGURE 1.
FIGURE 1.
6-TG and/or DETA/NO inhibits the T-cell Rac1 activity, IFN-γ secretion, and ERM dephosphorylation. A, Western blot analyses of CD4+ cells for the determination of the expression of Rac1 and ERM proteins were performed with anti-Rac1 and anti-ERM antibodies as described under “Experimental Procedures.” B, Rac1 activity, IFN-γ secretion, and pERM fraction in each treatment of CD4+ cells was measured as described under “Experimental Procedures.” The value of Rac1 activity and IFN-γ secretions determined from untreated cells was set at 100%. All pERM values were normalized against the value of pERM as determined from cells treated with both 6-TG and DETA/NO that were set at 100%. The data represented in the figure represent the mean values of triplicate measurements, and each of the vertical error bars indicates standard error (S.D.). The results of the ANOVA Tukey test were as follows: *, p < 0.01, versus the Rac1 activity of the untreated sample; **, p < 0.01, versus the IFN-γ secretion level of the untreated sample; and ***, p < 0.01, versus the quantity of pERM determined from cells treated with both 6-TG and DETA/NO.
FIGURE 2.
FIGURE 2.
6-TGNP, derived from 6-TG, targets Rac1 to produce 6-TGNP-Rac1 disulfide adduct in CD4+ cells. A, ESI-MS analyses of CD4+ cells for the detection of the 6-TGNP-Rac1 disulfide adduct were performed as described under “Experimental Procedures.” The MS peak at 1481.6 Da was only shown when CD4+ cells were treated with 6-TG (panel b) and not shown when CD4+ cells were not treated with 6-TG (panel a). B, MS/MS analysis was performed to identify the molecule that has a mass of 1481.6 Da. Major MS/MS peaks shown were best fitted to the masses of ion fragments of the 18TCLLIVFSK-6-TGDP adduct as follows: (i) 1462.8 Da, formed upon loss of H2O from the β-phosphate of the 6-TGDP moiety of 18TCLLIVFSK-6-TGDP adduct; (ii) 1445.6 Da., formed by losing an H2O and an OH from the β- and α-phosphate of the 6-TGDP moiety of 18TCLLIVFSK-6-TGDP adduct; (iii) 1400.4 Da, formed upon loss of COOH from the C terminus of the 18TCLLIVFSK-6-TGDP adduct as well as an H2O and an OH from the β- and α-phosphate of the 6-TGDP moiety of 18TCLLIVFSK-6-TGDP adduct; (iv) 1022.8 Da, formed upon loss of the 6-TGDP moiety from the 18TCLLIVFSK-6-TGDP adduct; and (v) the 978.3 Da, formed by losing the peptide C terminus COOH and the 6-TGDP moiety from the 18TCLLIVFSK-6-TGDP adduct.
FIGURE 3.
FIGURE 3.
DETA/NO does not enhance formation of the 6-TGNP-Rac1 disulfide adduct in CD4+ cells. A, Western analysis of CD4+ cells for the determination of Rac1 expression was performed using an anti-Rac1 antibody as described under “Experimental Procedures.” B, presence of the 6-TGNP-Rac1 disulfide adduct in the IPed Rac1 from CD4+ cells was examined by Western analysis by using an anti-6-TGNP antibody as noted under “Experimental Procedures.” C, Vav-mediated formation of the 6-TGNP-Rac1 disulfide adduct in the IPed Rac1 from CD4+ cells in the presence of 6-TGDP and/or NO was analyzed by Western blot by using an anti-6-TGNP antibody as described under “Experimental Procedures.” D, DTT-mediated removal of the 6-TGNP-Rac1 disulfide adduct in the IPed Rac1 from CD4+ cells also was examined by Western analysis by using an anti-6-TGNP antibody as described under “Experimental Procedures.” B, C, and D, a densitometer was used to quantify band intensities. The fractions of the 6-TGNP-Rac1 adduct were then expressed as normalized values against the values of the treatment with both 6-TG and DETA/NO of sample C, in which the band intensity was set at 100%. Accordingly, the band intensities of sample B were as follows: nontreatment (0%); 6-TG treatment (29%); DETA/NO treatment (0%); and 6-TG and DETA/NO treatment (38%). The band intensities of sample C were as follows: nontreatment 95%; 6-TG treatment (100%); DETA/NO treatment (92%); and 6-TG and DETA/NO treatment (100%). The band intensities of sample D were as follows: nontreatment (3%); 6-TG treatment (8%); DETA/NO treatment (9%); and 6-TG and DETA/NO treatment (1%). Standard deviations associated with the densitometry analyses of three independent experiments were less than 20% of the values given.
FIGURE 4.
FIGURE 4.
Although the 6-TGDP-Rac1 adduct is biologically inactive, the 6-TGTP-Rac1 adduct is biologically active. A, fluorescence rhodamine B-based binding assays of the rhodamine B-attached 6-TGNP-Rac1 adduct, the rhodamine B-attached 6-TGNP-bound Rac1, and IPed Rac1 with PAK-PBD in the presence and absence of RhoGAP were performed as described under “Experimental Procedures.” The addition of PAK-PBD followed by the addition of RhoGAP to the assay cuvette containing the rhodamine B-attached 6-TGTP-Rac1 adduct (▴), the rhodamine B-attached 6-TGDP-Rac1 adduct (▵), the rhodamine B-attached 6-TGTP-bound Rac1 (●), the rhodamine B-attached 6-TGDP-bound Rac1 (○), and the rhodamine B-attached IPed Rac1 from CD4+ cells treated with 6-TG and DETA/NO (□) was as indicated by the arrows. Note that the fluorescence spectrum of the rhodamine B-attached IPed Rac1 from CD4+ cells treated only with 6-TG was omitted because it overlapped with that of the rhodamine B-attached IPed Rac1 from CD4+ cells treated with 6-TG and DETA/NO. The rhodamine B-attached GTP-bound Rac1 that was not treated with PAK-PBD and/or RhoGAP (×) was used as a control. The rhodamine B-attached GDP-bound Rac1 that also was not treated with PAK-PBD and/or RhoGAP was used as a control. Nevertheless, its spectrum is almost identical to that of the rhodamine B-attached GTP-bound Rac1, and thus it is omitted for clarity. B, quantification of the Pi released from the 6-TGNP-bound Rac1, 6-TGNP-Rac1 adduct, and IPed Rac1 from CD4+ cells treated with 6-TG and DETA/NO with and without RhoGAP was determined by using malachite green as described under “Experimental Procedures.” The Pi quantities measured were then converted into the mole fractions (mole of Pi released/mol of 6-TGNP-bound Rac1 or 6-TGNP-Rac1 adduct). Note that the Pi value associated with its standard deviations determined for the IPed Rac1 from CD4+ cells treated only with 6-TG is identical to that for the IPed Rac1 from CD4+ cells treated with 6-TG and DETA/NO, and thus is not shown. The mean values data are represented with S.D. bars associated with three independent experiments. Statistical results from the ANOVA Tukey test were as follows: *, p < 0.01, versus the 6-TGTP-bound Rac1 treatment without RhoGAP; **, p < 0.01, versus the 6-TGTP-bound Rac1 treatment with RhoGAP. a, IPed Rac1, Rac1 IPed from CD4+ cells treated with 6-TG only.
FIGURE 5.
FIGURE 5.
Catalytic function of RhoGAP on the 6-TGTP-Rac1 adduct to produce the 6-TGDP-Rac1 adduct and free phosphate is preserved. TLC analysis for the quantification of 6-TGNP adducted to and bound to Rac1 as well as to the IPed Rac1 after the treatment with and without RhoGAP were conducted as described under “Experimental Procedures.” The far left lane represents the standard TLC indicator of free 6-TGTP and 6-TGDP. The fractions of the 6-TGDP and 6-TGTP were expressed, respectively, as normalized values against the sample value of 6-TGTP-bound Rac1 treatment with and without RhoGAP, in which their band intensities were set at 100%. Hence, the band intensities of fractions of the 6-TGTP-bound Rac1 without RhoGAP were estimated to be 6-TGTP (100%) and 6-TGDP (0%); with RhoGAP, they were estimated to be 6-TGTP (0%) and 6-TGDP (100%). The band intensities of fractions of the 6-TGTP-Rac1 adduct without RhoGAP were estimated to be 6-TGTP (98%) and 6-TGDP (3%); and with RhoGAP they were estimated to be 6-TGTP (1%) and 6-TGDP (89%). The band intensities of fractions of the IPed Rac1 from CD4+ cells treated with only 6-TG without RhoGAP were estimated to be 6-TGTP (0%) and 6-TGDP (78%). With RhoGAP, they were estimated to be 6-TGTP (0%) and 6-TGDP (85%). The band intensities of fractions of the IPed Rac1 from CD4+ cells treated with 6-TG and DETA/NO without RhoGAP were estimated to be 6-TGTP (0%) and 6-TGDP (77%); and with RhoGAP, they were estimated to be 6-TGTP (0%) and 6-TGDP (52%). Standard deviations of the densitometry analyses of the three independent measurements were less than 20% of the values shown. Note that the single band intensity and the sum of the band intensities of 6-TGTP and 6-TGDP are often less than 100%. This is likely because of imperfect spotting concentrations of each sample on the TLC plate. However, the key significance of this analysis is the concentration comparison of 6-TGTP versus 6-TGDP within the lanes but not the concentration comparison of 6-TGTP versus 6-TGDP between the lanes. Therefore, the analysis figures and their corresponding values are certainly valid. a, IPed Rac1, Rac1 IPed from CD4+ cells treated only with 6-TG; and b, IPed Rac1, Rac1 IPed from CD4+ cells treated with 6-TG and DETA/NO.
FIGURE 6.
FIGURE 6.
6-TG enhances the expression and phosphorylation of Vav but does not inhibit the specific activity of Vav in CD4+ cells. A, Western analyses were performed for Vav and pVav, respectively, by using anti-Vav and anti-pVav antibodies as described under “Experimental Procedures.” Actin expression was shown as a control. B, fluorescence mant-based kinetic properties of the 6-TGNP-Rac1 adduct, in comparison with the GDP-Rac1, in the presence and absence of various Vav proteins, were examined as described under “Experimental Procedures.” Both the GDP-bound Rac1 and the 6-TGDP-Rac1 adducts were used as substrates of Vav. Three different forms of Vav proteins also were used as follows: (i) Vav from nontreated; (ii) treated only with 6-TG; and (iii) 6-TG and DETA/NO treated CD4+ cells. Accordingly, six different kinetic assays were conducted as follows: the GDP-bound Rac1 with Vav from nontreated CD4+ cells (▵); the GDP-bound Rac1 with Vav from CD4+ cells treated with 6-TG (♢); the GDP-bound Rac1 with Vav from CD4+ cells treated with both 6-TG and DETA/NO (○); the 6-TGDP-Rac1 adduct with Vav from nontreated CD4+ cells (▴); the 6-TGDP-Rac1 adduct with Vav from CD4+ cells treated with 6-TG (♦); and the 6-TGDP-Rac1 adduct with Vav from CD4+ cells treated with both 6-TG and DETA/NO (●). The kinetic assay controls, the GDP-bound Rac1 without Vav (■) and the 6-TGDP-Rac1 adduct without Vav (×), were also conducted. Note that DTT (10 mm) was added to the assay cuvette containing the 6-TGDP-Rac1 adduct with Vav from CD4+ cells treated with 6-TG at time 300 s as indicated by an arrow. All fluorescence spectra were normalized against the spectrum of the GDP-bound Rac1 with Vav from 6-TG and DETA/NO treated CD4+ cells because it shows the highest fluorescence intensity at time 900 s.
FIGURE 7.
FIGURE 7.
6-TG with or without DETA/NO does not inhibit the activity of RhoA and Cdc42 of CD4+ cells. The RhoA and Cdc42 activities as well as the secretion of IFN-γ from CD4+ cells in each treatment were determined as described under “Experimental Procedures.” As positive controls, CD4+ cells treated with 6-TG and/or DETA/NO were also treated with C3 exotoxin (purified C3 transferase; the RhoA inhibitor; 30 μg/ml), and/or secramine B (the Cdc42 inhibitor; 20 μm) for 3 days. Total expression of RhoA and Cdc42 was determined by Western analyses using RhoA and Cdc42. The treatment of these inhibitors did not alter the expression level of total RhoA and Cdc42 (data not shown). The value of the activity of RhoA and Cdc42 as well as the quantity of IFN-γ determined from the untreated sample was set as 100%, and other results were then expressed as normalized values against the value associated with the untreated sample. Data are shown with the mean values and S.D. bars associated with the three independent experiments. Statistical results obtained by using the ANOVA Tukey test were as follows: *, p < 0.01, versus the RhoA activity of the untreated sample; **, p < 0.01, versus the Cdc42 activity of the untreated sample; and ***, p < 0.05, versus the quantity of IFN-γ secreted from the untreated sample.
FIGURE 8.
FIGURE 8.
6-TG blocks the DETA/NO-mediated T-cell stimulation. Fluorescence-based determination of CD4+ cell proliferations was performed as indicated under “Experimental Procedures.” The fluorescence value of the untreated sample was set as 1, and all other results were then expressed as normalized values against the untreated sample value initially established. Data are shown with the mean values and S.D. bars associated with the three independent experiments. The statistical ANOVA Tukey test results were as follows: *, p < 0.05, versus the result of the untreated sample; and **, p < 0.01, versus the result of the sample treated only with DETA/NO.
FIGURE 9.
FIGURE 9.
6-TG in combination with DETA/NO decreases viability and increases apoptosis of CD4+ cells. A, MTT-based CD4+ cell viability assays in each treatment were conducted as described under “Experimental Procedures.” The viability value of CD4+ cells of the untreated sample was set as 100%, and other results were then expressed as normalized values against the untreated sample value. Data are shown with the mean and S.D. bars associated with three independent experiments. Statistics were performed with a Tukey ANOVA. *, p < 0.05, versus the result of the untreated sample. B, colorimetric-based apoptotic assays of CD4+ cells in each treatment were performed as described under “Experimental Procedures.” The caspase activity of a sample treated with the apoptotic inducer was set as 100%, and other results were then expressed as normalized values against this value. Data are shown with the mean values and S.D. bars associated with the three independent experiments. Statistics were performed with a Tukey ANOVA: *, p < 0.01, versus the result of the untreated sample; and **, p < 0.05, versus the result of the apoptotic inducer-treated sample.
FIGURE 10.
FIGURE 10.
Chemistry-based molecular mechanism of the formation of the Rac1–6-TGNP disulfide adduct is proposed. 6-TGNP and a disulfide linkage are represented in blue and red, respectively. The dotted lines in black represent putative hydrogen bond interactions between protein residues and 6-TGNP. Red, reduction; and Ox, oxidation.
FIGURE 11.
FIGURE 11.
Cellular mechanism of 6-TP-mediated inactivation CD4+ cells.

Similar articles

Cited by

References

    1. Langmuir P. B., Aplenc R., and Lange B. J. (2001) Acute myeloid leukaemia in children. Best Pract. Res. Clin. Haematol. 14, 77–93 - PubMed
    1. Elion G. B. (1989) The purine path to chemotherapy. Science 244, 41–47 - PubMed
    1. Gearry R. B., and Barclay M. L. (2005) Azathioprine and 6-mercaptopurine pharmacogenetics and metabolite monitoring in inflammatory bowel disease. J. Gastroenterol. Hepatol. 20, 1149–1157 - PubMed
    1. McDonald E. R. 3rd., Wu G. S., Waldman T., and El-Deiry W. S. (1996) Repair defect in p21 WAF1/CIP1−/− human cancer cells. Cancer Res. 56, 2250–2255 - PubMed
    1. Tiede I., Fritz G., Strand S., Poppe D., Dvorsky R., Strand D., Lehr H. A., Wirtz S., Becker C., Atreya R., Mudter J., Hildner K., Bartsch B., Holtmann M., Blumberg R., et al. (2003) CD28-dependent Rac1 activation is the molecular target of azathioprine in primary human CD4+ T lymphocytes. J. Clin. Invest. 111, 1133–1145 - PMC - PubMed

Publication types

MeSH terms