. 2016 Jul;358(1):50-60.
doi: 10.1124/jpet.116.233213. Epub 2016 May 12.

Reactive Oxygen Species Differentially Regulate Bone Turnover in an Age-Specific Manner in Catalase Transgenic Female Mice

Affiliations

Reactive Oxygen Species Differentially Regulate Bone Turnover in an Age-Specific Manner in Catalase Transgenic Female Mice

Alexander W Alund et al. J Pharmacol Exp Ther. 2016 Jul.

Abstract

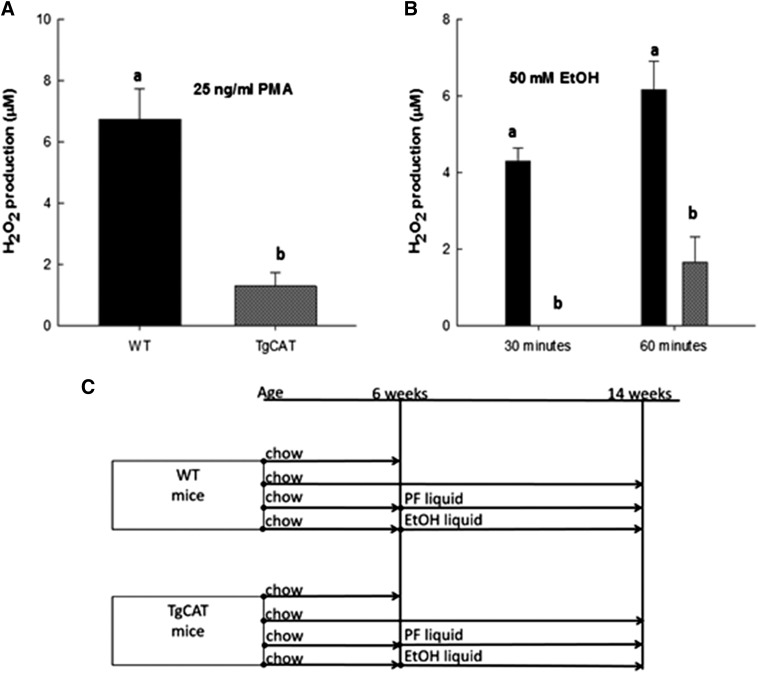
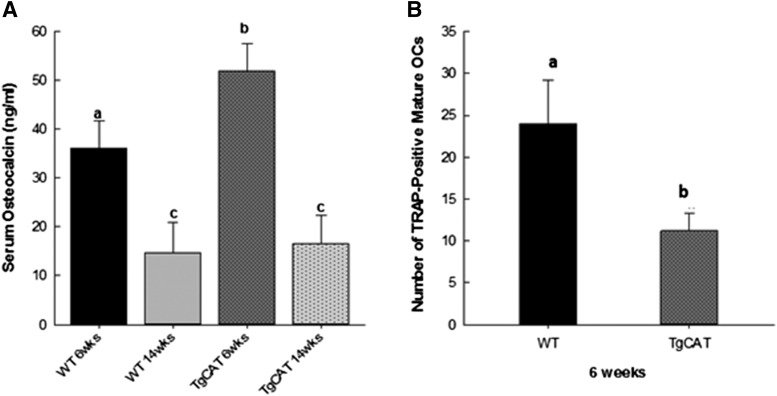
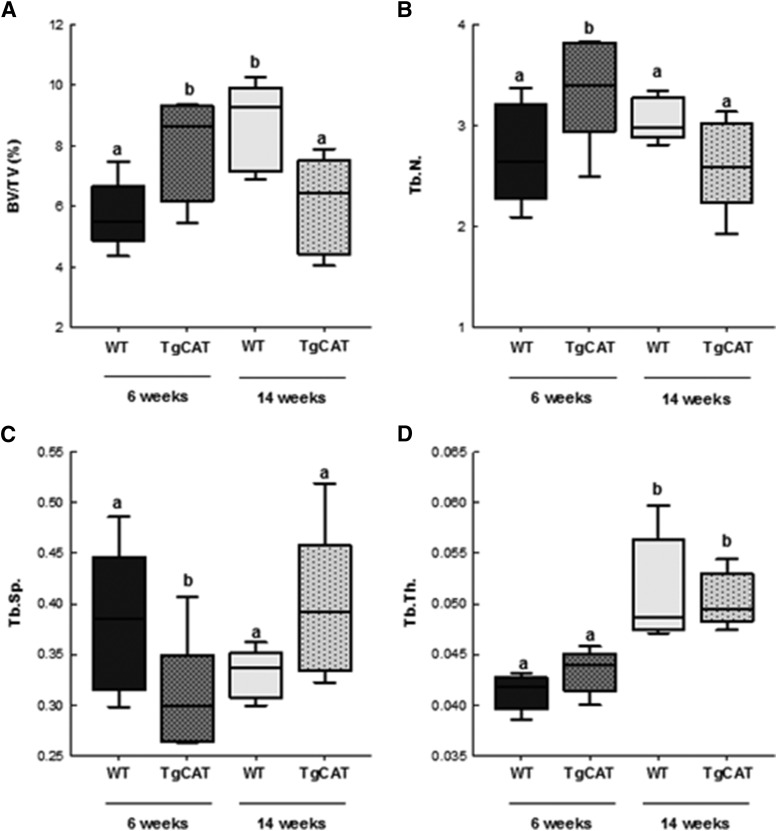
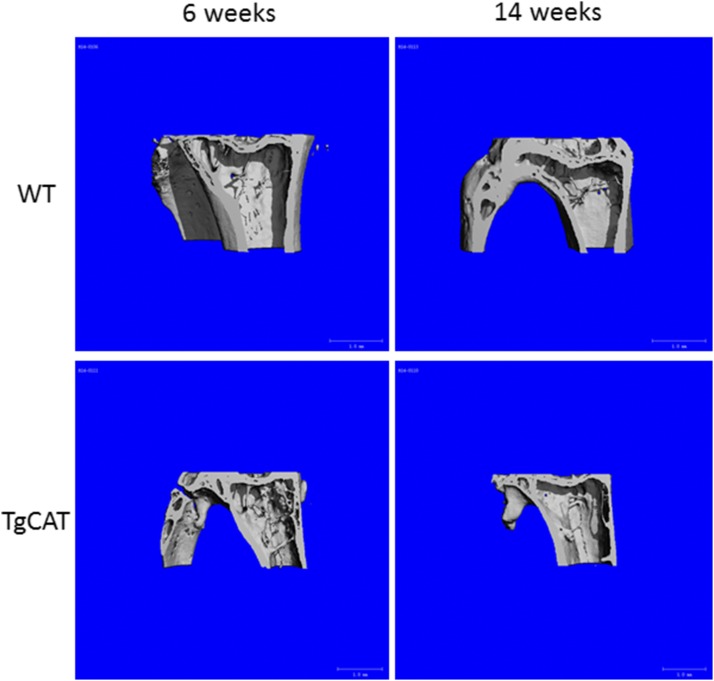
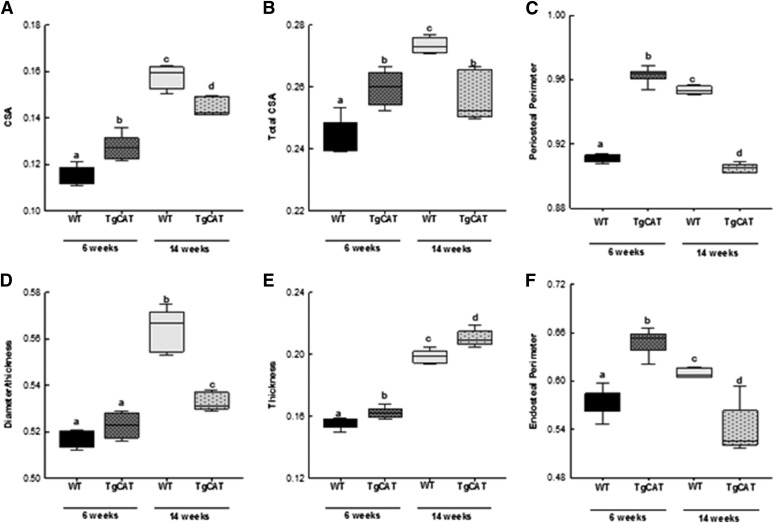
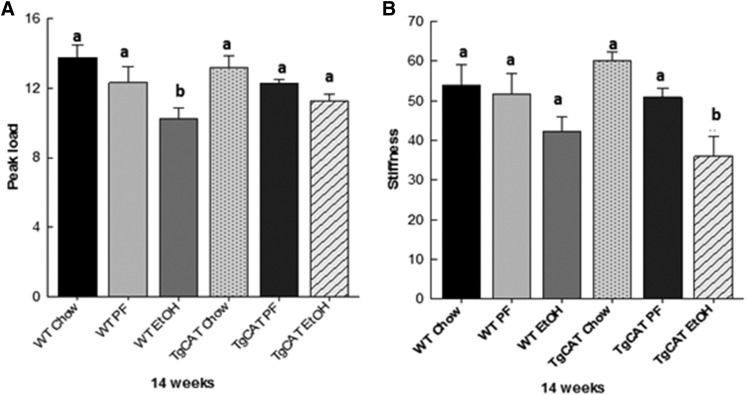
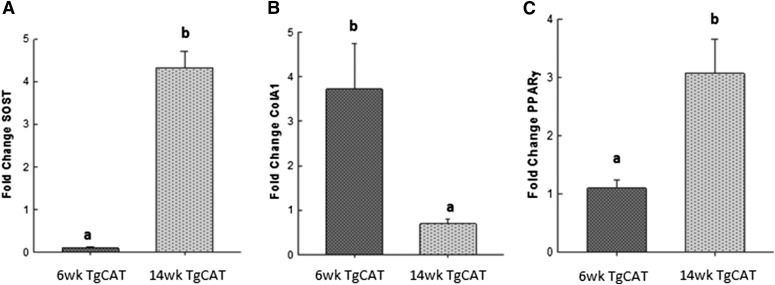
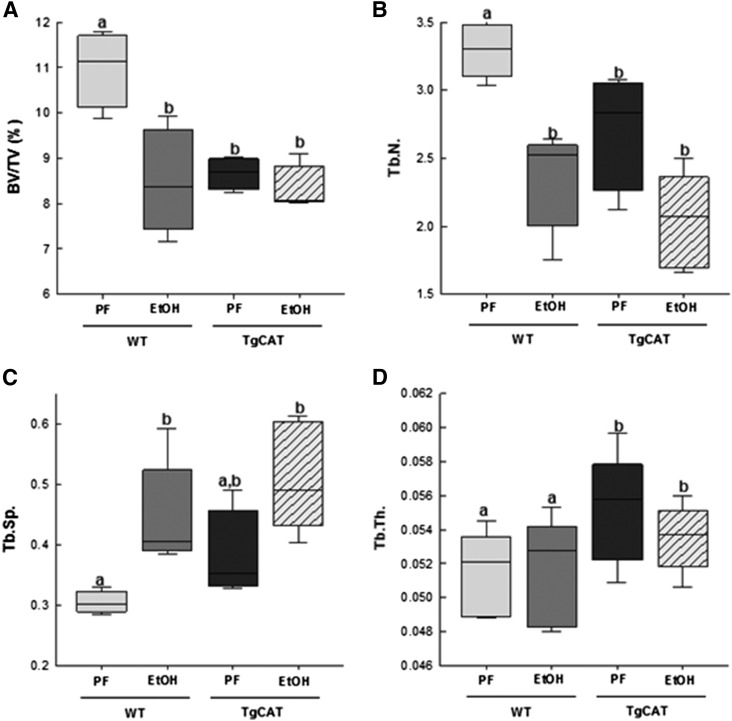
Chronic ethyl alcohol (EtOH) consumption results in reactive oxygen species (ROS) generation in bone and osteopenia due to increased bone resorption and reduced bone formation. In this study, transgenic C57Bl/6J mice overexpressing human catalase (TgCAT) were used to test whether limiting excess hydrogen peroxide would protect against EtOH-mediated bone loss. Micro-computed tomography analysis of the skeletons of 6-week-old female chow-fed TgCAT mice revealed a high bone mass phenotype with increased cortical bone area and thickness as well as significantly increased trabecular bone volume (P < 0.05). Six-week-old wild-type (WT) and TgCAT female mice were chow fed or pair fed (PF) liquid diets with or without EtOH, approximately 30% of calories, for 8 weeks. Pair feeding of WT had no demonstrable effect on the skeleton; however, EtOH feeding of WT mice significantly reduced cortical and trabecular bone parameters along with bone strength compared with PF controls (P < 0.05). In contrast, EtOH feeding of TgCAT mice had no effect on trabecular bone compared with PF controls. At 14 weeks of age, there was significantly less trabecular bone and cortical cross-sectional area in TgCAT mice than WT mice (P < 0.05), suggesting impaired normal bone accrual with age. TgCAT mice expressed less collagen1α and higher sclerostin mRNA (P < 0.05), suggesting decreased bone formation in TgCAT mice. In conclusion, catalase overexpression resulted in greater bone mass than in WT mice at 6 weeks and lower bone mass at 14 weeks. EtOH feeding induced significant reductions in bone architecture and strength in WT mice, but TgCAT mice were partially protected. These data implicate ROS signaling in the regulation of bone turnover in an age-dependent manner, and indicate that excess hydrogen peroxide generation contributes to alcohol-induced osteopenia.


Figures

Fig. 1.
Fig. 1.
Hydrogen peroxide measurements in primary bone cells after stimulation with 25 ng/ml PMA (A) and 50 mM EtOH (B). Statistical differences were determined by Student’s t test; values with different letter subscripts are statistically different from each other (P < 0.05). (C) Design of the feeding studies.
Fig. 2.
Fig. 2.
(A) Measurement of serum osteocalcin concentration from 6- and 14-week-old WT and TgCAT mice. Statistical significance was determined by one-way analysis of variance followed by Student-Newman-Keuls post hoc analysis; values with different letter subscripts are statistically different from each other (P < 0.05). (B) Total number of mature osteoclasts from WT and TgCAT bone marrow cells as identified by TRAP staining after culture in media containing 15 ng of RANKL and 20 nM 1,25(OH)2D3 for 10 days. Statistical differences were determined by Student’s t test; values with different letter subscripts are statistically different from each other (P < 0.05). OC, osteocalcin.
Fig. 3.
Fig. 3.
MicroCT analysis of tibial trabecular bone—BV/TV percentage (A), Tb.N (B), Tb.Sp (C), and Tb.Th (D)—in 6- and 14-week-old WT and TgCAT mice. Data are expressed with the center line indicating the mean and error bars as ± S.E.M. Statistical significance was determined by two-way analysis of variance followed by Student-Newman-Keuls post hoc analysis. Values with different letter subscripts are statistically different from each other (P < 0.05).
Fig. 4.
Fig. 4.
Representative three-dimensional reconstructed images from MicroCT scans of both 6- and 14-week-old WT and TgCAT mice.
Fig. 5.
Fig. 5.
MicroCt analysis of tibial cortical bone—cross-sectional area (A), total cross-sectional area (B), periosteal perimeter (C), diameter (D), thickness (E), and endosteal perimeter (F)—in 6- and 14-week-old WT and TgCAT mice. Data are expressed with the center line indicating the mean and error bars as ± S.E.M. Statistical significance was determined by two-way analysis of variance followed by Student-Newman-Keuls post hoc analysis. Values with different letter subscripts are statistically different from each other (P < 0.05).
Fig. 6.
Fig. 6.
Assessment of mechanical strength of the femur, peak load (A) and stiffness (B), for chow-fed, PF, and EtOH-fed WT mice and chow-fed, PF, and EtOH-fed TgCAT mice (n = 5/group). Data are expressed as the mean ± S.E.M. Statistical significance was determined by one-way analysis of variance followed by Student-Newman-Keuls post hoc analysis; values with different letter subscripts are statistically different from each other (P < 0.05).
Fig. 7.
Fig. 7.
Total mRNA was extracted from 6- and 14-week-old femurs of TgCAT mice, and expression of sclerostin (A), collagen 1 (B), and PPARγ (C) was compared. Statistical differences were determined by Student’s t test; values with different letter subscripts are statistically different from each other (P < 0.05). SOST, Sclerostin.
Fig. 8.
Fig. 8.
MicroCT analysis of tibial trabecular bone—BV/TV percentage (A), Tb.N (B), Tb.Sp (C), and Tb.Th (D)—in WT PF mice, WT EtOH-fed mice, TgCAT PF, and TgCAT EtOH-fed mice. Data are expressed with the center line indicating the mean and error bars as ± S.E.M. Statistical significance was determined by two-way analysis of variance followed by Student-Newman-Keuls post hoc analysis. Values with different letter subscripts are statistically different from each other (P < 0.05).

References

    1. Almeida M, Ambrogini E, Han L, Manolagas SC, Jilka RL. (2009) Increased lipid oxidation causes oxidative stress, increased peroxisome proliferator-activated receptor-gamma expression, and diminished pro-osteogenic Wnt signaling in the skeleton. J Biol Chem 284:27438–27448. - PMC - PubMed
    1. Almeida M, Han L, Martin-Millan M, O’Brien CA, Manolagas SC. (2007) Oxidative stress antagonizes Wnt signaling in osteoblast precursors by diverting beta-catenin from T cell factor- to forkhead box O-mediated transcription. J Biol Chem 282:27298–27305. - PubMed
    1. Almeida M, O’Brien CA. (2013) Basic biology of skeletal aging: role of stress response pathways. J Gerontol A Biol Sci Med Sci 68:1197–1208. - PMC - PubMed
    1. Atashi F, Modarressi A, Pepper MS. (2015) The role of reactive oxygen species in mesenchymal stem cell adipogenic and osteogenic differentiation: a review. Stem Cells Dev 24:1150–1163. - PMC - PubMed
    1. Badger TM, Ronis MJ, Lumpkin CK, Valentine CR, Shahare M, Irby D, Huang J, Mercado C, Thomas P, Ingelman-Sundberg M, et al. (1993) Effects of chronic ethanol on growth hormone secretion and hepatic cytochrome P450 isozymes of the rat. J Pharmacol Exp Ther 264:438–447. - PubMed

Publication types

MeSH terms