. 2016 May 22;8(5):1411-26.
doi: 10.1093/gbe/evw086.

Capturing the Phylogeny of Holometabola with Mitochondrial Genome Data and Bayesian Site-Heterogeneous Mixture Models

Affiliations

Capturing the Phylogeny of Holometabola with Mitochondrial Genome Data and Bayesian Site-Heterogeneous Mixture Models

Fan Song et al. Genome Biol Evol. .

Abstract

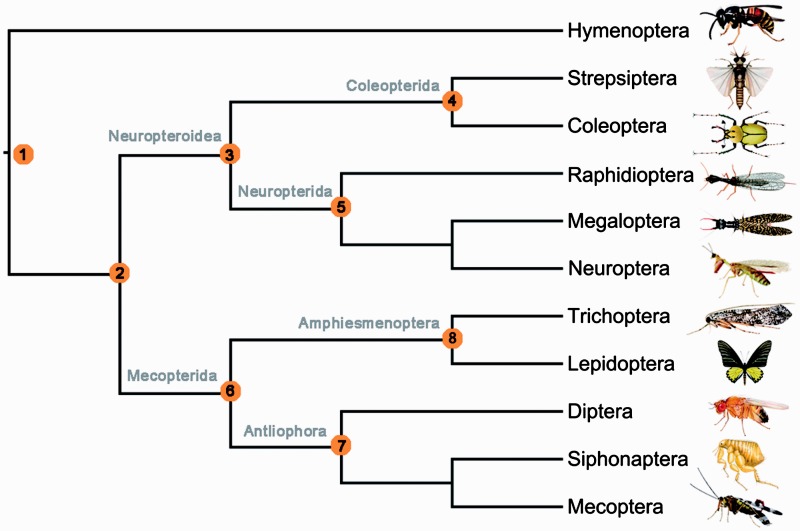
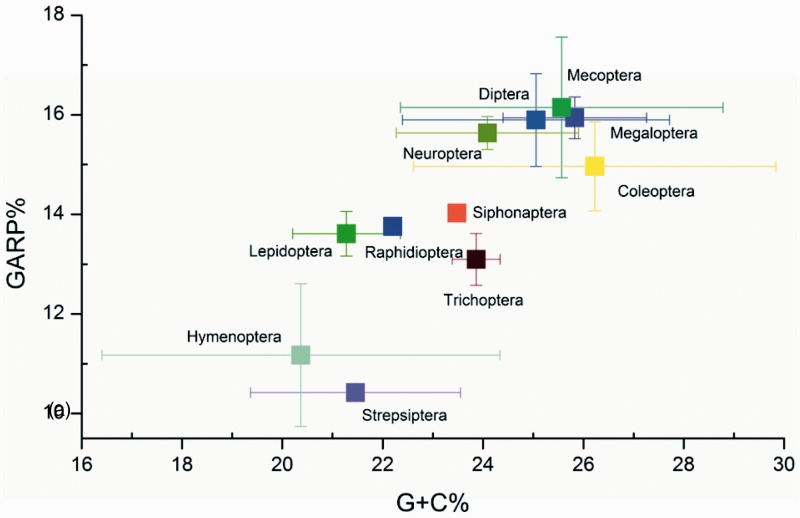
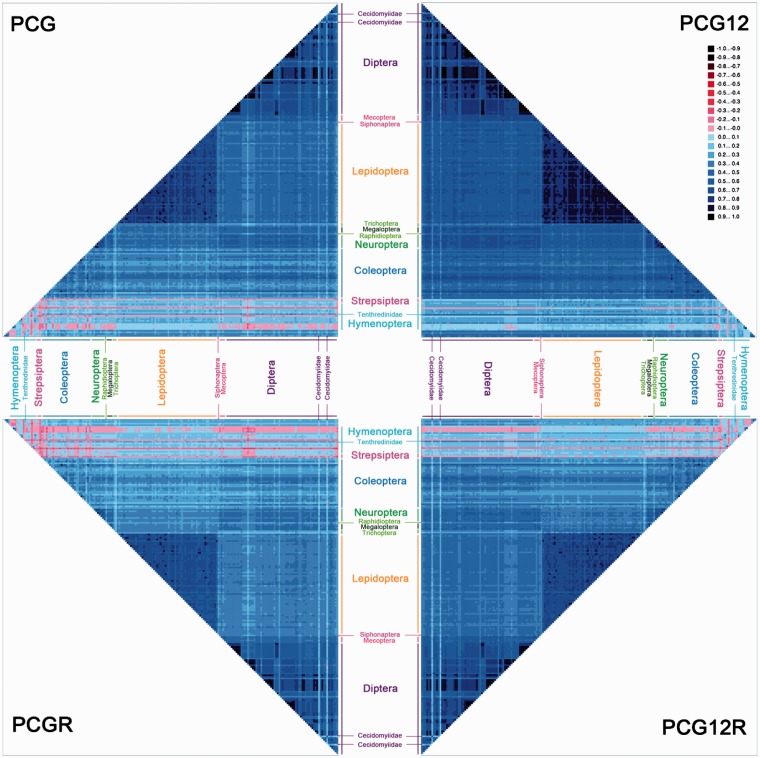
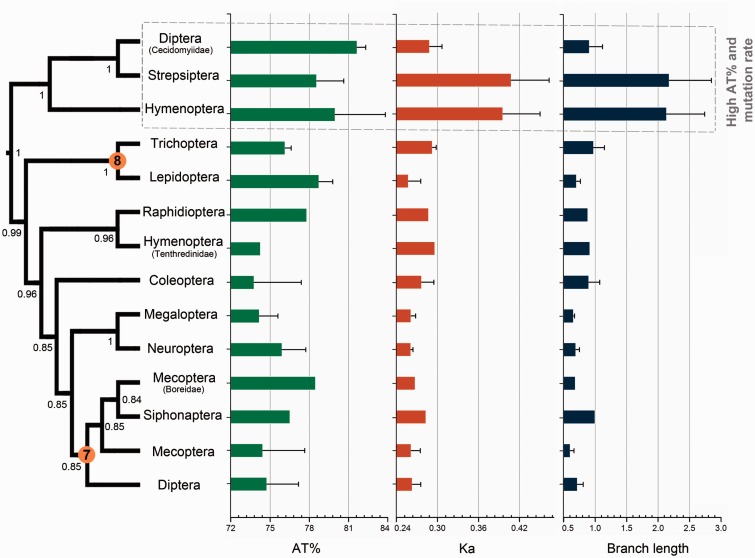
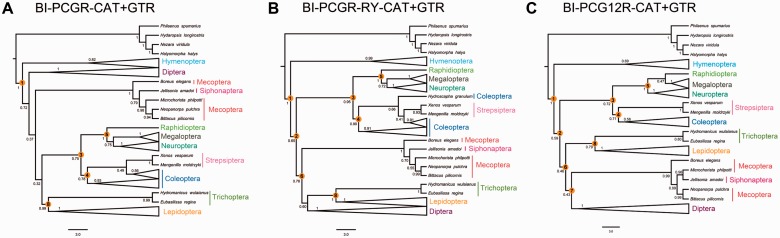
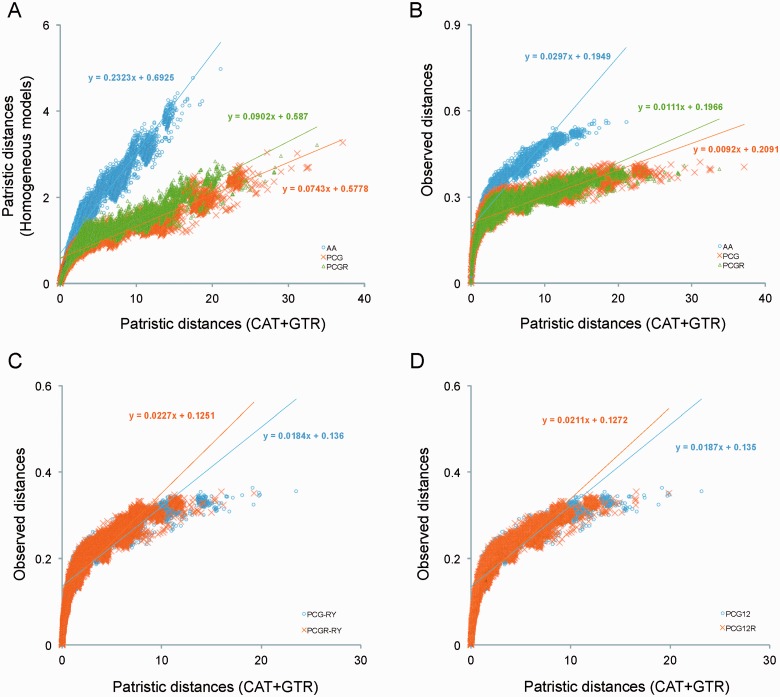
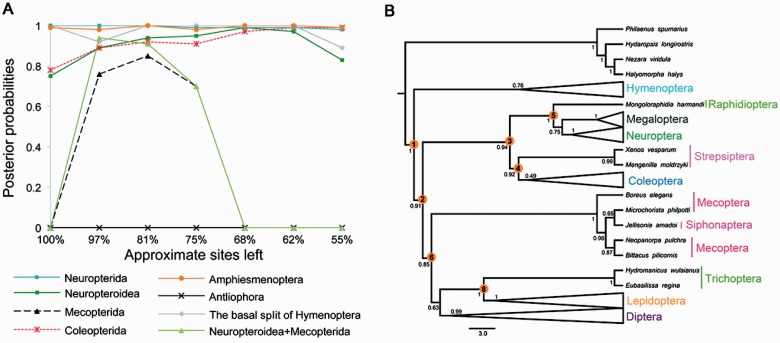
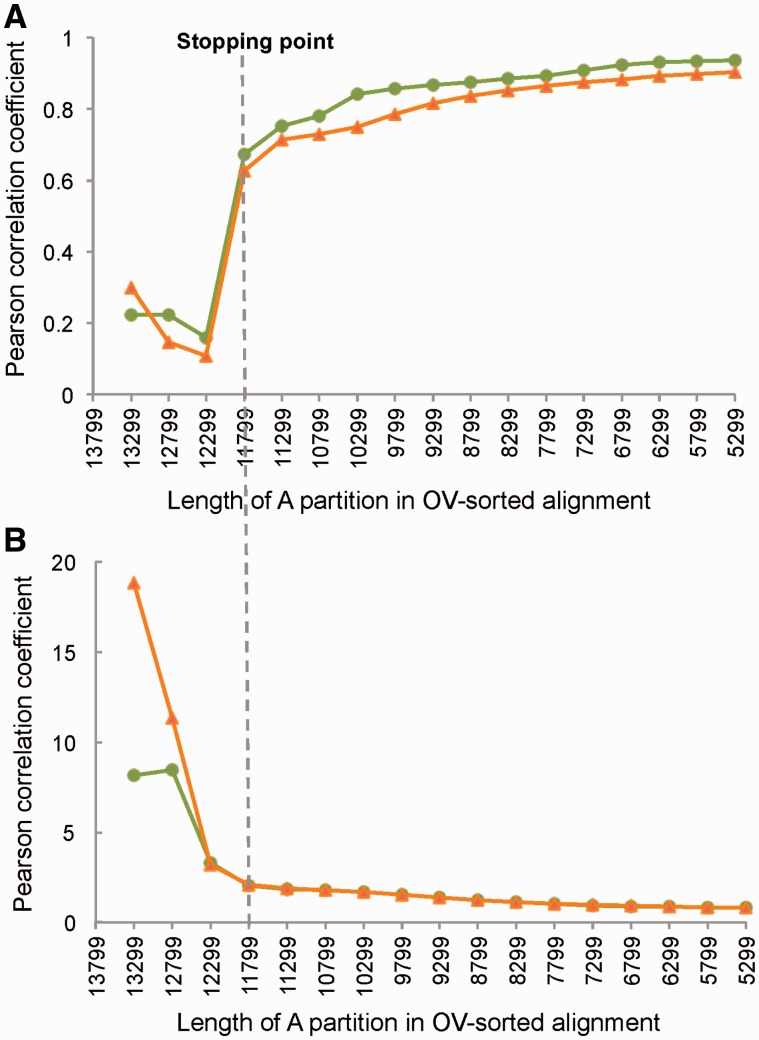
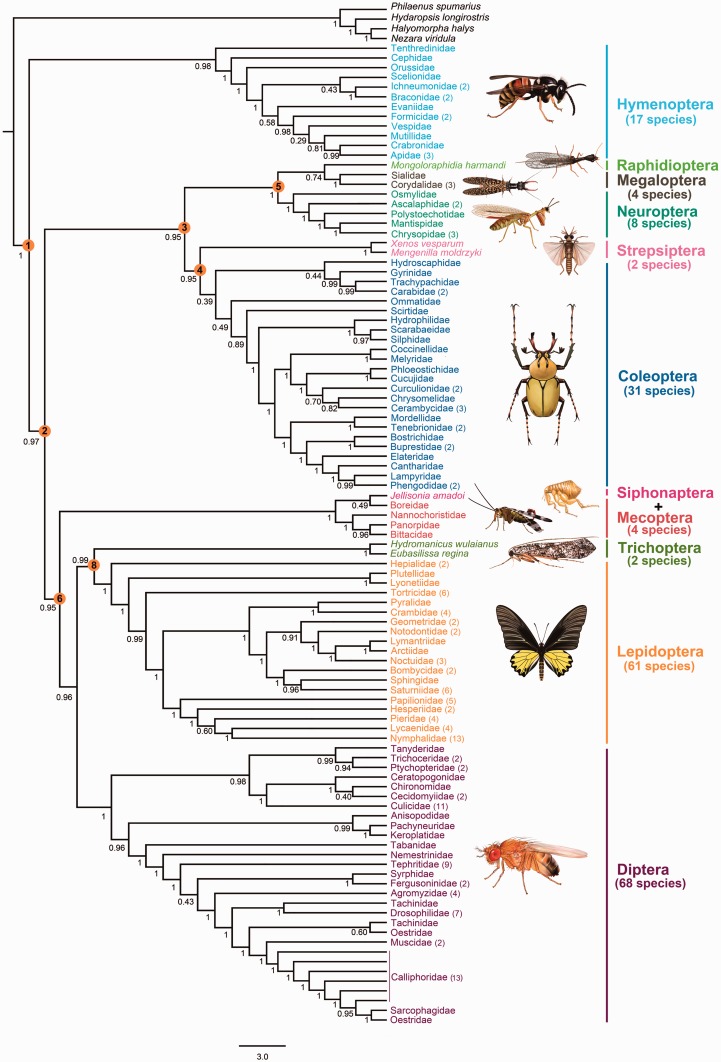
After decades of debate, a mostly satisfactory resolution of relationships among the 11 recognized holometabolan orders of insects has been reached based on nuclear genes, resolving one of the most substantial branches of the tree-of-life, but the relationships are still not well established with mitochondrial genome data. The main reasons have been the absence of sufficient data in several orders and lack of appropriate phylogenetic methods that avoid the systematic errors from compositional and mutational biases in insect mitochondrial genomes. In this study, we assembled the richest taxon sampling of Holometabola to date (199 species in 11 orders), and analyzed both nucleotide and amino acid data sets using several methods. We find the standard Bayesian inference and maximum-likelihood analyses were strongly affected by systematic biases, but the site-heterogeneous mixture model implemented in PhyloBayes avoided the false grouping of unrelated taxa exhibiting similar base composition and accelerated evolutionary rate. The inclusion of rRNA genes and removal of fast-evolving sites with the observed variability sorting method for identifying sites deviating from the mean rates improved the phylogenetic inferences under a site-heterogeneous model, correctly recovering most deep branches of the Holometabola phylogeny. We suggest that the use of mitochondrial genome data for resolving deep phylogenetic relationships requires an assessment of the potential impact of substitutional saturation and compositional biases through data deletion strategies and by using site-heterogeneous mixture models. Our study suggests a practical approach for how to use densely sampled mitochondrial genome data in phylogenetic analyses.

Keywords: Holometabola phylogeny; PhyloBayes; compositional bias; mitochondrial phylogenomics; rate variation; tree-of-life.


Figures

F<sc>ig</sc>. 1.—
Fig. 1.—
Current view of higher level relationships of Holometabola. This tree represents the best recent estimate of holometabolan insect relationships based on nuclear genes (Wiegmann et al. 2009; Misof et al. 2014; Peters et al. 2014). Eight nodes were selected to assess the quality of trees under the different methodological strategies. These uncontroversial relationships are labeled by orange circles with number: 1, the basal split of Hymenoptera from all others; 2, Neuropteroidea + Mecopterida; 3, Neuropteroidea; 4, Coleopterida; 5, Neuropterida; 6, Mecopterida; 7, Antliophora; 8, Amphiesmenoptera.
F<sc>ig</sc>. 2.—
Fig. 2.—
Compositional properties of holometabolan mitochondrial protein-coding genes. The G + C content of the concatenated alignment is plotted against the percentage of amino acids encoded by G- and C-rich codons (GARP). Values are averaged for orders, with standard deviations indicated.
F<sc>ig</sc>. 3.—
Fig. 3.—
AliGROOVE analysis for four data sets. The mean similarity score between sequences is represented by a colored square, based on AliGROOVE scores from −1, indicating great difference in rates from the remainder of the data set, that is, heterogeneity (red coloring), to +1, indicating that rates match all other comparisons (blue coloring).
F<sc>ig</sc>. 4.—
Fig. 4.—
Systematic errors in the standard phylogenetic analyses under site-homogeneous model. The tree is obtained by Bayesian analysis of nucleotide sequences of protein-coding genes (BI-PCG) under site-homogeneous models. Orange circles with number indicate recovered uncontroversial relationships in figure 1. The unexpected clade caused by accelerated substitution rates and compositional heterogeneity of holometabolan mitochondrial genomes is highlighted by a dotted line box. Error bars represent standard deviations from data of multiple species.
F<sc>ig</sc>. 5.—
Fig. 5.—
Holometabolan phylogenies inferred from the combined protein-coding genes and rRNA gens using PhyloBayes with the CAT + GTR model. (A) Bayesian tree from the data set PCGR under the CAT + GTR model. (B) Bayesian tree from the data set PCGR-RY under the CAT + GTR model. (C) Bayesian tree from the data set PCG12R under the CAT + GTR model. We show a schematic version of the Bayesian trees with some lineages collapsed for clarity. Supports at nodes are Bayesian posterior probabilities. Orange circles with number indicate recovered uncontroversial relationships in figure 1.
F<sc>ig</sc>. 6.—
Fig. 6.—
Model-based saturation plots for the amino acid and nucleotide data sets. (A) Plots of the patristic distances of all data (AA, PCG, and PCGR) estimated from the CAT + GTR tree compared with the distances from the “site-homogeneous” MtArt and GTR-based models. Plots of the observed distances (uncorrected P-distances) against distance estimated from the CAT + GTR tree, using (B) all data, (C) all data after RY coding, and (D) first and second positions only.
F<sc>ig</sc>. 7.—
Fig. 7.—
Slow-fast analyses of the nucleotide data set of the combined protein-coding genes and rRNA genes. (A) Posterior probabilities using Bayesian CAT + GTR model for various sub-data sets deprived of classes of fast-evolving sites in the data set PCGR (as indicated by the amount of sites left in the data sets). Eight uncontroversial relationships in figure 1 (orange circles) are selected as indicators to test the phylogenetic signals in the data sets. (B) Holometabolan phylogeny inferred from the data set PCGR with approximately 19% fastest evolving sites excluded using PhyloBayes under the CAT + GTR model. We show a schematic version of the Bayesian trees with some lineages collapsed for clarity.
F<sc>ig</sc>. 8.—
Fig. 8.—
Results of OV analysis. (A) Plot showing results of Pearson correlation analyses. The green dotted line indicates the Pearson correlation coefficients (r) of ML distances for A partitions (the more conserved) and B partitions (less conserved). The orange dotted line represents r value of uncorrected p-distances and ML distances for B partitions. The r values begin to increase sharply at the forth OV-shortening step of the PCGR data set (11,799 position remained). (B) Plot showing mean deviations between ML and p distances for B partitions. In calculating ML distances, the best-fitting ML model for each partition was first determined under the AIC using ModelTest (Posada and Crandall 1998). The orange dotted line indicates results from analyses using a neighbor-joining tree to fit ML model parameters. The green dotted line indicates results obtained when an ML tree is used to fit substitution model parameters.
F<sc>ig</sc>. 9.—
Fig. 9.—
Holometabolan phylogenies inferred from the OV-sorted PCGR data set using PhyloBayes with the CAT + GTR model. The OV-sorted PCGR data set (11,799 bp) was selected by the GNB criterion (fig. 8). We show a schematic version of the Bayesian trees with some lineages collapsed for clarity and the full tree with branch lengths can be inspected in supplementary figure S9, Supplementary Material online. Bracket with number indicates the number of sampled species in a family. Supports at nodes are Bayesian posterior probabilities. Orange circles with number indicate recovered uncontroversial relationships in figure 1.

Similar articles

Cited by

References

    1. Abascal F, Posada D, Zardoya R. 2007. MtArt: a new model of amino acid replacement for Arthropoda. Mol Biol Evol. 24:1–5. - PubMed
    1. Abascal F, Zardoya R, Telford MJ. 2010. TranslatorX: multiple alignment of nucleotide sequences guided by amino acid translations. Nucleic Acids Res. 38:W7–W13. - PMC - PubMed
    1. Baurain D, Brinkmann H, Philippe H. 2007. Lack of resolution in the animal phylogeny: closely spaced cladogeneses or undetected systematic errors? Mol Biol Evol. 24:6–9. - PubMed
    1. Bergsten J. 2005. A review of long-branch attraction. Cladistics 21:163–193. - PubMed
    1. Bernt M, et al. 2013. A comprehensive analysis of bilaterian mitochondrial genomes and phylogeny. Mol Phylogenet Evol. 69:252–364. - PubMed

Associated data