. 2016 Jul;139(Pt 7):1971-86.
doi: 10.1093/brain/aww119. Epub 2016 May 17.

Migraine photophobia originating in cone-driven retinal pathways

Affiliations

Migraine photophobia originating in cone-driven retinal pathways

Rodrigo Noseda et al. Brain. 2016 Jul.

Abstract

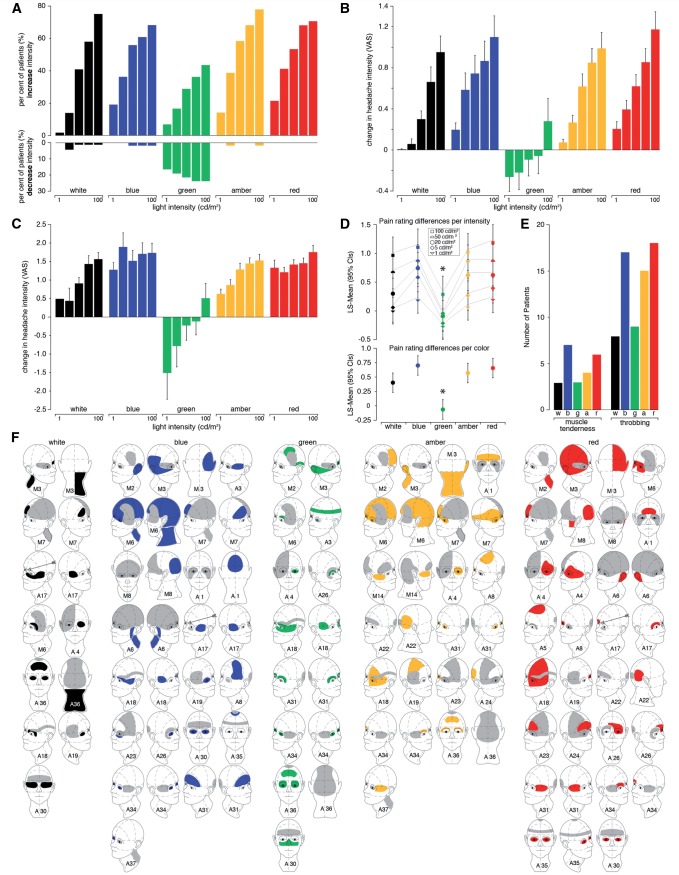
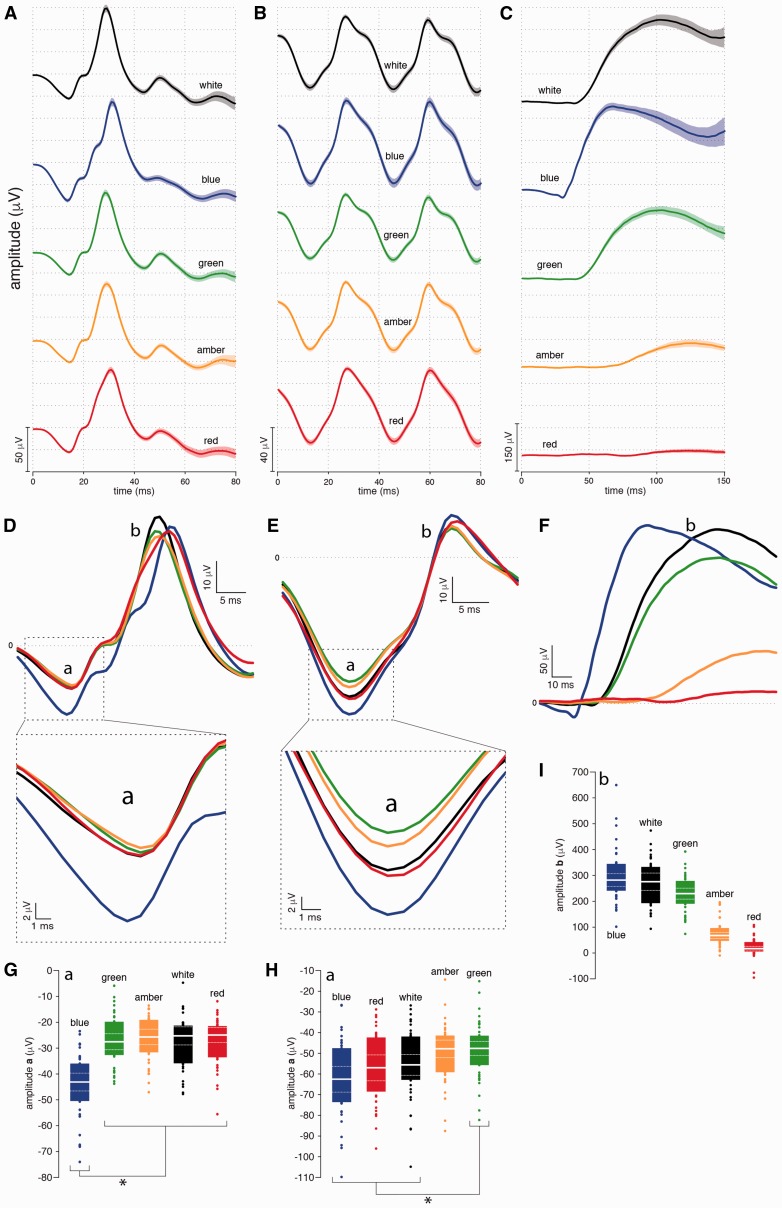
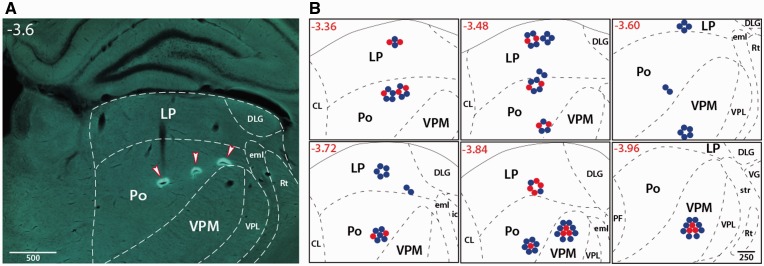
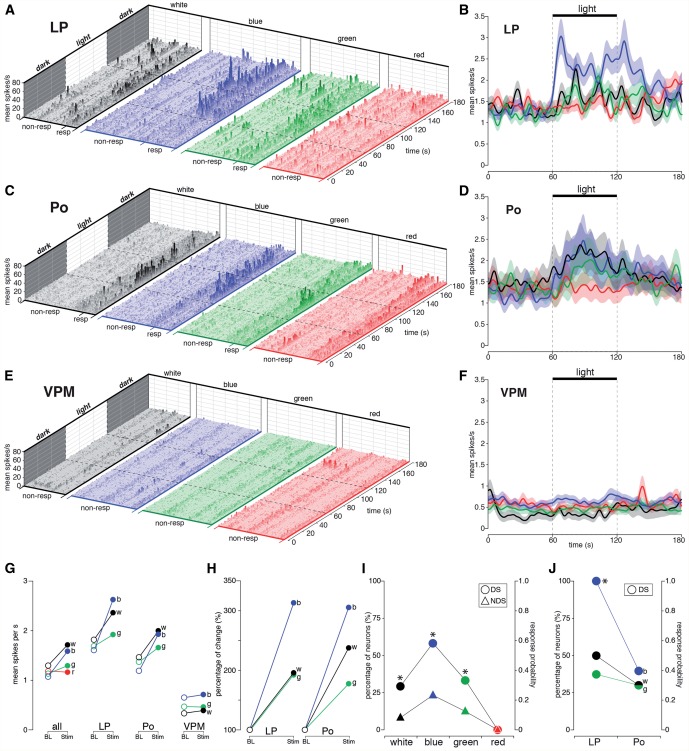
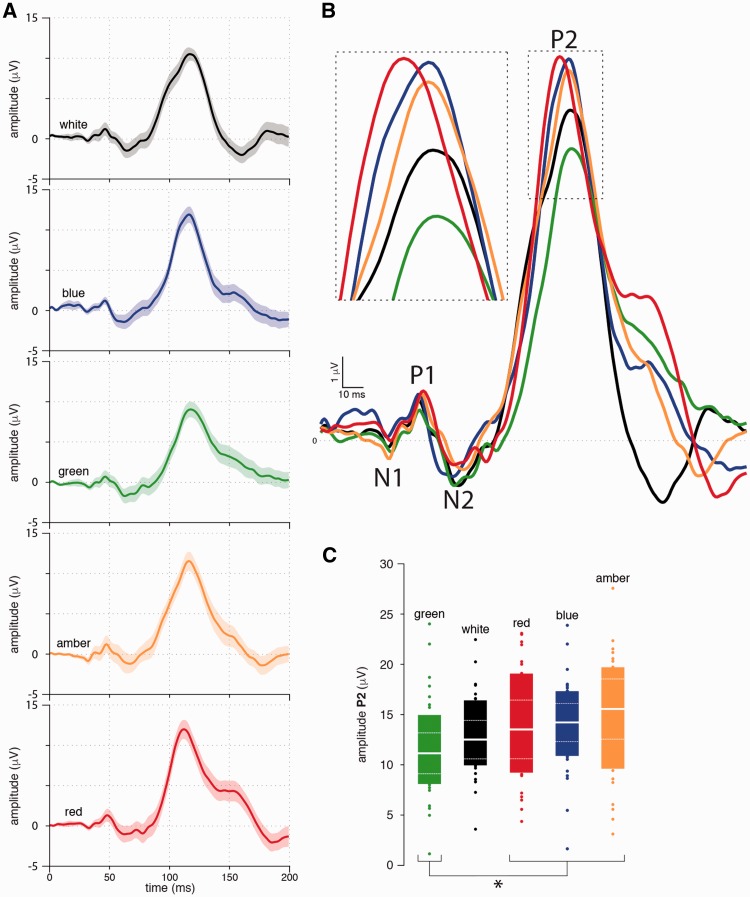
Migraine headache is uniquely exacerbated by light. Using psychophysical assessments in patients with normal eyesight we found that green light exacerbates migraine headache significantly less than white, blue, amber or red lights. To delineate mechanisms, we used electroretinography and visual evoked potential recording in patients, and multi-unit recording of dura- and light-sensitive thalamic neurons in rats to show that green activates cone-driven retinal pathways to a lesser extent than white, blue and red; that thalamic neurons are most responsive to blue and least responsive to green; and that cortical responses to green are significantly smaller than those generated by blue, amber and red lights. These findings suggest that patients' experience with colour and migraine photophobia could originate in cone-driven retinal pathways, fine-tuned in relay thalamic neurons outside the main visual pathway, and preserved by the cortex. Additionally, the findings provide substrate for the soothing effects of green light.

Keywords: electroretinography; headache; pain; thalamus; visual evoked potential.


Figures

None
Migraine headache is commonly exacerbated by light (photophobia). Noseda, Burstein et al . show that green light alleviates the headache whereas blue, amber and red lights exacerbate it. Using electroretinography and visual evoked potentials in migraineurs and multi-electrode recordings in rats, they provide evidence that this colour-selective photophobia originates in cone-driven retinal pathways.
Figure 1
Figure 1
Effects of colour on pain ratings, throbbing, muscle tenderness and headache location. ( A ) Proportion of patients experiencing an increase or decrease in pain intensity when exposed to white, blue (447 ± 10 nm), green (530 ± 10 nm), amber (590 ± 10 nm) and red (627 ± 10 nm) lights; each presented for 30 s at low (1 and 5 cd·m −2 ) and medium (20, 50 and 100 cd·m −2 ) intensities. ( B ) Numerical change in headache intensity (mean ± SEM) reported by all patients in response to each colour and intensity (VAS = verbal analogue scale). ( C ) Bar graphs showing only those trials in which lights altered pain perception. Note that all colours but green increased pain ratings by a maximum of 15–20% (0–10 VAS), whereas green—the only colour to decrease pain ratings—attenuated the pain by a maximum of 15%. ( D ) Pain rating differences (from baseline) grew larger with increasing stimulus intensity, such that differences in response to green light were significantly smaller as compared to all other colours at all intensities ( top , mean ± 95% CI). Analysed regardless of stimulus intensity (colour-intensity interaction was statistically insignificant), all colours but green demonstrated a significant increase in pain ratings compared to baseline ( bottom , P < 0.0001 for each colour). ( E ) Number of patients who experienced muscle tenderness and throbbing during exposure to light compared to no such perception at baseline. ( F ) Effect of colours on spread of headache from its original location (grey areas). Cases in which the headache affected both sides of the head or the front and the back are illustrated in two images. Numbers represent individual patients. Arrows indicate directionality of the pain. w = white; b = blue; g = green; a = amber; r = red.
Figure 2
Figure 2
Chromatic electroretinographies (ERGs) recorded interictally in 43 migraine patients. ( A ) Standard light-adapted single flash ERG waveforms averaged (± SEM) across patients in response to 387 flashes (nine flashes per patient) of each colour of light. ( B ) Standard light-adapted 30 Hz flickering ERG waveforms averaged (± SEM) across patients in response to each colour of light. ( C ) Standard dark-adapted rod ERG waveforms averaged (± SEM) across patients in response to each colour of light. ( D ) Superimposed means of light-adapted single flash ERG waveforms demonstrated that blue light generated significantly larger a-wave amplitude (enlarged view at bottom ) as compared to all other colours ( P < 0.0001). ( E ) Superimposed means of light-adapted 30 Hz flickering ERG waveforms show that blue, red and white lights generated significantly larger a-wave amplitudes as compared to green light ( P < 0.0001). ( F ) Superimposed means of dark-adapted rod ERG waveforms show that the b-wave amplitudes generated by blue, white and green lights are significantly larger than those induced by amber and red. ( G ) Boxplot illustrating median (thick horizontal white line), 95% CI (thin dotted horizontal lines), interquartile range (25th–75th percentile; lower and upper box boundaries) and observations below and above the 25th and 75th percentile, respectively (individual dots). Asterisk depicts the significantly greater a-wave amplitude induced by the blue light compared to all other colours. ( H ) Boxplot illustrating median, 95% CI, interquartile range, and observations below and above the 25th and 75th percentile, respectively. Asterisks depict the significantly greater a-wave amplitude induced by blue, red and white lights compared to green. ( I ) Boxplot illustrating median, 95% CI, 25th to 75th percentile, and observations below and above 25th and 75th percentiles.
Figure 3
Figure 3
Recording sites of thalamic dura-sensitive and dura-insensitive neurons . ( A ) Lesions marking locations of three tetrodes used in one multi-unit, multi-site recording session. ( B ) Recordings were obtained simultaneously from dura-sensitive (red dots) and dura-insensitive (blue dots) neurons in the thalamic LP, Po and VPM nuclei. The number of dots surrounding each site depicts the number of single units isolated at that site. Numbers in upper left corners depict distance from bregma. CL = centrolateral thalamic nucleus; DLG = dorsolateral geniculate nucleus; eml = external medullary lamina; ic =internal capsule ; Rt = reticular thalamic nucleus; str = stria terminalis; VG = ventral geniculate nucleus; VPL = ventroposterior lateral thalamic nucleus.
Figure 4
Figure 4
Differential responses of thalamic LP, Po and VPM neurons to photic stimulation with white, blue, green and red lights. ( A ) 3D bar graphs illustrating firing frequency (i.e. raw data expressed in mean spikes/s, bin size = 1 s) of all 33 LP neurons to 44, 76, 58 and 50 cycles (dark-light-dark, 1-min each) of photic stimulation with white, blue, green and red lights, respectively. Neurons whose activity in the light increased by >2 SD over baseline (i.e. in the dark), are marked as responders (resp) and shown on the right side of each collections of colour-selective bar graphs. ( B ) Graphs illustrating averaged responses (continuous line) ± SEM (shadowed area) of all 33 LP neurons to stimulation of the retina with white, blue, green and red lights. ( C ) 3D bar graphs illustrating firing frequency of all 37 Po neurons to 59, 58, 59, and 57 cycles of retinal stimulation with white, blue, green and red lights, respectively. ( D ) Graphs illustrating averaged responses (± SEM) of all 37 Po neurons to stimulation of the retina with white, blue, green and red lights. ( E ) 3D bar graphs illustrating lack of responses of the 27 VPM neurons to 35, 54, 58 and 55 cycles of retinal stimulation with white, blue, green and red lights, respectively. ( F ) Graphs illustrating averaged firing (± SEM) recorded in all 27 VPM neurons before, during and after stimulation of the retina with white, blue, green and red lights. Dotted lines in AF depict onset and offset of photic stimulation. ( G ) Scatter plots summarizing response magnitude (mean spikes/s) of all neurons, and of neurons located in LP, Po and VPM, to photic stimulation with white, blue, green and red lights. BL = baseline firing in the dark; St = firing during light stimuli. ( H ) Per cent change in firing frequency of all light-sensitive LP and Po neurons responding to blue, white and green lights. ( I ) Logistic regression analysis showing that compared to dura-insensitive neurons, dura-sensitive neurons are two to three times more likely (response probability) to respond to the different colours of light. ( J ) Exact logistic regression demonstrating that the probability of responses of dura-sensitive neurons to blue light is twice as high in LP as compared to Po. Within LP, the probability of response to blue light was twice as high as those recorded in response to white and green lights. Asterisks in I and J depict statistically significant ( P < 0.05) differences between dura-sensitive and dura-insensitive neurons ( I ) and between responses to blue versus responses to white and green ( J ). w = white; b = blue; g = green; r = red.
Figure 5
Figure 5
Chromatic VEPs recorded interictally in 28 migraine patients. ( A ) Standard flash visual evoked potential waveforms averaged (± SEM) across patients in response to 1792 flashes (64 flashes per patient, 1 s interstimulus interval) of each colour of light. The VEPs to flash stimulation consists of a series of negative and positive waves, the most robust of which are the N2 and P2 peaks. ( B ) Superimposed means of these flash VEPs demonstrated that blue, red and amber generated significantly larger P2 amplitude (enlarged view in inset) as compared to green ( P < 0.02). In contrast, no differences were found in the amplitudes of the N2 waves. ( C ) Boxplot illustrating median (thick horizontal white line), 95% CI (thin dotted horizontal lines), interquartile range (25th–75th percentile; lower and upper box boundaries) and observations below and above the 25th and 75th percentile, respectively (individual dots). Asterisk depicts the significantly smaller P2-wave amplitude induced by the green light compared to red, blue and amber.

Comment in

Similar articles

Cited by

References

    1. Abd-El-Barr MM, Pennesi ME, Saszik SM, Barrow AJ, Lem J, Bramblett DE, et al. . Genetic dissection of rod and cone pathways in the dark-adapted mouse retina . J Neurophysiol 2009. ; 102 : 1945 – 55 . - PMC - PubMed
    1. Adams WH, Digre KB, Patel BC, Anderson RL, Warner JE, Katz BJ . The evaluation of light sensitivity in benign essential blepharospasm . Am J Ophthalmol 2006. ; 142 : 82 – 7 . - PubMed
    1. American Encephalographic Society: Guideline for standard electrode position nomenclature . J Clin Neurophysiol 1994. ; 11 ( Guideline 13 ): 111 – 3 . - PubMed
    1. Aurora SK, Cao Y, Bowyer SM, Welch KM . The occipital cortex is hyperexcitable in migraine: experimental evidence . Headache 1999. ; 39 : 469 – 76 . - PubMed
    1. Berson DM, Dunn FA, Takao M . Phototransduction by retinal ganglion cells that set the circadian clock . Science 2002. ; 295 : 1070 – 3 . - PubMed

Publication types

MeSH terms