

Enhanced Genetic Characterization of Influenza A(H3N2) Viruses and Vaccine Effectiveness by Genetic Group, 2014-2015
- PMID: 27190176
- PMCID: PMC5812259
- DOI: 10.1093/infdis/jiw181
Enhanced Genetic Characterization of Influenza A(H3N2) Viruses and Vaccine Effectiveness by Genetic Group, 2014-2015
Erratum in
-
Erratum.J Infect Dis. 2017 Jun 1;215(11):1774. doi: 10.1093/infdis/jix220. J Infect Dis. 2017. PMID: 28863447 Free PMC article. No abstract available.
Abstract
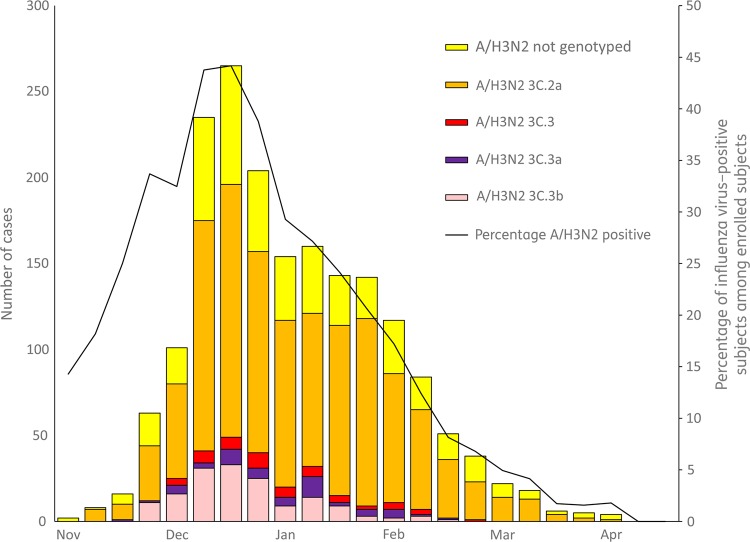
Background: During the 2014-2015 US influenza season, expanded genetic characterization of circulating influenza A(H3N2) viruses was used to assess the impact of the genetic variability of influenza A(H3N2) viruses on influenza vaccine effectiveness (VE).
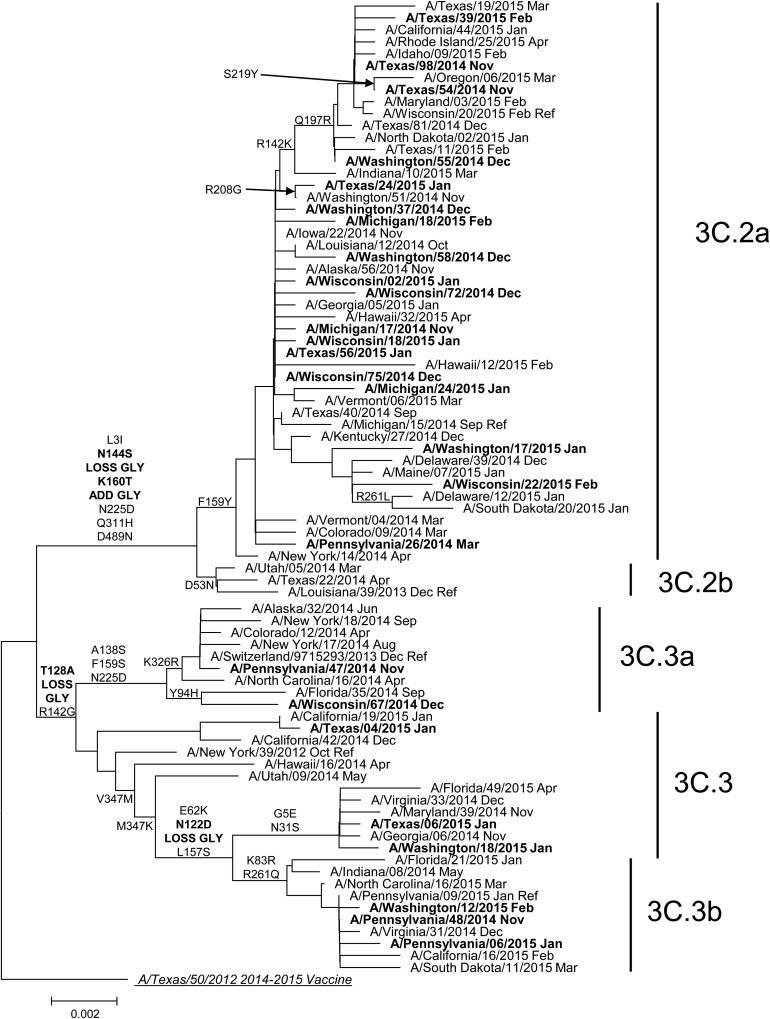
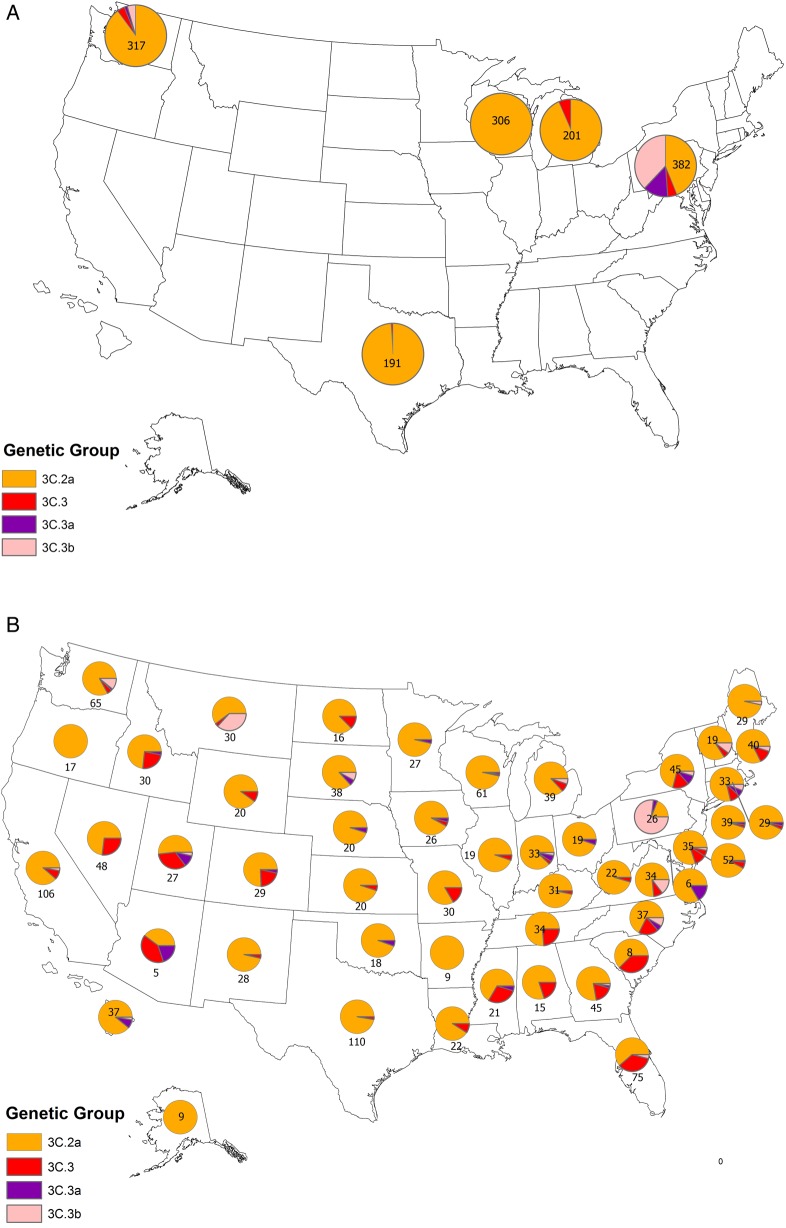
Methods: A novel pyrosequencing assay was used to determine genetic group, based on hemagglutinin (HA) gene sequences, of influenza A(H3N2) viruses from patients enrolled at US Influenza Vaccine Effectiveness Network sites. VE was estimated using a test-negative design comparing vaccination among patients infected with influenza A(H3N2) viruses and uninfected patients.
Results: Among 9710 enrollees, 1868 (19%) tested positive for influenza A(H3N2) virus; genetic characterization of 1397 viruses showed that 1134 (81%) belonged to 1 HA genetic group (3C.2a) of antigenically drifted influenza A(H3N2) viruses. Effectiveness of 2014-2015 influenza vaccination varied by influenza A(H3N2) virus genetic group from 1% (95% confidence interval [CI], -14% to 14%) against illness caused by antigenically drifted influenza A(H3N2) virus group 3C.2a viruses versus 44% (95% CI, 16%-63%) against illness caused by vaccine-like influenza A(H3N2) virus group 3C.3b viruses.
Conclusions: Effectiveness of 2014-2015 influenza vaccination varied by genetic group of influenza A(H3N2) virus. Changes in HA genes related to antigenic drift were associated with reduced VE.
Keywords: genetic characterization; influenza; influenza vaccine; pyrosequencing; vaccine effectiveness.
Published by Oxford University Press for the Infectious Diseases Society of America 2016. This work is written by (a) US Government employee(s) and is in the public domain in the US.
Figures
Comment in
-
A High-Resolution Look at Influenza Virus Antigenic Drift.J Infect Dis. 2016 Oct 1;214(7):982. doi: 10.1093/infdis/jiw183. Epub 2016 May 6. J Infect Dis. 2016. PMID: 27190189 Free PMC article. No abstract available.
References
-
- Klimov AI, Garten R, Russell C et al. WHO recommendations for the viruses to be used in the 2012 Southern Hemisphere Influenza Vaccine: epidemiology, antigenic and genetic characteristics of influenza A(H1N1)pdm09, A(H3N2) and B influenza viruses collected from February to September 2011. Vaccine 2012; 30:6461–71. - PMC - PubMed
-
- Skowronski DM, Chambers C, Sabaiduc S et al. Integrated sentinel surveillance linking genetic, antigenic, and epidemiologic monitoring of influenza vaccine-virus relatedness and effectiveness during the 2013–2014 influenza season. J Infect Dis 2015; 212:726–39. - PubMed
Publication types
MeSH terms
Substances
Grants and funding
- UL1 RR024153/RR/NCRR NIH HHS/United States
- U01 IP001034/IP/NCIRD CDC HHS/United States
- UL1 TR001857/TR/NCATS NIH HHS/United States
- UL1 TR000005/TR/NCATS NIH HHS/United States
- U01 IP000466/IP/NCIRD CDC HHS/United States
- U01 IP000471/IP/NCIRD CDC HHS/United States
- U01 IP001037/IP/NCIRD CDC HHS/United States
- U01 IP000467/IP/NCIRD CDC HHS/United States
- U01 IP000473/IP/NCIRD CDC HHS/United States
- U01IP000473/ACL/ACL HHS/United States
- CC999999/ImCDC/Intramural CDC HHS/United States
- U01 IP000474/IP/NCIRD CDC HHS/United States
LinkOut - more resources
Full Text Sources
Other Literature Sources
Medical
