. 2016:2016:4106297.
doi: 10.1155/2016/4106297. Epub 2016 Apr 17.

15-Deoxy-Δ(12,14)-prostaglandin J2 Induces Apoptosis and Upregulates SOCS3 in Human Thyroid Cancer Cells

Affiliations

15-Deoxy-Δ(12,14)-prostaglandin J2 Induces Apoptosis and Upregulates SOCS3 in Human Thyroid Cancer Cells

Carlos Antônio Trindade-da-Silva et al. PPAR Res. 2016.

Abstract

The cyclopentenone prostaglandin 15-deoxy-Δ(12,14)-prostaglandin J2 (15d-PGJ2) is a natural ligand of peroxisome proliferator-activated receptor gamma (PPAR-γ) and a potential mediator of apoptosis in cancer cells. In the present study, we evaluated the effect of 15d-PGJ2 in human thyroid papillary carcinoma cells (TPC-1) using different doses of 15d-PGJ2 (0.6 to 20 μM) to determine IC50 (9.3 μM) via the MTT assay. The supernatant culture medium of the TPC-1 cells that was treated either with 15d-PGJ2 or with vehicle (control) for 24 hours was assessed for IL-6 secretion via CBA assay. RT-qPCR was used to evaluate mRNA expression of IL-6, SOCS1, SOCS3, and STAT3. TPC-1 cells treated with 15d-PGJ2 decreased the secretion and expression of IL-6 and STAT3, while it increased SOCS1 and SOCS3. Overall, we demonstrated that 15d-PGJ2 downregulated IL-6 signaling pathway and led TPC-1 cells into apoptosis. In conclusion, 15d-PGJ2 shows the potential to become a new therapeutic approach for thyroid tumors.


Figures

Figure 1
Figure 1
15d-PGJ2 decreased the viability of TPC-1 cells. TPC-1 cells were treated with 15d-PGJ2. (a) represents the cell culture without treatment. (b) Cells treated with 10 μM of 15d-PGJ2. (c) Viability of the TPC-1 cells treated with 15d-PGJ2 in the concentrations of 0 to 20 μM. (d) IC50 from cell viability following treatment with 15d-PGJ2. The data are presented as means ± standard deviation of three replicates from at least three independent tests. An asterisk   indicates statistically significant difference from the control ( P > 0.01; ∗∗∗ P > 0.001).
Figure 2
Figure 2
Fibroblast (FG11) cell proliferation under 15d-PGJ2 treatment. FG11 cells were treated with 5 to 15 μM of 15d-PGJ2. The data are presented as means ± standard deviation of three replications from at least three independent tests. 15d-PGJ2 did not show significant difference from the control at the doses of 5 μM, 10 μM, and 15 μM.
Figure 3
Figure 3
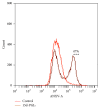
15d-PGJ2 induced apoptosis in TPC-1 cells. The Annexin V assay revealed that 15d-PGJ2 induced 47% apoptosis in TPC-1 compared to 5% in the control group. The data are presented as means ± standard deviation of three replicates from at least three independent tests.  ∗∗∗Statistically significant difference from the control (P > 0.001).
Figure 4
Figure 4
Decreased relative IL-6 mRNA expression and release, TPC-1 cells treated with 15d-PGJ2. TPC-1 cells were treated with 15d-PGJ2 (9,8 μM) for 0 to 24 h. (a) shows the relative IL-6 expression. (b) Quantitative IL-6 released by TPC-1 cells treated with 15d-PGJ2 against the control group. The data are presented as means ± standard deviation of three replicates from at least three independent tests. An asterisk   indicates statistically significant difference from the control group ( P > 0.01; ∗∗∗ P > 0.001).
Figure 5
Figure 5
SOCS3 and SOCS1 increased in TPC-1 cells treated with 15d-PGJ2. TPC-1 cells were treated with 15d-PGJ2 (9,8 μM) for 0 to 24 h. (a) shows the relative expression of SOCS3 (b), SOCS1 (c), and STAT3 (c) in the first two hours of treatment and decreased STAT3 four hours after the treatment (c). The date are presented as means ± standard deviation of three replicates from at least three independent tests. An asterisk   indicates statistically significant difference from the control ( P > 0.01; ∗∗∗ P > 0.001).

References

    1. Vigneri R., Malandrino P., Vigneri P. The changing epidemiology of thyroid cancer: why is incidence increasing? Current Opinion in Oncology. 2015;27(1):1–7. doi: 10.1097/cco.0000000000000148. - DOI - PubMed
    1. Sosonkina N. D., Starenki D., Park J.-I. The role of STAT3 in thyroid cancer. Cancers. 2014;6(1):526–544. doi: 10.3390/cancers6010526. - DOI - PMC - PubMed
    1. Yu H., Pardoll D., Jove R. STATs in cancer inflammation and immunity: a leading role for STAT3. Nature Reviews Cancer. 2009;9(11):798–809. doi: 10.1038/nrc2734. - DOI - PMC - PubMed
    1. Xiong A., Yang Z., Shen Y., Zhou J., Shen Q. Transcription factor STAT3 as a novel molecular target for cancer prevention. Cancers. 2014;6(2):926–957. doi: 10.3390/cancers6020926. - DOI - PMC - PubMed
    1. Resemann H. K., Watson C. J., Lloyd-Lewis B. The stat3 paradox: a killer and an oncogene. Molecular and Cellular Endocrinology. 2014;382(1):603–611. doi: 10.1016/j.mce.2013.06.029. - DOI - PubMed

LinkOut - more resources