. 2016 May 15;7(2):223-34.
doi: 10.4291/wjgp.v7.i2.223.

Sieving characteristics of cytokine- and peroxide-induced epithelial barrier leak: Inhibition by berberine

Affiliations

Sieving characteristics of cytokine- and peroxide-induced epithelial barrier leak: Inhibition by berberine

Katherine M DiGuilio et al. World J Gastrointest Pathophysiol. .

Abstract

Aim: To study whether the inflammatory bowel disease (IBD) colon which exhibits varying severity and cytokine levels across its mucosa create varying types of transepithelial leak.

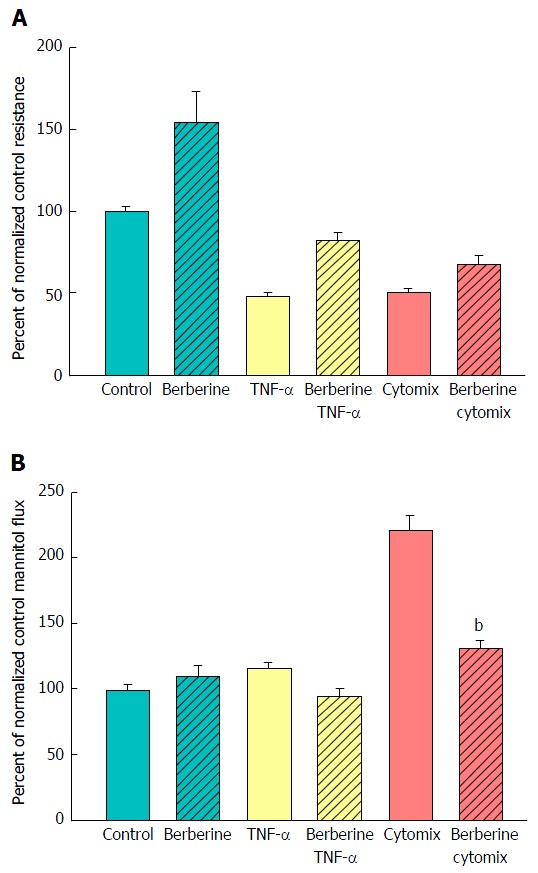
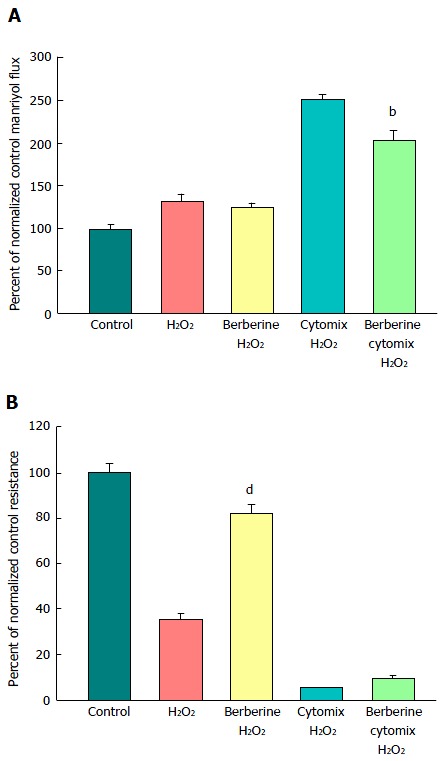
Methods: We examined the effects of tumor necrosis factor-α (TNF-α), interferon-γ (IFN-γ), interleukin-1-β (IL1β) and hydrogen peroxide (H2O2) - singly and in combinations - on barrier function of CACO-2 cell layers. Our focus was on the type (not simply the magnitude) of transepithelial leak generated by these agents as measured by transepithelial electrical resistance (TER) and transepithelial flux of (14)C-D-mannitol, (3)H-Lactulose and (14)C-Polyethylene glycol as radiolabeled probe molecules. The isoquinoline alkaloid, berberine, was then examined for its ability to reduce specific types of transepithelial leak.

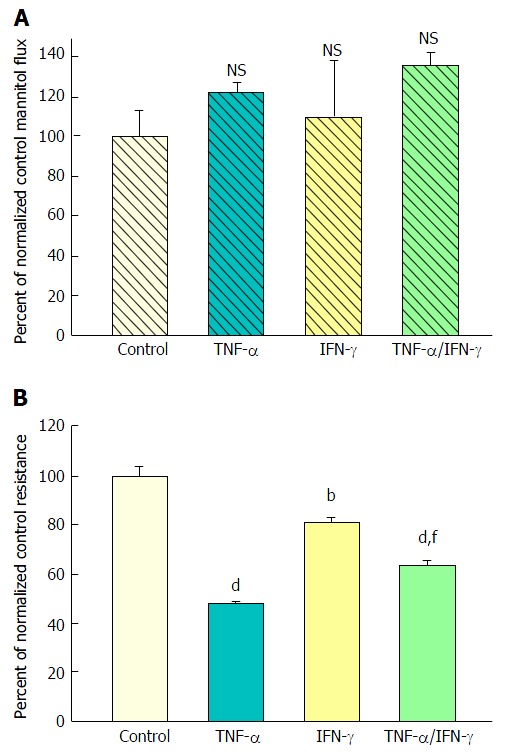
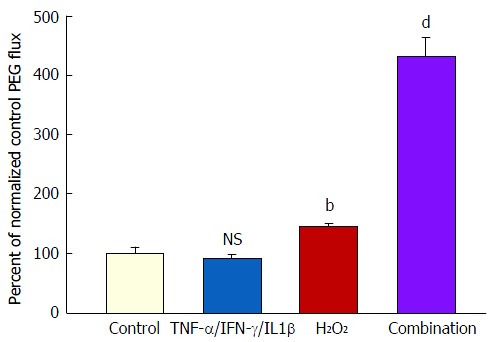
Results: Exposure to TNF-α alone (200 ng/mL; 48 h) induced a 50% decrease in TER, i.e., increased leak of Na(+) and Cl(-) - with only a marginal but statistically significant increase in transepithelial leak of (14)C-mannitol (Jm). Exposure to TNF-α + IFN-γ (200 ng/mL; 48 h) + IL1β (50 ng/mL; 48 h) did not increase the TER change (from TNF-α alone), but there was now a 100% increase in Jm. There however was no increase in transepithelial leak of two larger probe molecules, (3)H-lactulose and (14)C-polyethylene glycol (PEG). However, exposure to TNF-α + IFN-γ + IL1β followed by a 5 h exposure to 2 mmol/L H2O2 resulted in a 500% increase in (14)C-PEG leak as well as leak to the luminal mitogen, epidermal growth factor.

Conclusion: This model of graded transepithelial leak is useful in evaluating therapeutic agents reducing IBD morbidity by reducing barrier leak to various luminal substances.

Keywords: Berberine; CACO-2; Crohn’s disease; Cytokine; Intestine; Micronutrient; Tight junction; Ulcerative colitis.


Figures

Figure 1
Figure 1
The effect of tumor necrosis factor-α on CACO-2 transepithelial electrical resistance and transepithelial flux of 14C-D-mannitol. A: Seven-day post-confluent CACO-2 cell layers on Millipore polycarbonate filters were refed in control medium or medium containing 200 ng/mL tumor necrosis factor-α (TNF-α) (apical and basal-lateral compartments) 48 h prior to electrical measurements. Data shown represent the mean ± SE of 16 cell layers per condition. Data represent the percent of control resistance normalized across 3 experiments; B: After electrical measurements, radiotracer flux studies with 0.1 mmol/L, 0.1 μCi/mL 14C-D-mannitol were performed on CACO-2 cell layers, as described in Materials and Methods. Data represent the percent of control flux rate normalized across 4 experiments, and is expressed as the mean ± SE of 20 cell layers per condition. bP < 0.001 vs control (Student’s t test, one-tailed).
Figure 2
Figure 2
The effect of tumor necrosis factor-α and interferon-γ on CACO-2 transepithelial electrical resistance and transepithelial flux of 14C-D-mannitol. A: Radiotracer flux studies were conducted as described in Figure 1 with the treatment conditions listed above. Data represent the percent of control flux rate, and is expressed as the mean ± SE of 4 cell layers per condition. NS indicates non significance vs control; B: CACO-2 cell layers were cultured and treated as described in Figure 1, using the following conditions: Control medium; medium containing 200 ng/mL tumor necrosis factor-α (TNF-α); medium containing 200 ng/mL Interferon-γ (IFN-γ); or medium containing a combination of 200 ng/mL TNF-α and 200 ng/mL IFN-γ. Data shown represent the mean ± SE of 4 cell layers per condition, with data expressed as the percent of control resistance. bP < 0.01 vs control; dP < 0.001 vs control; fP < 0.01 vs TNF-α alone (one-way ANOVA followed by Tukey’s post hoc testing).
Figure 3
Figure 3
The effect of tumor necrosis factor-α + interferon-γ + interleukin-1β on CACO-2 transepithelial electrical resistance and transepithelial flux of 14C-D-mannitol. A: Twenty-one day post-confluent CACO-2 cell layers cultured and treated as described in Figure 1, were refed in control medium or medium containing the combination of 200 ng/mL tumor necrosis factor-α, 150 ng/mL interferon-γ, and 50 ng/mL interleukin-1β. Data shown represent the mean ± SE of 16 cell layers per condition. Data represent the percent of control resistance normalized across 4 experiments; B: Radiotracer flux studies were conducted as described in Figure 1, with the same conditions listed above for panel A. Data represent the percent of control flux rate normalized across 2 experiments, and is expressed as the mean ± SE of 8 cell layers per condition. bP < 0.001 vs control (Student’s t test, one-tailed).
Figure 4
Figure 4
The effect of tumor necrosis factor-α + interferon-γ + interleukin-1β on transepithelial flux of 14C-D-mannitol, 3H-lactulose, and 14C-polyethylene glycol across CACO-2 cell layers. Twenty-one day post-confluent CACO-2 cell layers on Millipore PCF filters were refed in control medium or medium containing the combination of 200 ng/mL tumor necrosis factor-α, 150 ng/mL interferon-γ, and 50 ng/mL interleukin-1β (apical and basal-lateral compartments) 48 h prior to radiotracer flux studies. These studies were performed using 0.1 mmol/L, 0.1 μCi/mL 14C-D-mannitol; 0.1 mmol/L, 0.25 μCi/mL 3H-lactulose; and 0.1 mmol/L, 0.3 μCi/mL 14C-polyethylene glycol as described in Materials and Methods. Data represent the percent of control flux rate normalized across 2 experiments, and is expressed as the mean ± SE of 8 cell layers per condition for the mannitol flux and 4 cell layers per condition for both the lactulose and polyethylene glycol fluxes. NS indicates non significance. bP < 0.001 vs control (Student’s t test, one-tailed).
Figure 5
Figure 5
The effect of tumor necrosis factor-α + interferon-γ + interleukin-1β plus hydrogen peroxide on transepithelial flux of 14C-polyethylene glycol. Seven-day and 21-d post-confluent CACO-2 cell layers on Millipore PCF filters were refed in control medium or medium containing the combination of 200 ng/mL TNF-α, 200 ng/mL IFN-γ, and 50 ng/mL IL1β (apical and basal-lateral compartments) 48 h prior to radiotracer flux studies. On the day of the experiment, the cell layers were treated for 5 h with control saline or saline containing 2 mmol/L H2O2. Paracellular permeability was assessed using 0.1 mmol/L, 0.3 μCi/mL 14C-polyethylene glycol as described in materials and methods. Data represent the percent of control flux rate normalized across 2 experiments, and is expressed as the mean ± SE for 8 cell layers per condition. NS indicates non significance vs control. bP < 0.01 vs control; dP < 0.001 vs control (one-way ANOVA followed by Tukey’s post hoc testing). IFN-γ: Interferon-γ; IL1β: Interleukin-1β; TNF-α: Tumor necrosis factor-α.
Figure 6
Figure 6
Morphological effects of cytokines and hydrogen peroxide on CACO-2 cell layers. CACO-2 cell layers were cultured at confluent density onto Millipore polycarbonate filters. Seven day post-seeding, the cell layers were refed with control medium or medium containing the combination of 200 ng/mL tumor necrosis factor-α, 200 ng/mL interferon-γ, and 50 ng/mL interleukin-1β (“cytomix”) (apical and basal-lateral compartments) for 48 h, followed by exposure to saline or saline containing 2 mmol/L H2O2 for 5 h. Cell layers were then fixed in formalin and stained with hematoxylin and eosin. A: CACO-2 cell layers exposed to control medium and control saline; B: CACO-2 cell layers exposed to cytomix medium and control saline; C: CACO-2 cell layers exposed to control medium and saline containing hydrogen peroxide; D: CACO-2 cell layers exposed to cytomix medium and saline containing hydrogen peroxide. In C and D, black arrows indicate instances of cytoplasmic blebbing. The red arrow points at a gap in the epithelial barrier arising from cell death and detachment.
Figure 7
Figure 7
The effect of berberine on cytokine-induced leak of CACO-2 cell layers. A: Seven-day post-confluent CACO-2 cell layers on Millipore polycarbonate filters were refed in control medium or medium containing 100 μmol/L berberine. After 24 h treatment with berberine alone, the cell layers were given either control or berberine medium in addition to being exposed to no cytokines, TNF-α alone, or cytomix (apical and basal-lateral compartments) for 48 h prior to electrical measurements. Data shown represent the mean ± SE of 8 cell layers per condition. Data represent the percent of control resistance normalized across experiments; B: After electrical measurements, the same CACO-2 cell layers represented in A were used to perform radiotracer flux studies with 0.1 mmol/L, 0.1 μCi/mL 14C-D-mannitol, as described in Materials and Methods. Data represent the percent of control flux rate normalized across experiments and is expressed as the mean ± SE of 8 cell layers per condition. bP < 0.001 vs cytomix alone (one-way ANOVA followed by Tukey’s post hoc testing). TNF-α: Tumor necrosis factor-α.
Figure 8
Figure 8
The effect of berberine on cytokine- and peroxide-induced leak of CACO-2 cell layers. A: After electrical measurements, the same CACO-2 cell layers represented in B were used to perform radiotracer flux studies with 0.1 mmol/L, 0.025 μCi/mL 14C-PEG. Data represent the percent of control flux rate, and is expressed as the mean ± SE of 4 cell layers per condition (3 cell layers for the condition of cytomix + peroxide, due to removal of one outlier data point, as determined by a 90% confidence level in the Dixon’s Q test); B: Seven-day post-confluent CACO-2 cell layers on Millipore polycarbonate filters were refed in control medium or medium containing 100 μmol/L berberine. After 24 h treatment with berberine alone, the cell layers were given either control or berberine medium, in addition to being exposed to either cytomix (50 ng/mL tumor necrosis factor-α, 100 ng/mL interferon-γ, 50 ng/mL interleukin-1β) or no cytokines (apical and basal-lateral compartments) for 48 h. On the day of the experiment, the cell layers were treated for 5 h with control saline or saline containing 1 mmol/L hydrogen peroxide ± berberine. Data shown represent the mean ± SE of 4 cell layers per condition, with data expressed as the percent of control resistance. bP < 0.01 vs cytomix + H2O2; dP < 0.001 vs H2O2 alone (one-way ANOVA followed by Tukey’s post hoc testing). Experiment was repeated with similar results.

Similar articles

Cited by

References

    1. Al-Sadi R, Boivin M, Ma T. Mechanism of cytokine modulation of epithelial tight junction barrier. Front Biosci (Landmark Ed) 2009;14:2765–2778. - PMC - PubMed
    1. Bruewer M, Samarin S, Nusrat A. Inflammatory bowel disease and the apical junctional complex. Ann N Y Acad Sci. 2006;1072:242–252. - PubMed
    1. Nusrat A, Turner JR, Madara JL. Molecular physiology and pathophysiology of tight junctions. IV. Regulation of tight junctions by extracellular stimuli: nutrients, cytokines, and immune cells. Am J Physiol Gastrointest Liver Physiol. 2000;279:G851–G857. - PubMed
    1. Shen L, Turner JR. Role of epithelial cells in initiation and propagation of intestinal inflammation. Eliminating the static: tight junction dynamics exposed. Am J Physiol Gastrointest Liver Physiol. 2006;290:G577–G582. - PubMed
    1. Thoreson R, Cullen JJ. Pathophysiology of inflammatory bowel disease: an overview. Surg Clin North Am. 2007;87:575–585. - PubMed

LinkOut - more resources