

Optic nerve head perfusion in normal eyes and eyes with glaucoma using optical coherence tomography-based microangiography
- PMID: 27190764
- PMCID: PMC4858460
- DOI: 10.21037/qims.2016.03.05
Optic nerve head perfusion in normal eyes and eyes with glaucoma using optical coherence tomography-based microangiography
Abstract
Background: To investigate the differences of perfusion in the optic nerve head (ONH) between normal and glaucomatous eyes using optical microangiography (OMAG) based optical coherence tomography (OCT) angiography technique.
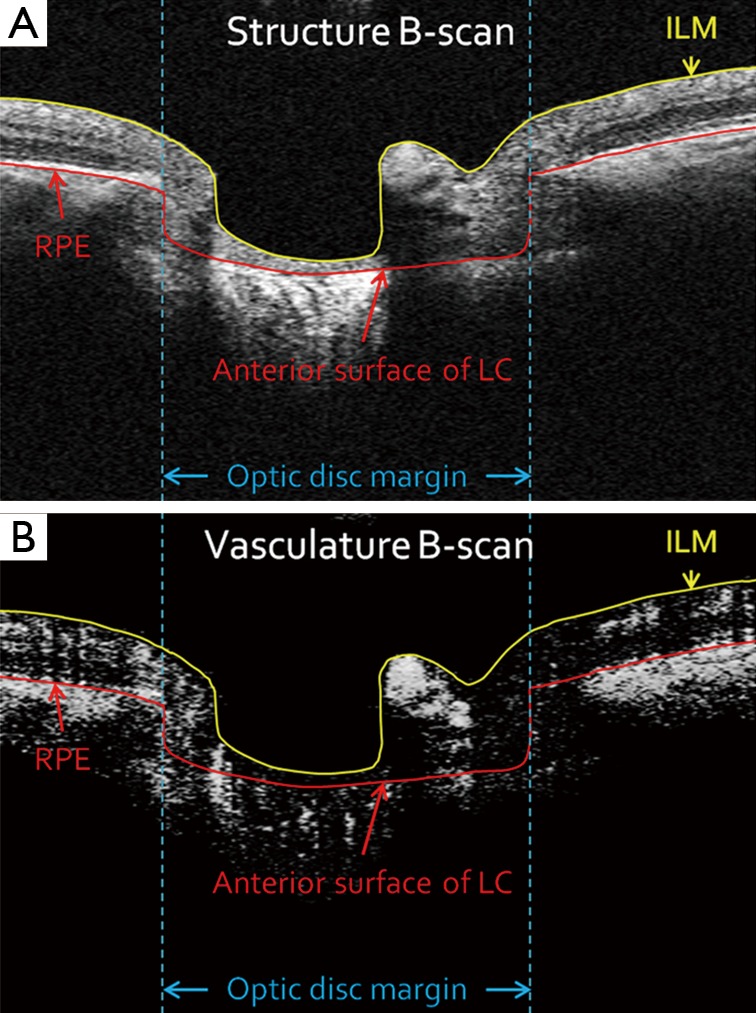
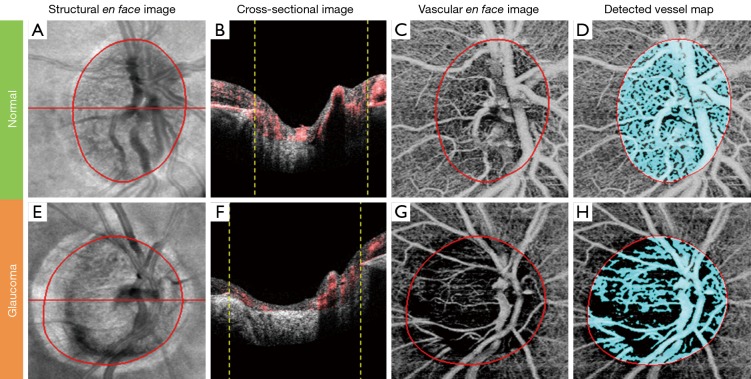
Methods: One eye from each subject was scanned with a 68 kHz Cirrus 5000 HD-OCT-based OMAG prototype system centered at the ONH (Carl Zeiss Meditec Inc, Dublin, CA, USA). Microvascular images were generated from the OMAG dataset by detecting the differences in OCT signal between consecutive B-scans. The pre-laminar layer (preLC) was isolated by a semi-automatic segmentation program. En face OMAG images for preLC were generated using signals with highest blood flow signal intensity. ONH perfusion was quantified as flux, vessel area density, and normalized flux within the ONH. Standard t-tests were performed to analyze the ONH perfusion differences between normal and glaucomatous eyes. Linear regression models were constructed to analyze the correlation between ONH perfusion and other clinical measurements.
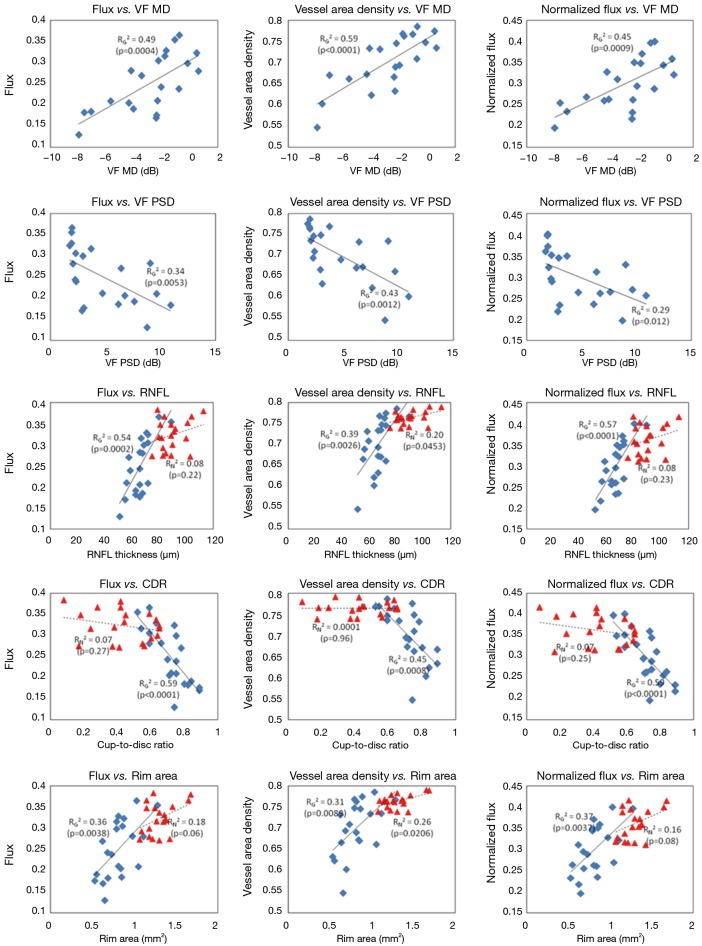
Results: Twenty normal and 21 glaucoma subjects were enrolled. Glaucomatous eyes had significantly lower ONH perfusion in preLC in all three perfusion metrics compared to normal eyes (P≤0.0003). Significant correlations between ONH perfusion and disease severity as well as structural changes were detected in glaucomatous eyes (P≤0.012).
Conclusions: ONH perfusion detected by OMAG showed significant differences between glaucoma and normal controls and was significantly correlated with disease severity and structural defects in glaucomatous eyes. ONH perfusion measurement using OMAG may provide useful information for detection and monitoring of glaucoma.
Keywords: Optical coherence tomography angiography; optic nerve head perfusion; optical microangiography (OMAG); primary open-angle glaucoma (POAG).
Conflict of interest statement
Figures
Similar articles
-
Optic Disc Perfusion in Primary Open Angle and Normal Tension Glaucoma Eyes Using Optical Coherence Tomography-Based Microangiography.PLoS One. 2016 May 5;11(5):e0154691. doi: 10.1371/journal.pone.0154691. eCollection 2016. PLoS One. 2016. PMID: 27149261 Free PMC article.
-
Repeatability and reproducibility of optic nerve head perfusion measurements using optical coherence tomography angiography.J Biomed Opt. 2016 Jun 1;21(6):65002. doi: 10.1117/1.JBO.21.6.065002. J Biomed Opt. 2016. PMID: 27272095 Free PMC article.
-
Peripapillary Retinal Nerve Fiber Layer Vascular Microcirculation in Glaucoma Using Optical Coherence Tomography-Based Microangiography.Invest Ophthalmol Vis Sci. 2016 Jul 1;57(9):OCT475-85. doi: 10.1167/iovs.15-18909. Invest Ophthalmol Vis Sci. 2016. PMID: 27442341 Free PMC article.
-
Optic nerve head deformation in glaucoma: the temporal relationship between optic nerve head surface depression and retinal nerve fiber layer thinning.Ophthalmology. 2014 Dec;121(12):2362-70. doi: 10.1016/j.ophtha.2014.06.035. Epub 2014 Aug 6. Ophthalmology. 2014. PMID: 25108319
-
The Role of Optical Coherence Tomography Angiography in Optic Nerve Head Edema: A Narrative Review.J Ophthalmol. 2022 Nov 30;2022:5823345. doi: 10.1155/2022/5823345. eCollection 2022. J Ophthalmol. 2022. PMID: 36505507 Free PMC article. Review.
Cited by
-
Colorimetric Analyses of the Optic Nerve Head and Retina Indicate Increased Blood Flow After Vitrectomy.Transl Vis Sci Technol. 2024 Jul 1;13(7):12. doi: 10.1167/tvst.13.7.12. Transl Vis Sci Technol. 2024. PMID: 39007833 Free PMC article.
-
Ultra-wide optical coherence tomography angiography in diabetic retinopathy.Quant Imaging Med Surg. 2018 Sep;8(8):743-753. doi: 10.21037/qims.2018.09.02. Quant Imaging Med Surg. 2018. PMID: 30306055 Free PMC article.
-
Photoplethysmographic analysis of retinal videodata based on the Fourier domain approach.Biomed Opt Express. 2021 Nov 9;12(12):7405-7421. doi: 10.1364/BOE.441451. eCollection 2021 Dec 1. Biomed Opt Express. 2021. PMID: 35003842 Free PMC article.
-
A comprehensive update on the use of optical coherence tomography angiography in glaucoma.Int Ophthalmol. 2023 May;43(5):1785-1802. doi: 10.1007/s10792-022-02574-1. Epub 2022 Dec 6. Int Ophthalmol. 2023. PMID: 36472722 Review.
-
Retinal vasculature in glaucoma: a review.BMJ Open Ophthalmol. 2017 Jul 11;1(1):e000032. doi: 10.1136/bmjophth-2016-000032. eCollection 2017. BMJ Open Ophthalmol. 2017. PMID: 29354699 Free PMC article. Review.
References
Grants and funding
LinkOut - more resources
Full Text Sources
Other Literature Sources
Research Materials