. 2016 Jun 21;7(25):38036-38051.
doi: 10.18632/oncotarget.9342.

Notch1 pathway-mediated microRNA-151-5p promotes gastric cancer progression

Affiliations

Notch1 pathway-mediated microRNA-151-5p promotes gastric cancer progression

Kai-Wen Hsu et al. Oncotarget. .

Abstract

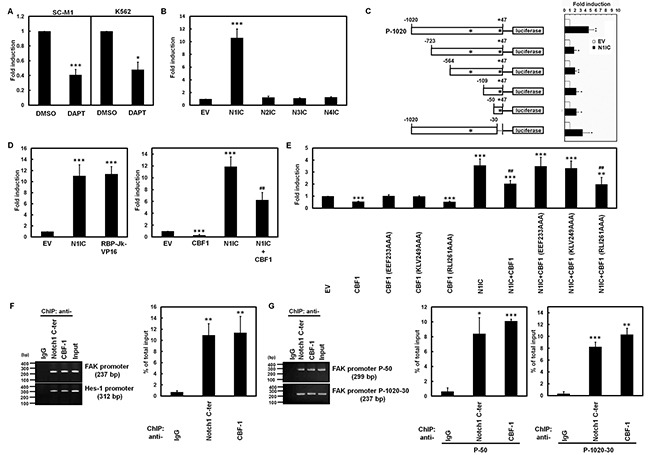
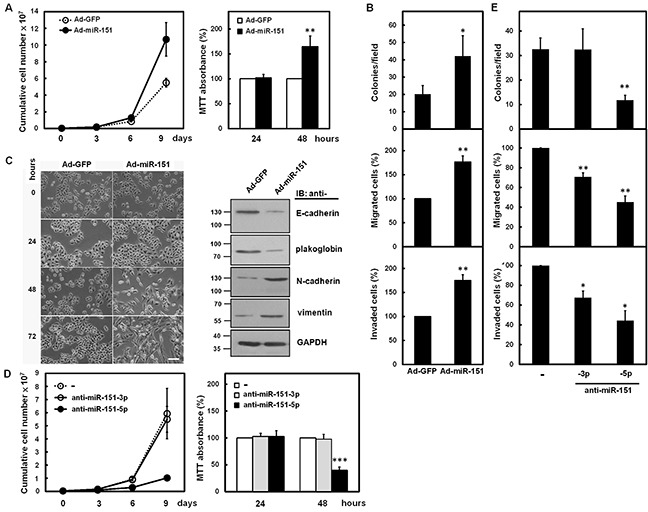
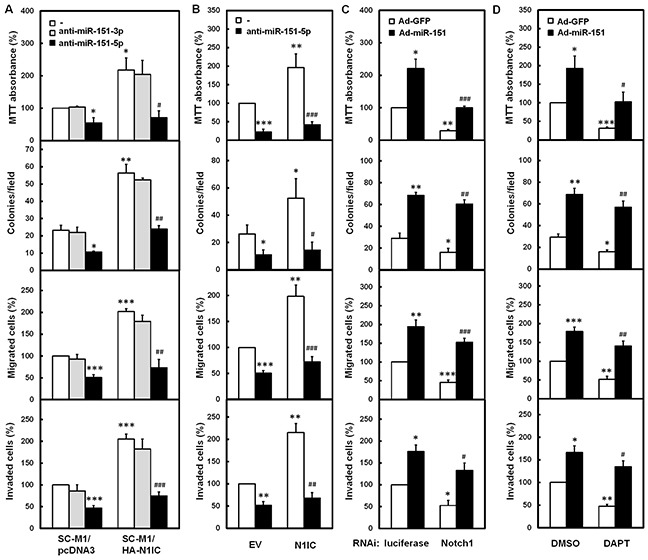
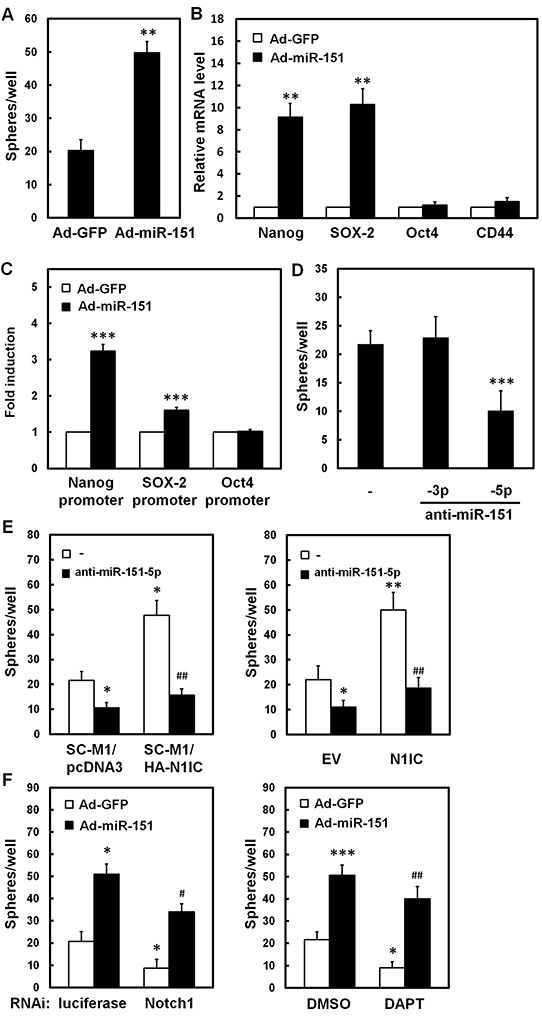
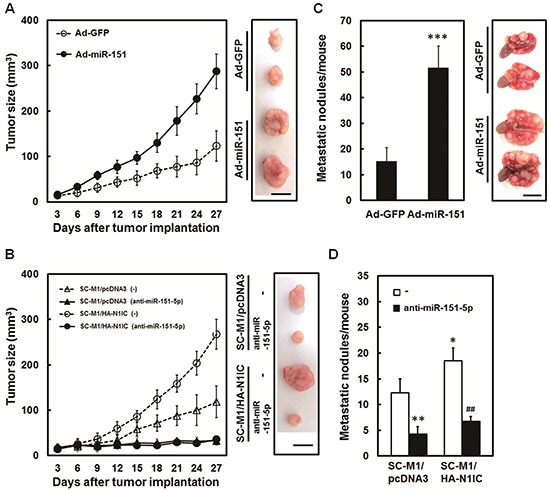
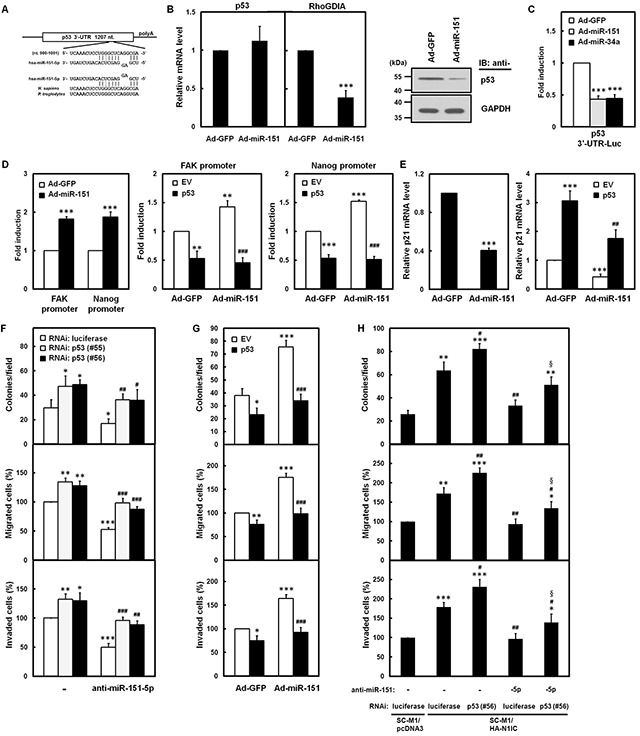
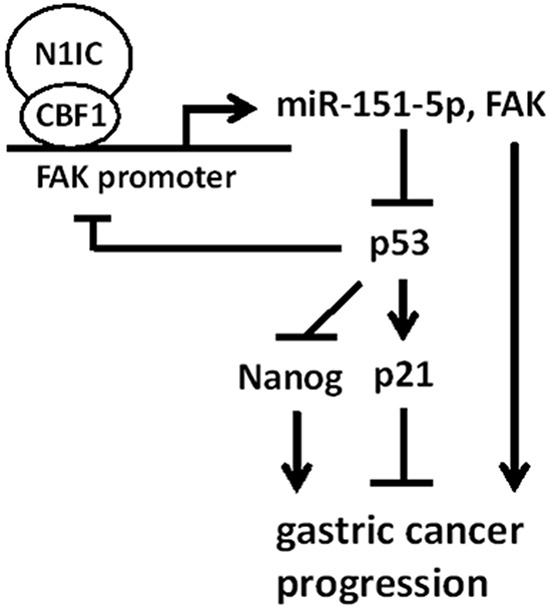
Gastric carcinoma is the third leading cause of lethal cancer worldwide. Previous studies showed that Notch1 receptor intracellular domain (N1IC), the activated form of Notch1 receptor, promotes gastric cancer progression. It has been demonstrated that a significant cross-talk interplays between Notch pathways and microRNAs (miRNAs) in controlling tumorigenesis. This study identified an intronic microRNA-151 (miR-151), which consists of two mature miRNAs, miR-151-3p and miR-151-5p, as a Notch1 receptor-induced miRNA in gastric cancer cells. Activation of Notch1 pathway enhanced expressions of miR-151 and its host gene, focal adhesion kinase (FAK), in gastric cancer cells. The levels of miR-151 in gastric cancer samples were higher than those of adjacent non-tumor samples. Activated Notch1 pathway induced CBF1-dependent FAK promoter activity. The ectopic expression of miR-151 promoted growth and progression of SC-M1 gastric cancer cells including cell viability and colony formation, migration, and invasion abilities. Activated Notch1 pathway could augment progression of gastric cancer cells through miR-151-5p and FAK. The mRNA levels of pluripotency genes, Nanog and SOX-2, tumorsphere formation ability, tumor growth, and lung metastasis of SC-M1 cells were elevated by activated Notch1 pathway through miR-151-5p. Furthermore, miR-151-5p could target 3'-untranslated region (3'-UTR) of p53 mRNA and down-regulate p53 level in SC-M1 cells. Mechanistically, Notch1/miR-151-5p axis contributed to progression of SC-M1 cells through down-regulation of p53 which in turn repressed FAK promoter activity. Taken together, these results suggest that Notch1 pathway and miR-151-5p interplay with p53 in a reciprocal regulation loop in controlling gastric carcinogenesis.

Keywords: FAK; Notch1 receptor; gastric carcinogenesis; miR-151; p53.


Conflict of interest statement

The authors disclose no potential conflicts of interest.

Figures

Figure 1
Figure 1. Activated Notch1 pathway enhanced miR-151 and FAK expressions in gastric cancer cells
A. The relative levels of miR-151-3p and miR-151-5p in N1IC-expressing SC-M1/HA-N1IC (left), K562/HA-N1IC (middle), and HEK293/myc-N1IC (right) cells and their control cells (SC-M1/pcDNA3, K562/pcDNA3, and HEK293/pcDNA3 cells, respectively) were measured by miRNA quantitative real-time PCR. Levels of miR-151-3p and miR-151-5p in control cells were set to unity. B. The relative levels of miR-151-3p and miR-151-5p in SC-M1, AZ521, and NUGC-3 cells were determined using miRNA quantitative real-time PCR after treatment with 50 mM DAPT for 24 hours. C. Whole-cell extracts of N1IC-expressing SC-M1/HA-N1IC (left), K562/HA-N1IC (middle), and HEK293/myc-N1IC (right) cells and their control cells were prepared and then analyzed by Western blot analysis using anti-Notch1 C-terminal (C-ter), anti-FAK, anti-pFAK Y397, and anti-GAPDH antibodies. D. After treated with 50 mM DAPT for 24 hours, whole-cell extracts of SC-M1 (left), AZ521 (middle), and NUGC-3 (right) cells were prepared for Western blot analysis using anti-cleaved Notch1, anti-FAK, anti-pFAK Y397, and anti-GAPDH antibodies. E. Tumor and the adjacent non-tumor tissue sample pairs from gastric cancer patients (n=40) were examined using miRNA quantitative real-time PCR analysis. Levels of miR-151-5p and miR-151-3p in the gastric cancer tissues were compared with those of the corresponding adjacent normal tissues. F. Data of level 3 of mRNA and miRNA expressions from stomach adenocarcinoma samples and normal counterparts were downloaded from the TCGA and Broad GDAC Firehose data portal. Both mRNA RPKM (Reads per Kilobase of exon model per Million) and microRNA reads per million mappable reads of all samples were selected and analyzed to compare abundances using GraphPad Prism 5 software. The transcript levels of miR-151, Notch1 receptor, and FAK in stomach adenocarcinoma samples (miR-151, n=323; Notch1 receptor and FAK, n=274) and normal tissue samples (n=33) were measured by RNA sequencing in TCGA data. *, P <0.05; **, P <0.01; ***, P <0.001.
Figure 2
Figure 2. Activated Notch1 pathway induced FAK promoter activity through CBF1
A. After transfection with reporter plasmid P-1020 containing FAK promoter (nucleotide −1,020 to +47) into SC-M1 and K562 cells, the transfected cells were treated with 50 mM DAPT for 48 hours and then used for reporter gene assay. B. Reporter plasmid P-1020 was co-transfected with expression constructs of Notch1 receptor (N1IC), Notch2 receptor (N2IC), Notch3 receptor (N3IC), and Notch4 receptor (N4IC) intracellular domains or empty vector (EV) into SC-M1 cells for 48 hours for reporter gene assay. C. Schematic representation of luciferase reporter plasmids (P-50, P-109, P-564, P-723, P-1020-30, and P-1020) containing various lengths of human FAK promoter (left). Stars indicate positions of the putative CBF1-response elements. Reporter plasmids containing various lengths of FAK promoter were co-transfected with N1IC-expressing construct into K562 cells for reporter gene assay (right). D. Reporter plasmid P-1020 was co-transfected with expression constructs of N1IC and constitutively active RBP-Jk-VP16 fusion protein (left) or CBF1 (right) into SC-M1 cells for reporter gene assay. E. Reporter plasmid P-1020 was co-transfected with expression constructs of N1IC, wild-type CBF1, and CBF1 mutants including EEF233AAA, KLV249AAA, and RLI261AAA into K562 cells for reporter gene assay. F. SC-M1/HA-N1IC cells were harvested for ChIP assay using anti-IgG, anti-Notch1 C-ter, and anti-CBF1 antibodies. The immunoprecipitated DNAs were used to amplify PCR products of FAK and Hes-1 promoters (left). Percentages of immunoprecipitated DNAs were quantified by quantitative real-time PCR and then normalized to total input DNA (right). G. After transfection with reporter plasmids P-50 and P-1020-30 for 48 hours, the transfected K562/HA-N1IC cells were harvested for ChIP assay as described above. The immunoprecipitated DNAs were used to amplify the PCR products in the region of FAK promoter in P-50 and P-1020-30 reporter plasmids. *, P <0.05; **, P <0.01; ***, P <0.001. ##, P < 0.01; ###, P< 0.001.
Figure 3
Figure 3. miR-151 promoted growth and progression of SC-M1 cells
A-C. SC-M1 cells were infected with adenoviruses expressing miR-151 (Ad-miR-151) or GFP (Ad-GFP). The infected cells were seeded and then counted by trypan blue exclusion method (left) or incubated to analyze cell proliferation by MTT assay (right) at the time indicated (A). The infected cells were seeded for colony formation (upper), migration (middle), and invasion (lower) assays (B). Means of at least three independent experiments performed in triplicate are shown. The infected cells were also seeded onto 6-well plates for morphological examination (left) at the time indicated (C). Bar, 100 μm. Whole-cell extracts of SC-M1 cells after infection for 48 hours were prepared for Western blot analysis using anti-E-cadherin, anti-plakoglobin, anti-N-cadherin, anti-vimentin, and anti-GAPDH antibodies (right). D, E. SC-M1 cells transfected with 100 nM antagomir-151-3p (anti-miR-151-3p) or antagomir-151-5p (anti-miR-151-5p) were seeded and subsequently counted by trypan blue exclusion method (left) or incubated to analyze cell proliferation by MTT assay (right) at the time indicated (D). The infected cells were also seeded for colony formation (upper), migration (middle), and invasion (lower) assays (E). Means of at least three independent experiments performed in triplicate are shown. *, P <0.05; **, P <0.01; ***, P <0.001.
Figure 4
Figure 4. N1IC augmented gastric cancer progression through miR-151-5p
A. The N1IC-expressing SC-M1/HA-N1IC and SC-M1/pcDNA3 control cells were transfected with 100 nM antagomir-151-3p (anti-miR-151-3p), antagomir-151-5p (anti-miR-151-5p), or scrambled control (−) and then seeded for MTT, colony formation, migration, and invasion assays. B. SC-M1 cells were co-transfected with N1IC-expressing construct (N1IC) or empty vector (EV) and 100 nM antagomir-151-5p or scrambled control and then seeded for MTT, colony formation, migration, and invasion assays. C. After transfection with siRNA vectors against Notch1 receptor or luciferase, SC-M1 cells were infected with adenoviruses expressing miR-151 (Ad-miR-151) or GFP (Ad-GFP) and then seeded for MTT, colony formation, migration, and invasion assays. D. After infected with adenoviruses expressing miR-151 or GFP, SC-M1 cells were treated with 50 mM DAPT and then seeded for MTT, colony formation, migration, and invasion assays. *, P <0.05; **, P <0.01; ***, P <0.001. #, P < 0.05; ##, P < 0.01; ###, P< 0.001.
Figure 5
Figure 5. N1IC elevated ability of tumorsphere formation of SC-M1 cells through miR-151-5p
A, B. SC-M1 cells were infected with adenoviruses expressing miR-151 (Ad-miR-151) or GFP (Ad-GFP). Then the infected cells were seeded onto 24-well ultra-low attachment plates under stem cell-selective conditions for subsequent tumorsphere formation assay (A). The transcript levels of Nanog, SOX-2, Oct4, and CD44 in the infected cells were also determined by quantitative real-time PCR (B). C. After transfection with reporter plasmids containing Nanog, SOX-2, and Oct4 promoters, SC-M1 cells were infected with adenoviruses expressing miR-151 or GFP for subsequent reporter gene assay. D. SC-M1 cells transfected with 100 nM antagomir-151-3p (anti-miR-151-3p), antagomir-151-5p (anti-miR-151-5p), or scrambled control (−) were seeded for tumorsphere assay. E. The N1IC-expressing SC-M1/HA-N1IC and SC-M1/pcDNA3 control cells were transfected with 100 nM antagomir-151-5p or scrambled control for tumorsphere assay (left). SC-M1 cells were co-transfected with N1IC-expressing construct (N1IC) or empty vector (EV) and 100 nM antagomir-151-5p or scrambled control for tumorsphere assay (right). F. After transfection with siRNA vectors against Notch1 receptor or luciferase, SC-M1 cells were infected with adenoviruses expressing miR-151 or GFP and then seeded for tumorsphere formation assay (left). After infected with adenoviruses expressing miR-151 or GFP, SC-M1 cells were also treated with 50 mM DAPT for tumorsphere formation assay (right). *, P <0.05; **, P <0.01; ***, P <0.001. #, P < 0.05; ##, P < 0.01.
Figure 6
Figure 6. N1IC promoted tumor growth and lung metastasis of SC-M1 cells through miR-151-5p in vivo
A. After infection with adenoviruses expressing miR-151 (Ad-miR-151) or GFP (Ad-GFP), SC-M1 cells were subcutaneously injected into nude mice (n = 6 per group) for measurement of tumor sizes at the time indicated. On day 27, the mice were sacrificed and then subcutaneous tumors were excised. Data are representative of three experiments. Bar, 1.0 cm. B. After transfection with 100 nM antagomir-151-5p (anti-miR-151-5p) or scrambled control (−), The N1IC-expressing SC-M1/HA-N1IC and SC-M1/pcDNA3 control cells were subcutaneously injected into nude mice (n = 5 per group) for measurement of tumor sizes at the time indicated. The mice were sacrificed on day 27 and subsequently subcutaneous tumors were excised. Data are representative of three experiments. Bar, 1.0 cm. C. After infection with adenoviruses expressing miR-151 or GFP, SC-M1 cells were injected into NOD-SCID mice (n = 7 per group) by tail vein injection for measurement of metastatic nodules in lungs. After 18 weeks, the mice were sacrificed and the metastatic nodules in the lungs were counted by gross and microscopic examination. Data are from a representative experiment that was performed three times with identical results. D. After transfection with 100 nM antagomir-151-5p or scrambled control, SC-M1/HA-N1IC or SC-M1/pcDNA3 cells were injected into NOD-SCID mice (n = 5 per group) by tail vein injection for measurement of metastatic nodules in lungs. The mice were sacrificed after 18 weeks and the metastatic nodules in the lungs were counted by gross and microscopic examination. Data are from a representative experiment that was performed three times with identical results. *, P <0.05; **, P <0.01; ***, P <0.001. ##, P < 0.01.
Figure 7
Figure 7. Notch1 pathway-miR-151 axis elevated aggressiveness of SC-M1 cells through down-regulation of p53
A. There is a putative miR-151-5p-binding site located at nucleotide 989 to 1,001 from the start of 3′-UTR of human p53 mRNA as predicted by RNAhybrid algorithm. The sequence of miR-151-5p is aligned with the 3′-UTRs of p53 in human (H. sapiens) and chimpanzee (P. troglodytes). B. After infection with adenoviruses expressing miR-151 (Ad-miR-151) or GFP (Ad-GFP), the transcript levels of p53 and RhoGDIA mRNAs in SC-M1 cells were measured by quantitative real-time PCR (left). Whole-cell extracts of the infected SC-M1 cells were prepared for Western blot analysis using anti-p53 and anti-GAPDH antibodies (right). C. After transfection with p53 3′-UTR-Luc reporter plasmid for 24 hours, SC-M1 cells were infected with adenoviruses expressing miR-151, miR-34a (Ad-miR-34a), or GFP for reporter gene assay. D. After transfection with reporter plasmids containing FAK or Nanog promoters for 24 hours, SC-M1 cells were infected with adenoviruses expressing miR-151 or GFP for reporter gene assay (left). After co-transfection with p53-expressing construct (p53) or empty vector (EV) and reporter plasmids containing FAK (middle) or Nanog (right) promoters for 24 hours, K562 cells were infected with adenoviruses expressing miR-151 or GFP for reporter gene assay. E. The transcript levels of p21 in SC-M1 cells were measured by quantitative real-time PCR after infection with adenoviruses expressing miR-151 or GFP (left). After transfection with p53-expressing construct or empty vector and subsequent infection with adenoviruses expressing miR-151 or GFP, the transcript levels of p21 in SC-M1 cells were also measured by quantitative real-time PCR (right). F. SC-M1 cells were co-transfected with antagomir-151-5p (anti-miR-151-5p) and siRNA vectors against p53 (#55 and #56) and then seeded for colony formation, migration, and invasion assays. G. After transfection with p53-expressing construct or empty vector, SC-M1 cells were infected with adenoviruses expressing miR-151 or GFP and then seeded for colony formation, migration, and invasion assays. H. The N1IC-expressing SC-M1/HA-N1IC and SC-M1/pcDNA3 control cells were co-transfected with 100 nM antagomir-151-5p or scrambled control and siRNA vectors against p53 (#56) or luciferase for colony formation, migration, and invasion assays. *, P <0.05; **, P <0.01; ***, P <0.001. #, P < 0.05; ##, P < 0.01; ###, P< 0.001. §, P < 0.05.
Figure 8
Figure 8. A model depicting the regulatory mechanism of Notch1/miR-151-5p/p53 axis in gastric carcinogenesis

References

    1. Ferlay J, Soerjomataram I, Dikshit R, Eser S, Mathers C, Rebelo M, Parkin DM, Forman D, Bray F. Cancer incidence and mortality worldwide: sources, methods and major patterns in GLOBOCAN 2012. Int J Cancer. 2015;136:E359–386. - PubMed
    1. Yin L, Velazquez OC, Liu ZJ. Notch signaling: emerging molecular targets for cancer therapy. Biochem Pharmacol. 2010;80:690–701. - PubMed
    1. Andersson ER, Lendahl U. Therapeutic modulation of Notch signalling--are we there yet? Nat Rev Drug Discov. 2014;13:357–378. - PubMed
    1. Tseng YC, Tsai YH, Tseng MJ, Hsu KW, Yang MC, Huang KH, Li AF, Chi CW, Hsieh RH, Ku HH, Yeh TS. Notch2-induced COX-2 expression enhancing gastric cancer progression. Mol Carcinog. 2012;51:939–951. - PubMed
    1. Yeh TS, Wu CW, Hsu KW, Liao WJ, Yang MC, Li AF, Wang AM, Kuo ML, Chi CW. The activated Notch1 signal pathway is associated with gastric cancer progression through cyclooxygenase-2. Cancer Res. 2009;69:5039–5048. - PubMed

MeSH terms