. 2016 Aug:282:86-98.
doi: 10.1016/j.expneurol.2016.05.019. Epub 2016 May 16.

Lumbar Myeloid Cell Trafficking into Locomotor Networks after Thoracic Spinal Cord Injury

Affiliations

Lumbar Myeloid Cell Trafficking into Locomotor Networks after Thoracic Spinal Cord Injury

Christopher N Hansen et al. Exp Neurol. 2016 Aug.

Abstract

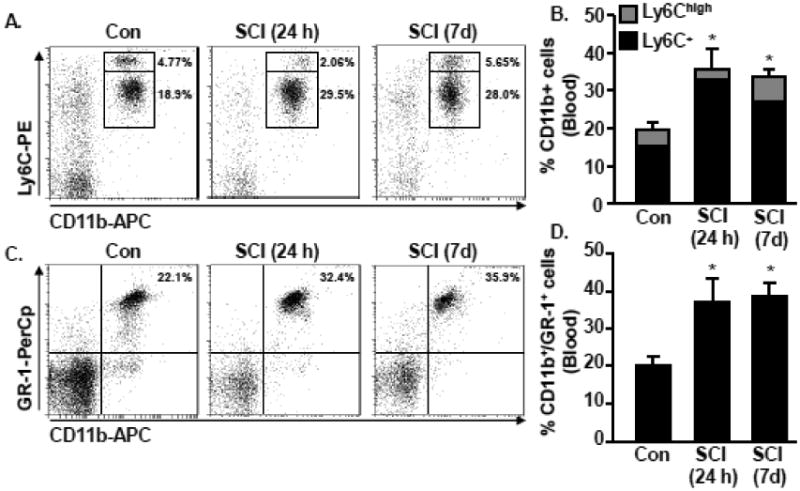
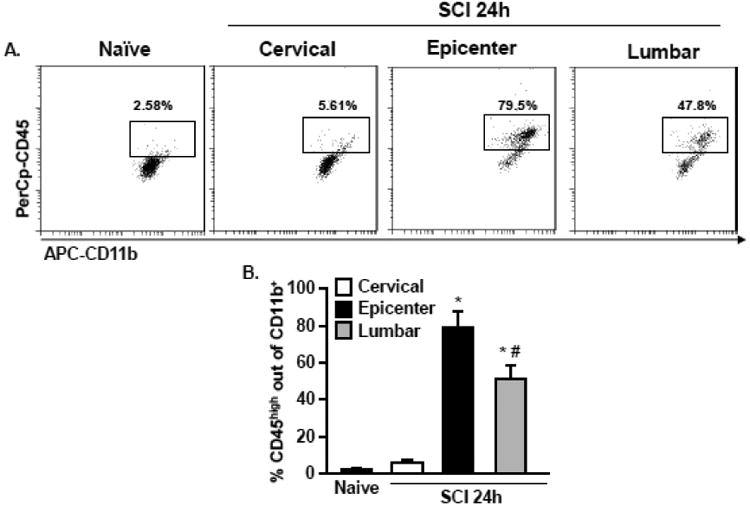
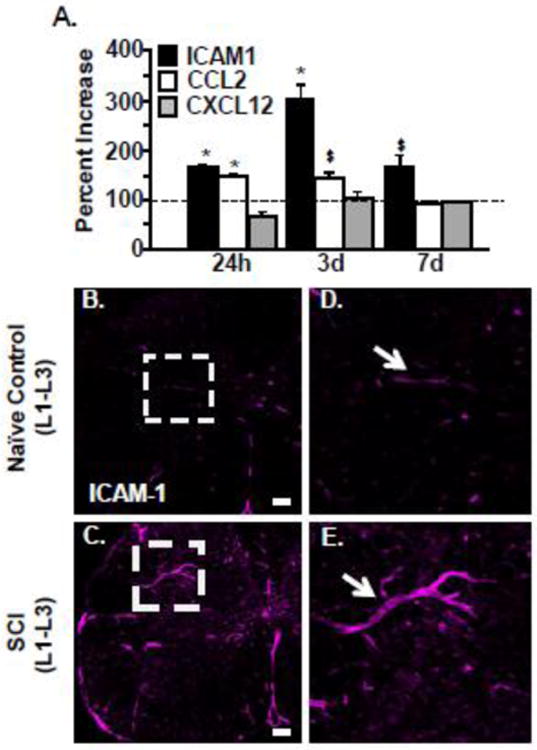
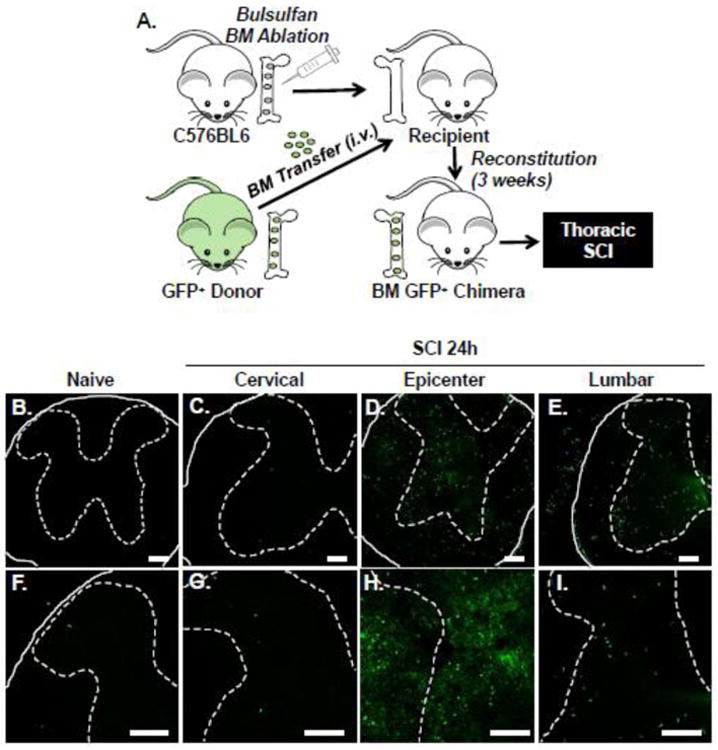
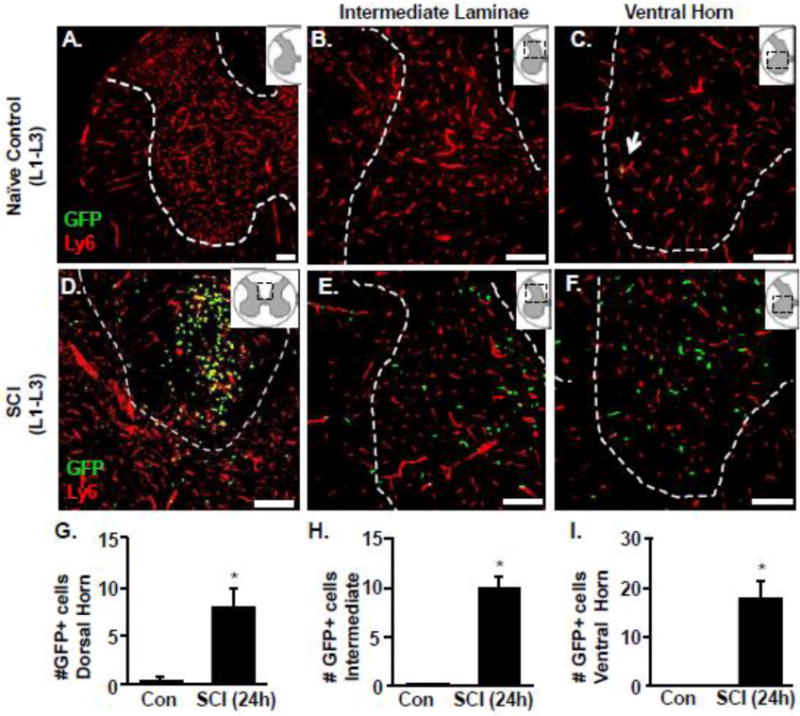
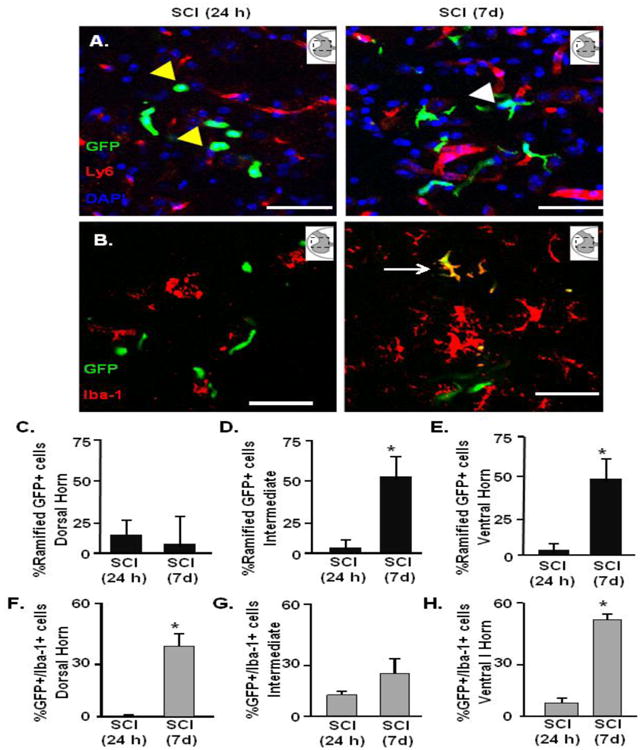
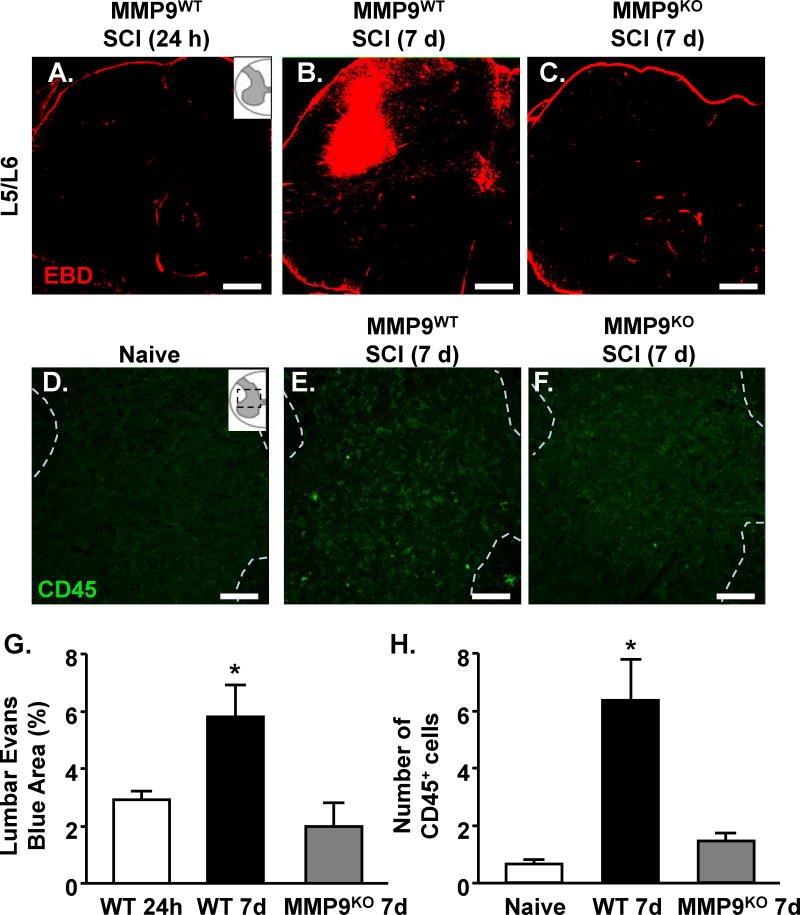
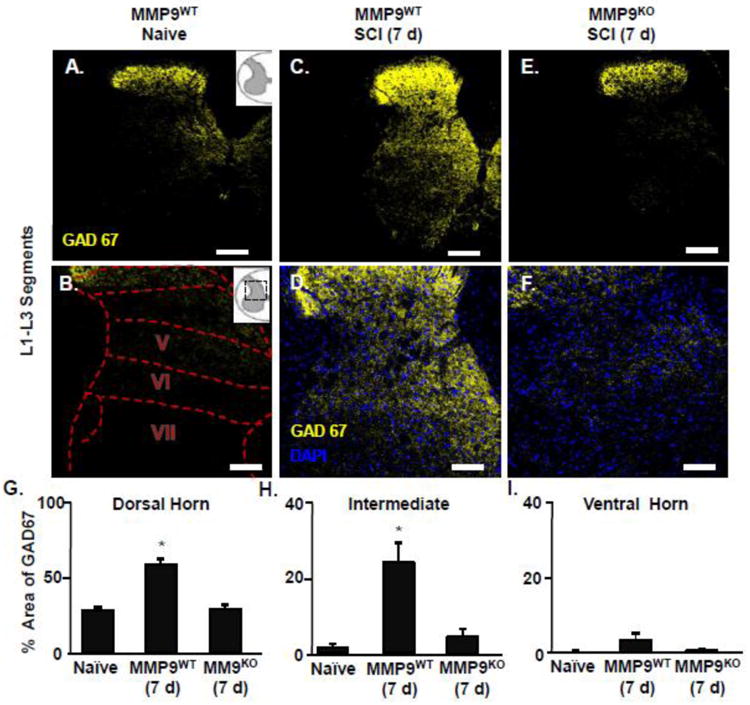
Spinal cord injury (SCI) promotes inflammation along the neuroaxis that jeopardizes plasticity, intrinsic repair and recovery. While inflammation at the injury site is well-established, less is known within remote spinal networks. The presence of bone marrow-derived immune (myeloid) cells in these areas may further impede functional recovery. Previously, high levels of the gelatinase, matrix metalloproteinase-9 (MMP-9) occurred within the lumbar enlargement after thoracic SCI and impeded activity-dependent recovery. Since SCI-induced MMP-9 potentially increases vascular permeability, myeloid cell infiltration may drive inflammatory toxicity in locomotor networks. Therefore, we examined neurovascular reactivity and myeloid cell infiltration in the lumbar cord after thoracic SCI. We show evidence of region-specific recruitment of myeloid cells into the lumbar but not cervical region. Myeloid infiltration occurred with concomitant increases in chemoattractants (CCL2) and cell adhesion molecules (ICAM-1) around lumbar vasculature 24h and 7days post injury. Bone marrow GFP chimeric mice established robust infiltration of bone marrow-derived myeloid cells into the lumbar gray matter 24h after SCI. This cell infiltration occurred when the blood-spinal cord barrier was intact, suggesting active recruitment across the endothelium. Myeloid cells persisted as ramified macrophages at 7days post injury in parallel with increased inhibitory GAD67 labeling. Importantly, macrophage infiltration required MMP-9.

Keywords: Blood brain barrier; Inflammation; MMP-9; Macrophage; Spinal cord injury.


Conflict of interest statement

Conflict of Interest Statement: The authors have declared that no conflict of interest exists.

Figures

Figure 1
Figure 1. Increased presence of monocytes and granulocytes in circulation 24 h and 7 days after thoracic SCI
C57BL6 mice were naïve or subjected to a Mid-thoracic SCI. Blood was collected 24 h or 7 d later and the percentage of monocytes and granulocytes were assessed. A) Representative bivariate dot plots of CD11b and Ly6C labeling of monocytes. B) The percentage of CD11b+ cells that were Ly6C+ or Ly6Chigh in circulation 24 h and 7 d after SCI is shown. C) Representative bivariate dot plots of CD11b and GR-1 labeling of granulocytes. D) The percentage of granulocytes (CD11b+/GR-1+) in circulation 24 h and 7 d after SCI is shown. Bars represent the mean + SEM. Means with (*) are significantly different than naïve controls. Data were analyzed using one-way ANOVA and Tukey's HSD post hoc tests for significant main effects (n=4).
Figure 2
Figure 2. Trafficking of peripheral myeloid cells into the epicenter and lumbar regions after thoracic SCI
C57BL6 mice were naïve or subjected to a mid-thoracic SCI. The cervical region, epicenter region, and lumbar region was collected 24 h later and myeloid cells were isolated from the tissue. A) Representative bivariate dot plots of CD11b and CD45 labeling of myeloid cells. B) The percentage of peripherally derived CD11b+/CD45high cells was quantified. Bars represent the mean + SEM. Means with (*) are significantly different than naive. Mean with (#) is significantly different than epicenter. Data were analyzed using one-way ANOVA and Tukey's HSD post hoc tests for significant main effects (n=4).
Figure 3
Figure 3. Thoracic SCI increased ICAM-1 and CCL2 protein expression within remote lumbar segments
C57BL6 mice were naïve or subjected to a mid-thoracic SCI. A) The lumbar cord was collected 24 h, 3 d, 7 d after SCI and the protein levels of ICAM1, CCL2, and CXCL12 were determined. Data are presented as percent change from naïve controls (dotted line). Bars represent mean + SEM. Data were analyzed using two-way ANOVA and post hoc t-tests for significant main effects Means with (*) are significantly different than naive controls. Means with ($) have p-values ≤0.06. Data were analyzed using one-way ANOVA and Tukey's HSD post hoc tests for significant main effects (n=3-5). In a related experiment, C57BL6 mice were naïve or subjected to a mid-thoracic SCI. Mice were perfused, fixed and the spinal cord was collected 7 days after injury. Representative images of ICAM-1 labeling in the lumbar cord (L1-L3) of B) naïve and C) SCI mice. Scale bar is 100 μm. Dashed white boxes outline blood vessels that were positive for ICAM labeling. Representative enlarged images of ICAM-1+ blood vessels (white arrow) from D) naïve and E) SCI mice.
Figure 4
Figure 4. Region specific infiltration of GFP+ BM-derived cells into lumbar cord 24 hours after thoracic SCI
A) C57BL6 mice were subject to busulfan treatment to ablate the bone marrow. Next, busulfan treated mice received a BM transfer of cells from a GFP+ C57BL6 donor mouse. After BM reconstitution (3 weeks), GFP+ BM chimeric mice were assigned to naïve or thoracic SCI groups. Mice were perfused and fixed and the spinal cord was collected 24 h later. B-I) Representative images of GFP+ cells in the spinal cord of naïve mice (B, F) and 24 h after SCI in the cervical (C, G), epicenter (D, H), and lumbar (E, I) regions. High magnification images show (F-I) show increased detail of GFP+ cells. Solid lines indicate the outer border of the spinal cord, while dashed lines outline the gray matter. GFP+ cells were also noted in the peripheral nerve roots after SCI (not quantified; B, D, E, F). Data is further quantified via cell counts and flow cytometry in subsequent figures. Scale bar is 100 μm.
Figure 5
Figure 5. Increased infiltration of GFP+ BM derived cells into lumbar cord 24 hours after thoracic SCI
GFP+ BM chimeric mice were assigned to naïve or to a thoracic SCI. Mice were perfused and fixed and the spinal cord was collected 24 h later. The presence of GFP+ cells in and out of the vasculature (Ly6C+) of the lumbar cord (L1-L3) was determined. Representative images of the GFP+ (green) and Ly6C (red) labeling in naïve mice within the dorsal horn, intermediate laminae and ventral horn gray matter of the lumbar cord (A-C). Representative images of the GFP+ (green) and Ly6C (red) labeling in SCI mice with the dorsal column, intermediate laminae and ventral horn gray matter (D-F) of the lumbar cord. Inserts show the anatomical region within the spinal cord used. Dashed white outline shows the gray matter of the cord in labeled sections. Scale bar is 100μm. The number of GFP+ cells in the G) dorsal horn, H) intermediate laminae and I) ventral horn matter of the lumbar cord. Bars represent the mean + SEM. Means with (*) are significantly different than controls. Data were analyzed using one-way ANOVA (n=4).
Figure 6
Figure 6. BM-derived GFP+ macrophages persisted in the parenchyma of the lumbar cord at 7 days
GFP+ chimeric C57BL6 mice were naïve or subjected to thoracic SCI. Mice were perfused and fixed and the spinal cord was collected at 24 h or 7 d. A) Representative images of the GFP+ (green), Ly6C (red), and DAPI (blue) labeling in the ventral horn 24 h (left) and 7 days (right) after SCI. Inserts show the anatomical region within the spinal cord used. Yellow arrow highlights rod or circular GFP+ cell and the white arrows highlight ramified GFP+ cells. Scale bar is 50um. The presence of GFP+ and Iba-1+ cells was determined alongside a quantification of cells that displayed a ramified morphology. B) Representative images of the GFP+ (green) and Iba-1 (red) in the ventral horn. White arrows highlight GFP+/Iba-1 cell in the lumbar cord 7 days after SCI. The number of ramified GFP+ cells in the parenchyma (GFP+/Ly6C-) 24 h and 7 d after SCI was determined in C) dorsal horn, D) intermediate laminae, and E) ventral horn of the lumbar cord. The number of GFP+/Iba+1 cells in the parenchyma 24 h and 7 d after SCI was determined in the F) dorsal horn, G) intermediate and H) ventral horn of the lumbar cord. Bars represent the mean + SEM. Means with (*) are significantly different between groups. Data were analyzed using one-way ANOVA (n=4).
Figure 7
Figure 7. MMP-9-dependent breakdown of the lumbosacral vasculature 7 days after thoracic SCI
MMP9WT or MMP9KO mice were naïve or subjected to a thoracic SCI. Mice were injected with evans blue dye (EBD) as naive, and at 24 h or 7 d after SCI. Mice were perfused 30 minutes after injection, fixed, and the spinal cord was collected. Vascular permeability was described via fluorescence using confocal microscopy. Representative images of evans blue labeling in L5/L6 of the lumbar cord of A) MMP9WT 24 h, B) MMP9WT 7 day, and C) MMP9KO 7 day mice. D) Quantification of evans blue labeling through the lumbar cord. Bars represent the mean + SEM. Means with (*) are significantly different from 24 h. The same mice were labeled for CD45 expression in the lumbar cord. Representative images of CD45 labeling in lumbar cord of E) naïve, F) MMP9WT 7 days, and G) MMP9KO 7 day mice. The number of CD45 positive cells is quantified in H. Bars represent the mean + SEM. Means with (*) are significantly different from naive. Data were analyzed using one-way ANOVA and Tukey's HSD post hoc tests for significant main effects (n=5-7). Inserts show the anatomical region within the spinal cord used. Scale bar is 100um.
Figure 8
Figure 8. MMP-9-dependent enhancement of GAD67 labeling in lumbar cord 7 days after thoracic SCI
MMP9WT or MMP9KO mice were assigned to naïve or to thoracic SCI and survived for 7 d. Mice perfused, fixed, and the spinal cord was collected. A) Representative images of GAD67 (yellow) labeling in naïve mice or 7 days after SCI in L1-L3 segments of the lumbar cord. B) Inserts show the anatomical cord segments examined. C) Representative images of GAD67 (yellow) and DAPI (blue) labeling 7 days after SCI in L1-L3 of the lumbar cord. The proportional area of labeling for GAD67 in the D) dorsal horn, E) intermediate laminae, and F) ventral horn of the lumbar cord. Means with (*) are significantly different than naïve control. Data were analyzed using one-way ANOVA and Tukey's HSD post hoc tests for significant main effects (n=3-4). Inserts show the anatomical region within the spinal cord used. Scale bar is 100um.

Similar articles

Cited by

References

    1. Abbott NJ, Patabendige AA, Dolman DE, Yusof SR, Begley DJ. Structure and function of the blood-brain barrier. Neurobiol Dis. 2010;37:13–25. - PubMed
    1. Alilain WJ, Li X, Horn KP, Dhingra R, Dick TE, Herlitze S, Silver J. Light-induced rescue of breathing after spinal cord injury. J Neurosci. 2008;28:11862–11870. - PMC - PubMed
    1. Alliot F, Rutin J, Pessac B. Ly-6C is expressed in brain vessels endothelial cells but not in microglia of the mouse. Neurosci Lett. 1998;251:37–40. - PubMed
    1. Alstermark B, Isa T. Circuits for skilled reaching and grasping. Annu Rev Neurosci. 2012;35:559–578. - PubMed
    1. Alstermark B, Pettersson LG, Nishimura Y, Yoshino-Saito K, Tsuboi F, Takahashi M, Isa T. Motor command for precision grip in the macaque monkey can be mediated by spinal interneurons. J Neurophysiol. 2011;106:122–126. - PubMed

Publication types

MeSH terms