

Fully Automated RNAscope In Situ Hybridization Assays for Formalin-Fixed Paraffin-Embedded Cells and Tissues
- PMID: 27191821
- PMCID: PMC5132049
- DOI: 10.1002/jcb.25606
Fully Automated RNAscope In Situ Hybridization Assays for Formalin-Fixed Paraffin-Embedded Cells and Tissues
Abstract
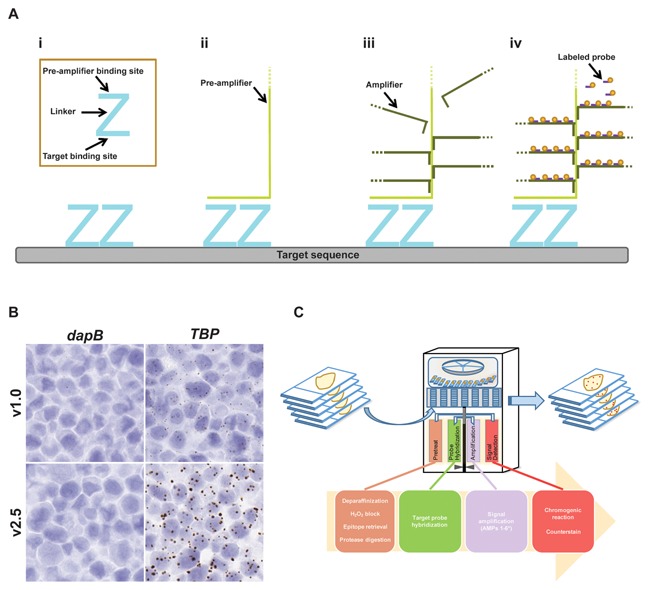
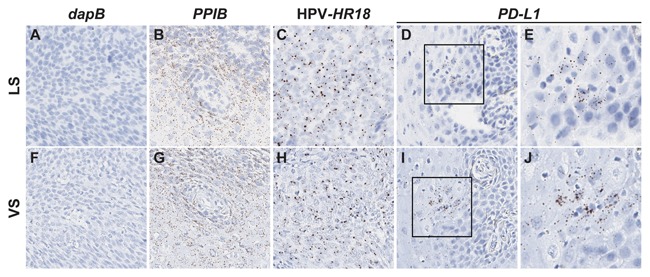
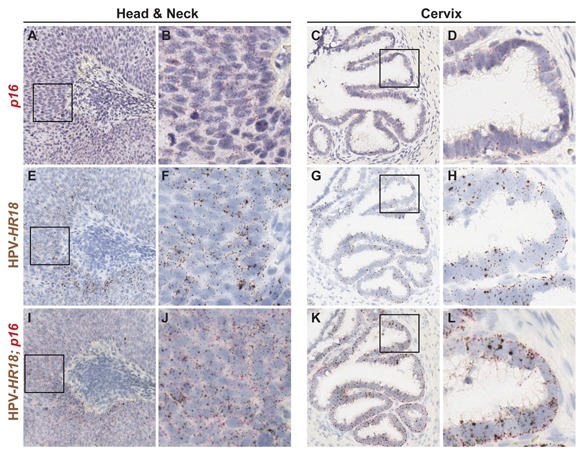
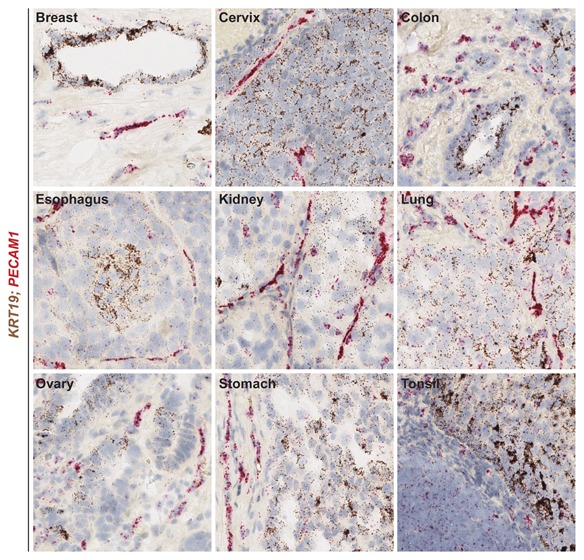
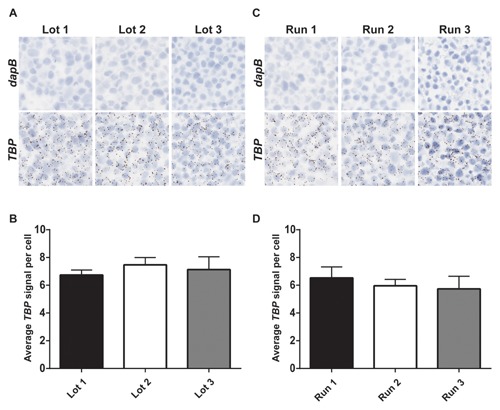
Biomarkers such as DNA, RNA, and protein are powerful tools in clinical diagnostics and therapeutic development for many diseases. Identifying RNA expression at the single cell level within the morphological context by RNA in situ hybridization provides a great deal of information on gene expression changes over conventional techniques that analyze bulk tissue, yet widespread use of this technique in the clinical setting has been hampered by the dearth of automated RNA ISH assays. Here we present an automated version of the RNA ISH technology RNAscope that is adaptable to multiple automation platforms. The automated RNAscope assay yields a high signal-to-noise ratio with little to no background staining and results comparable to the manual assay. In addition, the automated duplex RNAscope assay was able to detect two biomarkers simultaneously. Lastly, assay consistency and reproducibility were confirmed by quantification of TATA-box binding protein (TBP) mRNA signals across multiple lots and multiple experiments. Taken together, the data presented in this study demonstrate that the automated RNAscope technology is a high performance RNA ISH assay with broad applicability in biomarker research and diagnostic assay development. J. Cell. Biochem. 117: 2201-2208, 2016. © 2016 Wiley Periodicals, Inc.
Keywords: AUTOMATION; BIOMARKER; GENE EXPRESSION; IN SITU HYBRIDIZATION; RNA; RNAscope.
© 2016 Wiley Periodicals, Inc.
Figures
Similar articles
-
RNAscope: a novel in situ RNA analysis platform for formalin-fixed, paraffin-embedded tissues.J Mol Diagn. 2012 Jan;14(1):22-9. doi: 10.1016/j.jmoldx.2011.08.002. J Mol Diagn. 2012. PMID: 22166544 Free PMC article.
-
Quantitative ultrasensitive bright-field RNA in situ hybridization with RNAscope.Methods Mol Biol. 2014;1211:201-12. doi: 10.1007/978-1-4939-1459-3_16. Methods Mol Biol. 2014. PMID: 25218387
-
Simultaneous visualization and cell-specific confirmation of RNA and protein in the mouse retina.Mol Vis. 2014 Sep 21;20:1366-73. eCollection 2014. Mol Vis. 2014. PMID: 25352743 Free PMC article.
-
Technical Aspects and Applications for Developing in situ Hybridization Procedures for Formalin-Fixed and Paraffin-Embedded (FFPE) Tissues for Diagnosis of Fungal Infections.Med Mycol J. 2017;58(1):E33-E37. doi: 10.3314/mmj.16-00025. Med Mycol J. 2017. PMID: 28250362 Review.
-
In situ detection of precursor and mature microRNAs in paraffin embedded, formalin fixed tissues and cell preparations.Methods. 2008 Jan;44(1):39-46. doi: 10.1016/j.ymeth.2007.10.008. Methods. 2008. PMID: 18158131 Review.
Cited by
-
CALINCA-A Novel Pipeline for the Identification of lncRNAs in Podocyte Disease.Cells. 2021 Mar 20;10(3):692. doi: 10.3390/cells10030692. Cells. 2021. PMID: 33804736 Free PMC article.
-
Acquired CFTR dysfunction and dense distribution of ionocytes in nasal mucosa of children with CRS.Eur Arch Otorhinolaryngol. 2023 Jul;280(7):3237-3247. doi: 10.1007/s00405-023-07833-0. Epub 2023 Jan 20. Eur Arch Otorhinolaryngol. 2023. PMID: 36662267 Free PMC article.
-
Complete responses to odronextamab in two patients with diffuse large B-cell lymphoma refractory to chimeric antigen receptor T-cell therapy.Br J Haematol. 2022 Nov;199(3):366-370. doi: 10.1111/bjh.18383. Epub 2022 Jul 27. Br J Haematol. 2022. PMID: 35892294 Free PMC article.
-
Estrogen Receptor-α Quantification in Breast Cancer: Concordance Between Immunohistochemical Assays and mRNA-In Situ Hybridization for ESR1 Gene.Appl Immunohistochem Mol Morphol. 2020 May/Jun;28(5):347-353. doi: 10.1097/PAI.0000000000000760. Appl Immunohistochem Mol Morphol. 2020. PMID: 30920963 Free PMC article.
-
FKBP51 Immunohistochemical Expression: A New Prognostic Biomarker for OSCC?Int J Mol Sci. 2017 Feb 18;18(2):443. doi: 10.3390/ijms18020443. Int J Mol Sci. 2017. PMID: 28218707 Free PMC article.
References
-
- Cassidy A, Jones J. 2014. Developments in in situ hybridisation. Methods 70:39–45. - PubMed
-
- Du Z, Abedalthagafi M, Aizer AA, McHenry AR, Sun HH, Bray MA, Viramontes O, Machaidze R, Brastianos PK, Reardon DA, Dunn IF, Freeman GJ, Ligon KL, Carpenter AE, Alexander BM, Agar NY, Rodig SJ, Bradshaw EM, Santagata S. 2015. Increased expression of the immune modulatory molecule PD‐L1 (CD274) in anaplastic meningioma. Oncotarget 6:4704–4716. - PMC - PubMed
-
- Egelhofer TA, Minoda A, Klugman S, Lee K, Kolasinska‐Zwierz P, Alekseyenko AA, Cheung MS, Day DS, Gadel S, Gorchakov AA, Gu T, Kharchenko PV, Kuan S, Latorre I, Linder‐Basso D, Luu Y, Ngo Q, Perry M, Rechtsteiner A, Riddle NC, Schwartz YB, Shanower GA, Vielle A, Ahringer J, Elgin SC, Kuroda MI, Pirrotta V, Ren B, Strome S, Park PJ, Karpen GH, Hawkins RD, Lieb JD. 2011. An assessment of histone‐modification antibody quality. Nat Struct Mol Biol 18:91–93. - PMC - PubMed
-
- Grun D, van Oudenaarden A. 2015. Design and analysis of single‐cell sequencing experiments. Cell 163:799–810. - PubMed
MeSH terms
Substances
LinkOut - more resources
Full Text Sources
Other Literature Sources
