. 2016 May 18;11(5):e0155408.
doi: 10.1371/journal.pone.0155408. eCollection 2016.

Trib2 Suppresses Tumor Initiation in Notch-Driven T-ALL

Affiliations

Trib2 Suppresses Tumor Initiation in Notch-Driven T-ALL

Sarah J Stein et al. PLoS One. .

Abstract

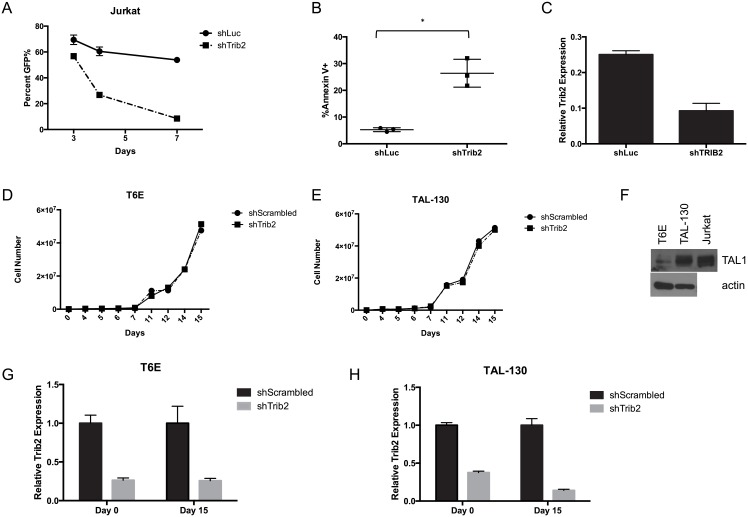
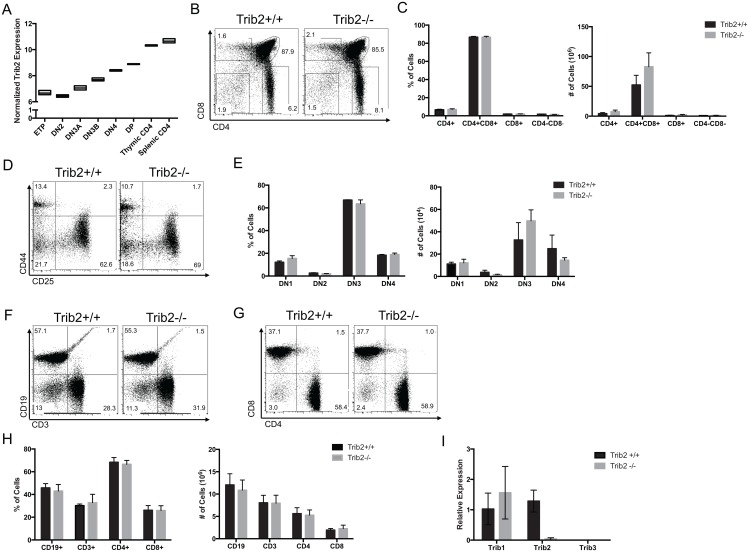
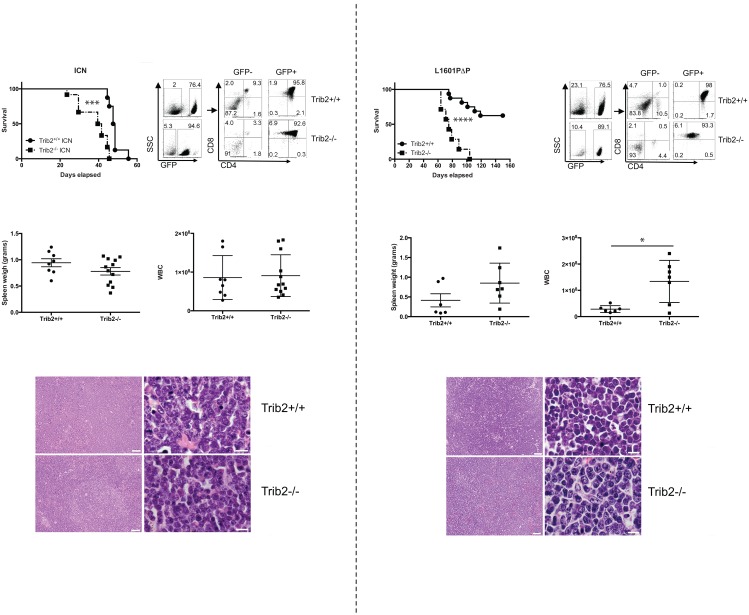
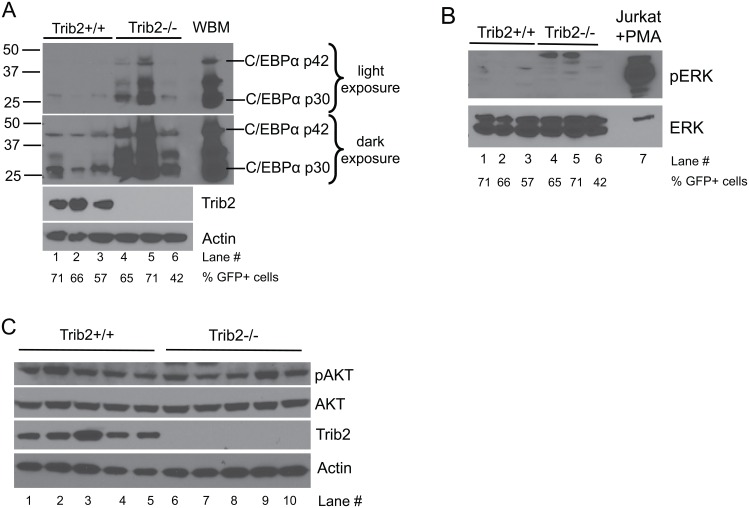
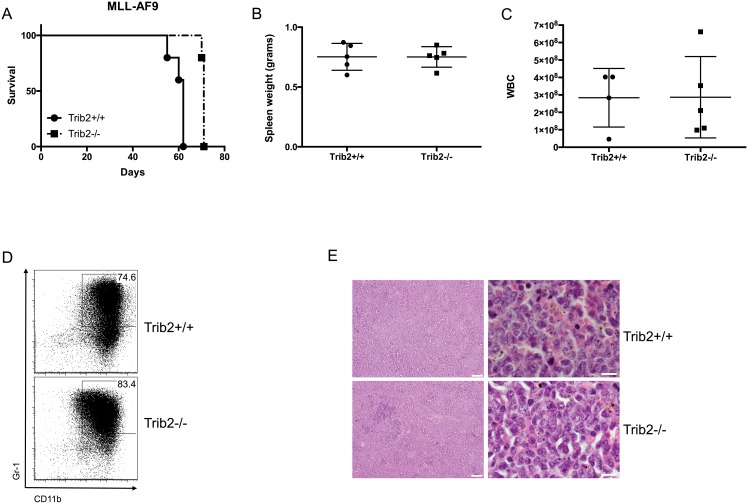
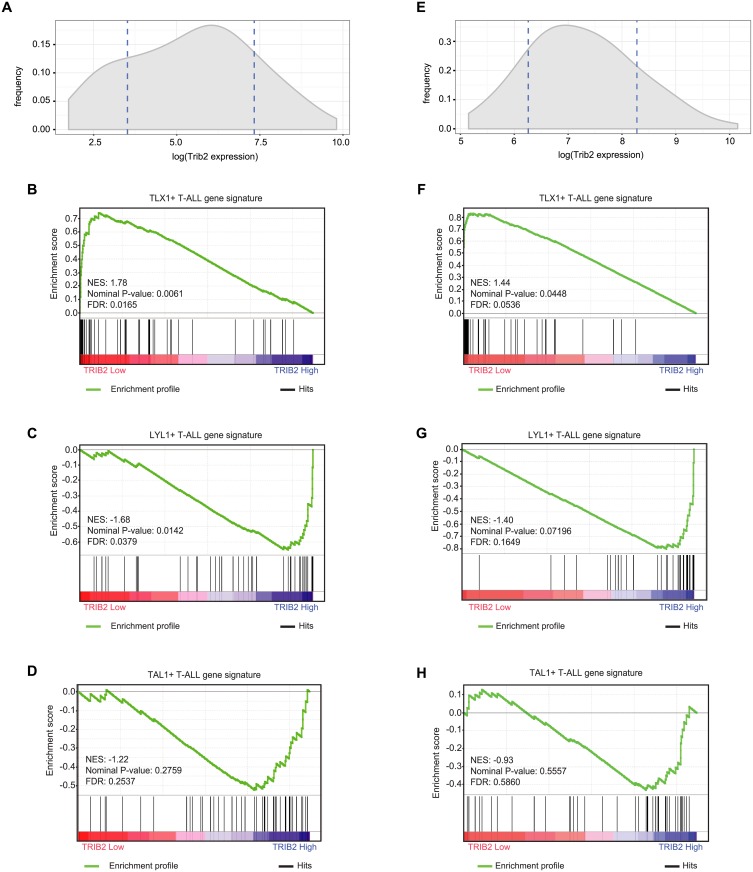
Trib2 is highly expressed in human T cell acute lymphoblastic leukemia (T-ALL) and is a direct transcriptional target of the oncogenic drivers Notch and TAL1. In human TAL1-driven T-ALL cell lines, Trib2 is proposed to function as an important survival factor, but there is limited information about the role of Trib2 in primary T-ALL. In this study, we investigated the role of Trib2 in the initiation and maintenance of Notch-dependent T-ALL. Trib2 had no effect on the growth and survival of murine T-ALL cell lines in vitro when expression was blocked by shRNAs. To test the function of Trib2 on leukemogenesis in vivo, we generated Trib2 knockout mice. Mice were born at the expected Mendelian frequencies without gross developmental anomalies. Adult mice did not develop pathology or shortened survival, and hematopoiesis, including T cell development, was unperturbed. Using a retroviral model of Notch-induced T-ALL, deletion of Trib2 unexpectedly decreased the latency and increased the penetrance of T-ALL development in vivo. Immunoblotting of primary murine T-ALL cells showed that the absence of Trib2 increased C/EBPα expression, a known regulator of cell proliferation, and did not alter AKT or ERK phosphorylation. Although Trib2 was suggested to be highly expressed in T-ALL, transcriptomic analysis of two independent T-ALL cohorts showed that low Trib2 expression correlated with the TLX1-expressing cortical mature T-ALL subtype, whereas high Trib2 expression correlated with the LYL1-expressing early immature T-ALL subtype. These data indicate that Trib2 has a complex role in the pathogenesis of Notch-driven T-ALL, which may vary between different T-ALL subtypes.


Conflict of interest statement

Competing Interests: The authors have declared that no competing interests exist.

Figures

Fig 1
Fig 1. Trib2 is not required to maintain murine T-ALL cell lines.
Jurkat cells were transduced with normalized viral particles to express shRNAs against Luciferase (shLuc) or Trib2 (shTrib2) along with a GFP reporter. A) The percentage of GFP+ cells within the population was monitored for 7 days post-infection. B) At 3 days post-transduction, apoptosis was measured by Annexin V staining (“*”, p = 0.018) and C) Trib2 expression was measured by qPCR 3 days post-transduction in sorted GFP+ cells. Errors bars represent the standard deviation of biological replicates. D) T6E cells were transduced with shRNAs against a scrambled sequence (shScrambled) or Trib2 (shTrib2) and GFP as a surrogate marker. GFP+ cells were sorted 48 hours after transduction (day 0) and growth was monitored. E) TAL-130 cells were transduced with shRNAs against a scrambled sequence (shScrambled) or Trib2 (shTrib2) and GFP as a surrogate marker. GFP+ cells were sorted 48 hours after transduction (day 0) and growth was monitored. F) TAL1 expression was measured in T6E and TAL-130 cells by immunoblot. Jurkat lysates were used as a positive control. G & H) Trib2 expression was measured at days 0 and 15 in T6E (Panel G) or TAL-130 cells (Panel H). Error bars indicate standard deviation. Data are representative of 3 experiments.
Fig 2
Fig 2. Generation and characterization of Trib2 null mice.
A) The targeting strategy to delete Trib2 exon 2 is shown. B) The deletion of the targeted region is shown by PCR performed on tail genomic DNA. C) qPCR; and D) immunoblot showing the deletion of Trib2 mRNA and protein in mouse thymocytes. Error bars indicate standard deviation.
Fig 3
Fig 3. Deletion of Trib2 does not affect T cell development.
A) Levels of Trib2 expression throughout T cell development as determined in the Immgen microarray data set are shown. B) Thymic subsets were analyzed by flow cytometry for CD4 and CD8 expression. Representative scatter plots (B) and C) graphs depicting the absolute numbers and percentages of cells in the total population are shown (n = 5–6 mice per group). D) CD4CD8 double negative thymocytes were further assessed for the surface expression of CD44 and CD25. Representative scatter plots and E) graphs depicting the percentages and absolute numbers of cells in the total population are shown (n = 3 mice per group). F) The surface expression of CD3 and CD19, and G) CD4 and CD8 on splenocytes was assessed (n = 6 mice per group). H) Representative scatter plots and graphs depicting the percentages and absolute numbers of cells in the total splenocyte population are shown (n = 6 mice per group). Error bars indicate standard deviation. I) The expression of Trib1 and Trib3 were measured by qPCR (n = 3 per group).
Fig 4
Fig 4. Loss of Trib2 decreases disease latency of Notch-driven T-ALL.
A) Kaplan-Meier curve of lethally irradiated mice reconstituted with Trib2+/+ or Trib2-/- cells expressing intracellular Notch1 (ICN; “***”, p = 0.0002). Mice with a body condition score of ≤2 and decreased mobility were euthanized (n = 8 Trib2+/+ and n = 12 Trib2-/- recipients. B) Flow cytometry was used to assess the immunophenotype of leukemic cells in the spleen. C) Spleen weights and D) WBC of moribund mice are shown. E) Representative H&E staining of spleens harvested from moribund mice (left panels, 10X magnification, scale bar = 50μM; right panels, 100X magnification, scale bar = 10μM). F) Kaplan-Meier curve of lethally irradiated mice reconstituted with Trib2+/+ or Trib2-/- cells expressing the weakly oncogenic Notch mutant, Notch 1 L1601PΔP (“****”, p<0.0001), (n = 16 Trib2+/+ and n = 7 Trib2-/- recipients). G) Flow cytometry was used to assess the immunophenotype of leukemic cells in the spleen. H) Spleen weights and I) WBC of moribund mice are shown (“*”, p = 0.013). J) H&E staining of spleens from moribund mice (left panels, 10X magnification, scale bar = 50μM; right panels, 100X magnification, scale bar = 10μM).
Fig 5
Fig 5. C/EBPα expression increases in the absence of Trib2 in primary tumor cells expressing oncogenic Notch.
Immunoblotting was used to visualize A) the expression of C/EBPα, and B) the phosphorylation status of ERK in Trib2+/+ or Trib2-/- splenocytes of moribund mice. Percentage of GFP+ cells in each sample; Lane 1: 71, Lane 2: 66, Lane 3: 57, Lane 4: 65, Lane 5: 71, Lane 6: 42. Whole bone marrow (WBM) (A) or Jurkat cells stimulated with PMA (B) were used as controls. In Panel A, lighter and darker exposures are provided. C) The phosphorylation status of AKT (pS473 AKT) was determined by immunoblot in GFP+ sorted splenocytes from moribund mice.
Fig 6
Fig 6. Trib2 does not suppress the initiation of MLL-AF9-driven myeloid leukemia.
A) Kaplan-Meier curve of lethally irradiated mice reconstituted with Trib2+/+ or Trib2-/- cells expressing MLL-AF9. Mice with a body condition score of ≤2 and decreased mobility were euthanized (n = 5 per group). B) Spleen weights and C) WBC of moribund mice are shown. D) Flow cytometry was used to assess the immunophenotype of leukemic cells in the spleen. E) H&E staining of spleens harvested from moribund mice (left panels, 10X magnification, scale bar = 50μM; right panels, 100X magnification, scale bar = 10μM).
Fig 7
Fig 7. TRIB2 expression correlates with the gene signatures of human early immature and cortical mature T-ALL subtypes.
A) Adult T-ALL samples with low (mean-SD) and high (mean+SD) TRIB2 gene expression (average of 202478_at and 202470_s_at) were identified in the GSE13159 dataset. Dashed lines indicate mean-SD and mean+SD of TRIB2 gene expression. B, C) GSEA analysis shows enrichment of gene signatures of the TLX1+ (B) and LYL1+ (C), but not TAL1+ (D), adult T-ALL molecular subtypes in samples with low and high TRIB2 expression, respectively (FDR < 0.05). E) Pediatric T-ALL samples with low (mean-SD and high (mean+SD) TRIB2 gene expression (average of 202478_at and 202470_s_at) were identified in the GSE26713 dataset. Dashed lines indicate mean-SD and mean+SD of TRIB2 gene expression. F, G) GSEA analysis shows enrichment of gene signatures of the TLX1+ (F) and LYL1+ (G), but not TAL1+ (H), pediatric T-ALL molecular subtypes in samples with low and high TRIB2 expression, respectively (FDR < 0.05). NES, normalized enrichment score.

References

    1. Van Vlierberghe P, Ferrando A. The molecular basis of T cell acute lymphoblastic leukemia. J Clin Invest. 2012;122:3398–406. 10.1172/JCI61269 - DOI - PMC - PubMed
    1. Weng AP, Ferrando AA, Lee W, Morris JPt, Silverman LB, Sanchez-Irizarry C, et al. Activating mutations of NOTCH1 in human T cell acute lymphoblastic leukemia. Science. 2004;306:269–71. - PubMed
    1. Cullion K, Draheim KM, Hermance N, Tammam J, Sharma VM, Ware C, et al. Targeting the Notch1 and mTOR pathways in a mouse T-ALL model. Blood. 2009;113:6172–81. 10.1182/blood-2008-02-136762 - DOI - PMC - PubMed
    1. Tatarek J, Cullion K, Ashworth T, Gerstein R, Aster JC, Kelliher MA. Notch1 inhibition targets the leukemia-initiating cells in a Tal1/Lmo2 mouse model of T-ALL. Blood. 2011;118:1579–90. 10.1182/blood-2010-08-300343 - DOI - PMC - PubMed
    1. Tosello V, Ferrando AA. The NOTCH signaling pathway: role in the pathogenesis of T-cell acute lymphoblastic leukemia and implication for therapy. Ther Adv Hematol. 2013;4:199–210. 10.1177/2040620712471368 - DOI - PMC - PubMed

MeSH terms

Substances