. 2016 Jun 21;7(25):37773-37789.
doi: 10.18632/oncotarget.9329.

Crosstalk between the HIF-1 and Toll-like receptor/nuclear factor-κB pathways in the oral squamous cell carcinoma microenvironment

Affiliations

Crosstalk between the HIF-1 and Toll-like receptor/nuclear factor-κB pathways in the oral squamous cell carcinoma microenvironment

Shengwei Han et al. Oncotarget. .

Abstract

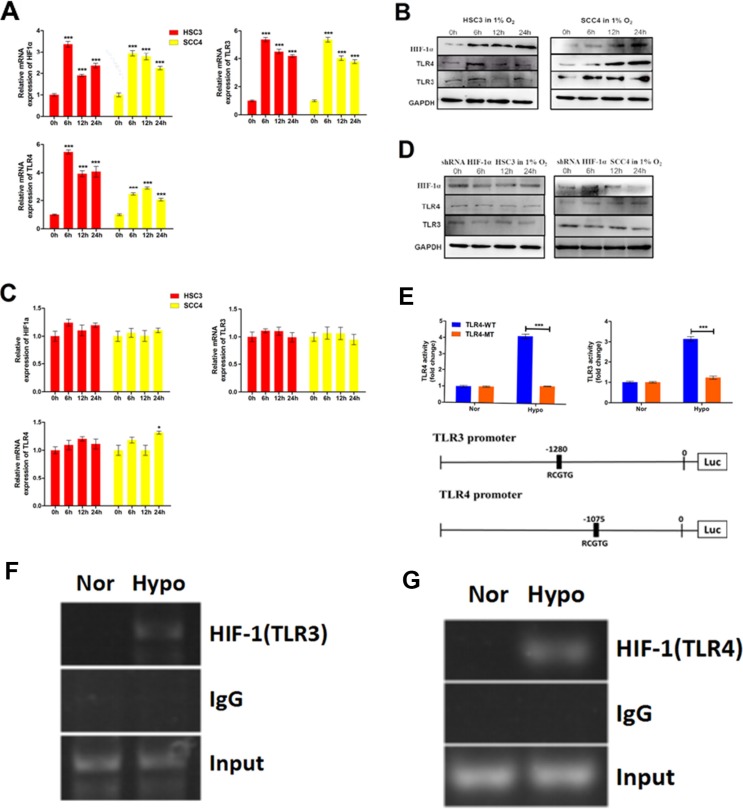
Hypoxia is a prominent feature of the microenvironment of solid tumors and may contribute to tumor progression through the oxygen-sensitive transcriptional regulator hypoxia-inducible factor-1 (HIF-1). Chronic inflammation is another typical feature. Inflammatory mediators, including Toll-like receptors (TLRs) and nuclear factor-κB (NF-κB), play an important role in cancer development. Recent studies have revealed extensive cross-talk between hypoxia and inflammation signaling, though the mechanisms remain unclear. Our results confirm that TLR3 and TLR4 are highly expressed in oral squamous cell carcinoma (OSCC). Activation of TLR3 and TLR4 stimulated the expression of HIF-1 through NF-κB. In addition, HIF-1 increased the expression of TLR3 and TLR4 through direct promoter binding. Thus, the TLR/NF-κB pathway forms a positive feedback loop with HIF-1. These results indicate a novel cross-talk between the TLR/NF-κB and HIF-1 signaling, which may contribute to OSCC initiation and progression. With the elucidation of this novel mechanism, it might serve as a basis for future microenvironment targeted cancer therapy.

Keywords: HIF-1; NF-κB; TLR; oral squamous cell carcinoma; tumor microenvironment.


Conflict of interest statement

None.

Figures

Figure 1
Figure 1. TLR3 and TLR4 are expressed in OSCC
(A) Relative mRNA expression of TLR2, TLR3, TLR4, TLR7, and TLR9 in the SCC4 and HSC3 OSCC cell lines. (B) Expression of TLR3 and TLR4 in HSC3 and SCC4 cells. (C) Expression of TLR3 and TLR4 in tumor tissue from OSCC patients (200×).
Figure 2
Figure 2. LPS and poly (I:C) induce HIF-1α and VEGF expression in HSC3 and SCC4 cells
(A) Relative mRNA expression of HIF1A and its target gene VEGF in HSC3 and SCC4 cells treated with 0–40 μg/mL LPS for 24 h. (B) Relative mRNA expression of HIF1A and its target gene VEGF in HSC3 and SCC4 cells treated with 10 μg/mL LPS for 0–24 h. (C) Relative mRNA expression of HIF1A and its target gene VEGF in HSC3 and SCC4 cells treated with 0–40 μg/mL poly (I:C) for 24 h. (D) Relative mRNA expression of HIF1A and its target gene VEGF in HSC3 and SCC4 cells treated with 10 μg/mL poly (I:C) for 0–24 h. Error bars indicate SE (*p ≤ 0.05; **p ≤ 0.01; ***p ≤ 0.001).
Figure 3
Figure 3. LPS and poly (I:C) induce HIF-1α and VEGF expression via TLR3 or TLR4
(A) Relative mRNA expression of HIF1A and its target gene VEGF in HSC3 and SCC4 cells transfected with 20 nM siTLR4 1332 prior to treatment with 10 μg/mL LPS. (B) Relative mRNA expression of HIF1A and its target gene VEGF in HSC3 and SCC4 cells transfected with 40 nM siTLR3 2658 prior to treatment with 10 μg/mL poly (I:C). (C) Relative mRNA expression of HIF1A and its target gene VEGF under hypoxic conditions (1% O2). Cells transfected with 20 nM siTLR4 1332 prior to treatment with 10 μg/mL LPS. (D) Relative mRNA expression of HIF1A and its target gene VEGF under hypoxic conditions (1% O2). Cells transfected with 40 nM siTLR3 2658 prior to treatment with 10 μg/mL poly(I:C) treatment. Error bars indicate SE (*p ≤ 0.05; **p ≤ 0.01; ***p ≤ 0.001). NC, negative control.
Figure 4
Figure 4. LPS and poly (I:C) induce HIF-1α and VEGF expression via the TLR-NF-κB pathway in OSCC
(A) Relative mRNA expression of p65 in HSC3 and SCC4 cells treated with 10 μg/mL LPS or poly (I:C) for 0–24 h. (B) Localization of p65 in cells treated with 10 μg/mL LPS for 2 h with or without transfection of siTLR4. Blue, nuclei; Red, p65. (C) Localization of p65 in cells treated with 10 μg/mL poly(I:C) for 2 h with or without transfection of siTLR3. Blue, nuclei; Red, p65. Error bars indicate SE (*p ≤ 0.05; **p ≤ 0.01; ***p ≤ 0.001).
Figure 5
Figure 5. The TLR-NF-κB pathway regulates HIF-1α and VEGF expression in HSC3 and SCC4 cells
(A) (Bottom) Relative mRNA expression of p65 in HSC3 and SCC4 cells transfected with different sip65 siRNAs. We selected siRNA 665 to target p65. Cells were transfected with siRNA 665 prior to stimulation with LPS or poly (I:C). (Top) Relative mRNA expression of HIF1A and VEGF in HSC3 and SCC4 cells following sip65 665 transfection. (B) Relative mRNA expression of HIF1A and VEGF in HSC3 and SCC4 cells cultured in 1% O2 for 6 h with 50 ng/mL TNF-α or 50 μM BAY 11–7082. (C) Western blot analysis of changes in HIF-1α and VEGF protein levels. (D) Relative mRNA expression of HIF1A and VEGF in HSC3 and SCC4 cells cultured in 20% O2 for 6 h with 50 ng/mL TNF-α or 50 μM BAY 11–7082. (E) VEGF protein levels in HSC3 and SCC4 cells that were treated with 10 μg/mL poly (I:C), transfected with siTLR3 or sip65, and then treated once more with 10 μg/mL poly (I:C). (F) VEGF protein levels in HSC3 and SCC4 cells that were treated with 10 μg/mL LPS, transfected with siTLR4 or sip65, and then treated once more with 10 μg/mL LPS. Error bars indicate SE (*p ≤ 0.05; **p ≤ 0.01; ***p ≤ 0.001). NC, negative control; nor, normoxic conditions; hypo, hypoxic conditions.
Figure 6
Figure 6. The TLR3 and TLR4 pathways regulate HIF-1 activity in HSC3 and SCC4 cells
(A) Three HRE sequences (3xHRE), each containing two HRE binding sites, were inserted into a pGL6-luciferase reporter plasmid. (B) Luciferase reporter assay in HSC3 and SCC4 cells transfected with the 3xHRE reporter plasmid and cultured under hypoxic conditions for 6, 12, and 24 h. (C) Luciferase reporter assay of HSC3 and SCC4 cells transfected with the 3xHRE reporter plasmid and cultured under normoxic conditions with 10 μg/mL LPS or poly (I:C) for 24 h. Error bars indicate SE (*p ≤ 0.05; **p ≤ 0.01; ***p ≤ 0.001).
Figure 7
Figure 7. Hypoxia induces TLR3 and TLR4 expression via HIF-1
(A) Relative mRNA expression of HIF1A, TLR3, and TLR4 in HSC3 and SCC4 cells cultured in 1% O2 for 6, 12, and 24 h. (B) Expression of HIF-1α, TLR3, and TLR4 in HSC3 and SCC4 cells cultured in 1% O2 for 6, 12, and 24 h. (C–D) Expression of HIF-1α, TLR3, and TLR4 mRNA (C) and protein (D) in HSC3 and SCC4 cells transfected with or without HIF-1α shRNA and cultured in 1% O2 for 6, 12, and 24 h. (E) Luciferase reporter assay in HSC3 and SCC4 cells transfected with wild-type (WT) or mutant (MT) TLR3 and TLR4 promoter luciferase reporters and cultured under 20% O2 (normoxic, nor) or 1% O2 (hypoxic, hypo) conditions for 24 h. (F) ChIP assay of the TLR3 promoter (−1280 bp). HSC3 cells were cultured in 1% O2 or 20% O2 for 24 h. (G) ChIP assay of the TLR4 promoter (−1075 bp). HSC3 cells were cultured in 1% O2 or 20% O2 for 24 h. Error bars indicate SE (*p ≤ 0.05; **p ≤ 0.01; ***p ≤ 0.001).
Figure 8
Figure 8. Hypoxia upregulates p65 and pro-inflammatory cytokine expression via HIF-1α
(A) Expression of p65 mRNA and p65 protein in HSC3 cells transfected with or without HIF-1α shRNA under normoxic (nor) or hypoxic (hypo) conditions for 24 h. (B) IL-1β, IL-6, IL-8, and IL-12p70 released by non-transfected and HIF-1α shRNA-transfected HSC3 cells cultured under normoxic (nor) or hypoxic (hypo) conditions for 4, 8, 12, and 24 h. Error bars indicate SE (*p ≤ 0.05; **p ≤ 0.01; ***p ≤ 0.001).
Figure 9
Figure 9. In vivo study of human OSCC using a transplantation model in nude mice
(A) HSC3 and sh-HIF1α HSC3 were injected into nude mice. After 30 days, tumors were collected and weighed. (B) IHC analyses of HIF1α, TLR3, and TLR4 expression in tumor tissue (200×) (*p ≤ 0.05; **p ≤ 0.01; ***p ≤ 0.001).
Figure 10
Figure 10. Model for the crosstalk between the HIF-1 and TLR-NF-κB pathways in OSCC

Similar articles

Cited by

References

    1. Warnakulasuriya S. Global epidemiology of oral and oropharyngeal cancer. Oral Oncol. 2009;45:309–316. - PubMed
    1. Warnakulasuriya S. Living with oral cancer: epidemiology with particular reference to prevalence and life-style changes that influence survival. Oral Oncol. 2010;46:407–410. - PubMed
    1. Argiris A, Karamouzis MV, Raben D, Ferris RL. Head and neck cancer. Lancet. 2008;371:1695–1709. - PMC - PubMed
    1. Nakasone ES, Askautrud HA, Kees T, Park JH, Plaks V, Ewald AJ, Fein M, Rasch MG, Tan YX, Qiu J, Park J, Sinha P, Bissell MJ, et al. Imaging tumor-stroma interactions during chemotherapy reveals contributions of the microenvironment to resistance. Cancer cell. 2012;21:488–503. - PMC - PubMed
    1. Finger EC, Giaccia AJ. Hypoxia, inflammation, and the tumor microenvironment in metastatic disease. Cancer Metastasis Rev. 2010;29:285–293. - PMC - PubMed

MeSH terms