. 2016 May 18:5:e14864.
doi: 10.7554/eLife.14864.

Compaction and segregation of sister chromatids via active loop extrusion

Affiliations

Compaction and segregation of sister chromatids via active loop extrusion

Anton Goloborodko et al. Elife. .

Abstract

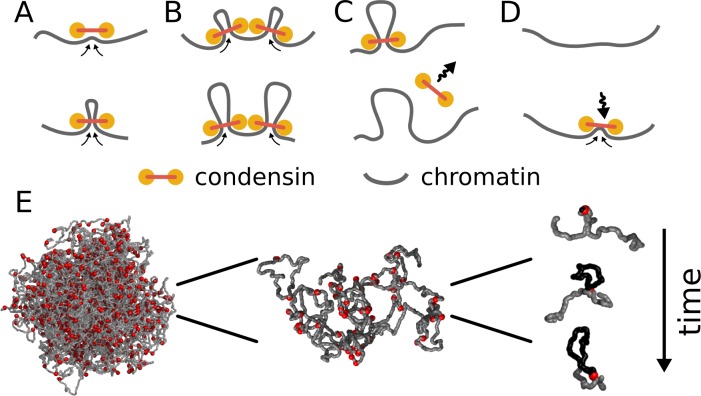
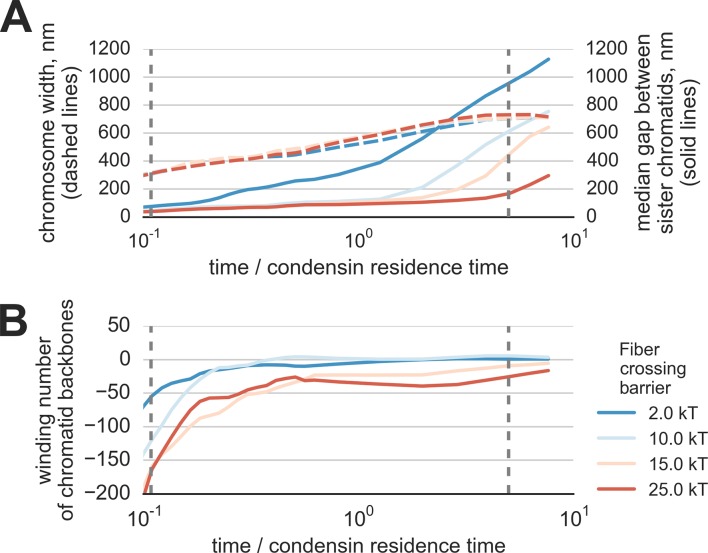
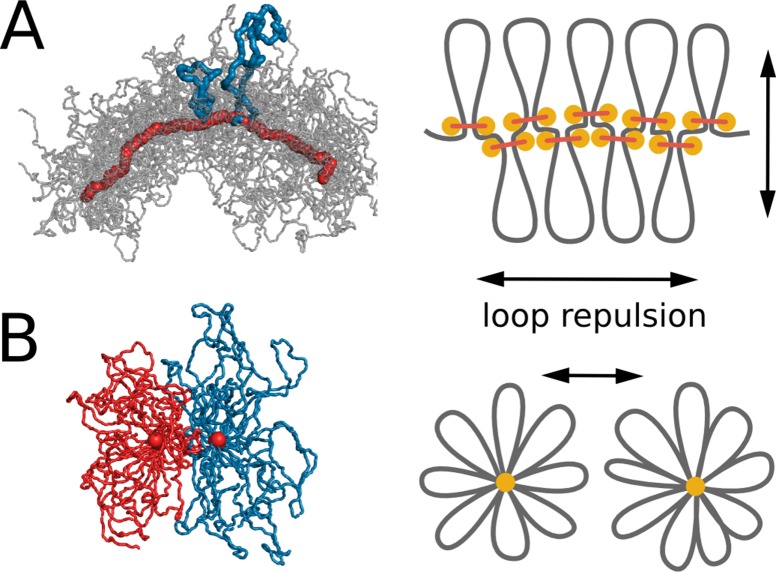
The mechanism by which chromatids and chromosomes are segregated during mitosis and meiosis is a major puzzle of biology and biophysics. Using polymer simulations of chromosome dynamics, we show that a single mechanism of loop extrusion by condensins can robustly compact, segregate and disentangle chromosomes, arriving at individualized chromatids with morphology observed in vivo. Our model resolves the paradox of topological simplification concomitant with chromosome 'condensation', and explains how enzymes a few nanometers in size are able to control chromosome geometry and topology at micron length scales. We suggest that loop extrusion is a universal mechanism of genome folding that mediates functional interactions during interphase and compacts chromosomes during mitosis.

Keywords: biophysics; chromosome; chromosomes; compaction; genes; molecular dynamics; none; polymer; simulations; structural biology.


Conflict of interest statement

The authors declare that no competing interests exist.

Figures

Figure 1.
Figure 1.. Model of loop extrusion by condensins.
Top row, the update rules used in simulations: (A) a condensin extrudes a loop by moving the two ends along the chromosome in the opposite directions, (B) collision of condensins bound to chromosomes blocks loop extrusion on the collided sides, (C) a condensin spontaneously dissociates and the loop disassembles; (D) a condensin associates at randomly chosen site and starts extruding a loop. Bottom row, (E) we use polymer simulations to study how combined action of many loop extruding condensins changes the conformation of a long chromosome. DOI: http://dx.doi.org/10.7554/eLife.14864.002
Figure 2.
Figure 2.. Loop-extruding condensins convert globular interphase chromosomes into elongated structures.
(A) Dynamics of loop array formation. Left, the fraction of the chromosome extruded into loops (loop coverage, gray) and the mean loop size (black). The time is measured in the units of condensin residence time. Data for each curve was obtained using 10 simulation replicas; the thickness of each line shows the difference between the 10th and 90th percentile at each time point. Right, a phase diagram showing loop coverage vs mean loop length. The curve is averaged over the simulation replicas and colored by log-time. Two stages of dynamics are separated by the two vertical dashed lines corresponding to 95% coverage and 95% of the steady state mean loop length. The distinction between the two stages of compaction is especially easy to see on the phase curve. (B) Dynamics of chromosome morphology. Left: chromosome length (blue) and the mean chromosome diameter (red) shown as a function of time; the thickness of each line shows the difference between the 10th and 90th percentile at each time point. Right, a phase diagram showing chromosome length vs diameter; the curve is averaged over the simulation replicas and colored by log-time. Note that most of chromosome linear compaction is achieved during the first phase, while the second is characterized by widening of the chromosome and further three-fold shortening. (C) Snapshots of polymer simulations. Top row: the conformations of chromosomes at the beginning of simulations (left), slightly before the transition between the loop formation and maturation stages (middle), and in the steady state (right). Color (rainbow: from red to blue) shows positions of individual monomers along the chain and demonstrates that loci in compacted chromosomes are arranged linearly according to their genomic location. Bottom row: same as above, with chromosomes shown in semitransparent gray and condensins as red spheres. DOI: http://dx.doi.org/10.7554/eLife.14864.004
Figure 2—figure supplement 1.
Figure 2—figure supplement 1.. The geometrical parameters of compacted chromosomes in simulations with altered parameters.
(A) Simulations with altered condensin abundance: '0.2x condensin', '0.5x condensin', '2x condensins' and '4x condensins' - simulations with 200, 500, 2000 and 4000 condensins, correspondingly. (B) Simulations with altered parameters of the chromatin fiber and condensins: 'Stiffer fiber' – simulations with 2x bending energy of the fiber, 'softer fiber' – simulations with 0.5x bending energy; 'wide condensins' – simulations with increased spacing between condensins at loop bases; '10 nm fiber' - simulations with reduced linear DNA of the fiber; '30 nm fiber' – simulations with increased linear DNA density of the fiber and increased fiber thickness. The vertical gray lines show the experimental observations on the linear density of DNA along the human prophase chromosome I (6.25 kb/nm) and chromosome XXII (5.0 kb/nm) (Yunis, 1981). The horizontal gray lines show the experimental data on the diameter of prophase chromosomes: 400 nm (Kireeva et al., 2004), 600 nm (Sarkar et al., 2002) and 679 nm (el-Alfy and Leblond, 1989). DOI: http://dx.doi.org/10.7554/eLife.14864.005
Figure 3.
Figure 3.. Segregation and disentanglement of sister chromatids.
(A) The median separation between condensin-rich axes of two sister chromosomes (blue) and the mean chromosome diameter (red) as a function of time, measured in condensin residence times, as above. The blue band shows the range between 25th and 75th percentile across 10 simulation replicas at each time point; the light blue shows 10%--90% range. (B) Entanglement of sister chromatids measured by the linking number of the condensin cores of sister chromatids; the blue bands show variability between simulation replicas, same as above. (C) Conformations of two sister chromatids in the polymer simulations (shown in red and blue) illustrate the observed segregation and disentanglement. DOI: http://dx.doi.org/10.7554/eLife.14864.007
Figure 3—figure supplement 1.
Figure 3—figure supplement 1.. Segregation and disentanglement of sister chromatids in simulations with reduced Topo II concentration.
(A) The median separation between condensin-rich axes of two sister chromosomes (solid lines) and the mean chromosome diameter (red) as a function of time, measured in condensin residence times, as above. Depletion of topo II was simulated by a simultaneous increase of the energy barrier of fiber overlap (shown by the line color) and a 3x increase in of the radius of repulsion. (B) Entanglement of sister chromatids in simulations of topo II depletion, measured by the linking number of the condensin cores of sister chromatids. DOI: http://dx.doi.org/10.7554/eLife.14864.008
Figure 4.
Figure 4.. Steric repulsion between chromatin loops shapes the compacted chromosomes and leads to segregation of sister chromatids.
(A) Left, conformation of a single chromosome with chromatin fiber shown in semitransparent gray and condensins shown in red; two loops are highlighted with blue. Right: the diagram showing that loop repulsion straightens chromosomal cores and extends individual loops radially. (B) Left, cross section of two parallel loop brushes placed at a short distance from each other. Right, the diagram shows that steric interactions between loops of sister chromatids lead to chromatid repulsion and segregation. DOI: http://dx.doi.org/10.7554/eLife.14864.015

References

    1. Alipour E, Marko JF. Self-organization of domain structures by DNA-loop-extruding enzymes. Nucleic Acids Research. 2012;40:11202–11212. doi: 10.1093/nar/gks925. - DOI - PMC - PubMed
    1. Ball RC, Marko JF, Milner ST, Witten TA. Polymers grafted to a convex surface. Macromolecules. 1991;24:693–703. doi: 10.1021/ma00003a011. - DOI
    1. Birshtein TM, Borisov OV, Zhulina YB, Khokhlov AR, Yurasova TA. Conformations of comb-like macromolecules. Polymer Science U.S.S.R. 1987;29:1293–1300. doi: 10.1016/0032-3950(87)90374-1. - DOI
    1. Cheng TMK, Heeger S, Chaleil RAG, Matthews N, Stewart A, Wright J, Lim C, Bates PA, Uhlmann F. A simple biophysical model emulates budding yeast chromosome condensation. eLife. 2015;4 doi: 10.7554/eLife.05565. - DOI - PMC - PubMed
    1. Dietzel S, Belmont AS. Reproducible but dynamic positioning of DNA in chromosomes during mitosis. Nature Cell Biology. 2001;3:767–770. doi: 10.1038/35087089. - DOI - PubMed

Publication types