. 2017 Apr;37(4):1199-1212.
doi: 10.1177/0271678X16650216. Epub 2016 Jan 1.

PPAR-α, a lipid-sensing transcription factor, regulates blood-brain barrier efflux transporter expression

Affiliations

PPAR-α, a lipid-sensing transcription factor, regulates blood-brain barrier efflux transporter expression

Vijay R More et al. J Cereb Blood Flow Metab. 2017 Apr.

Abstract

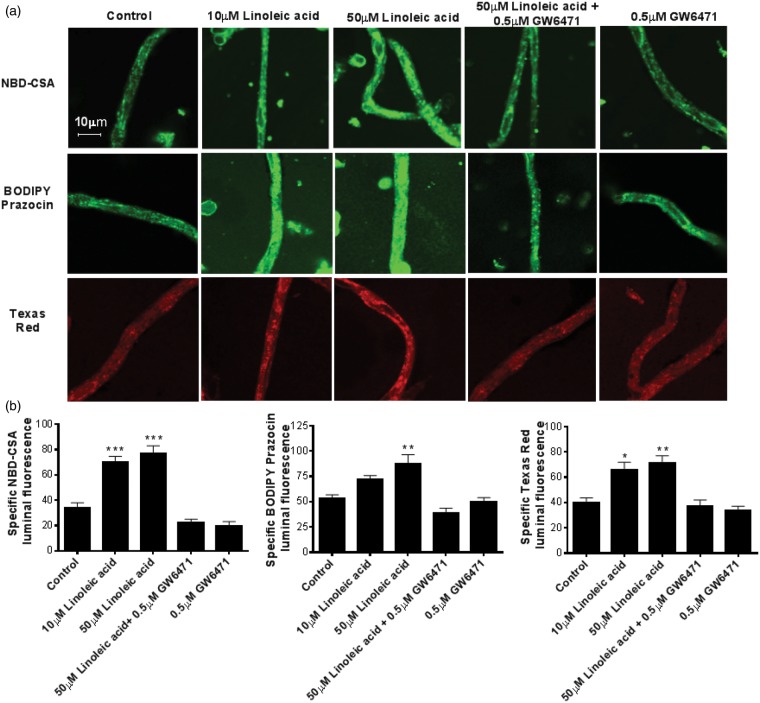
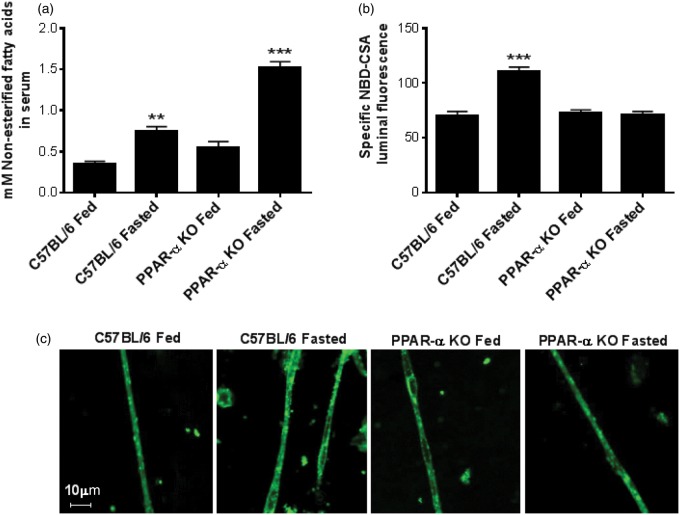
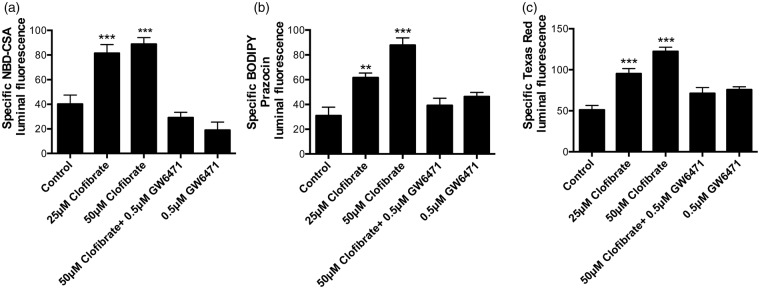
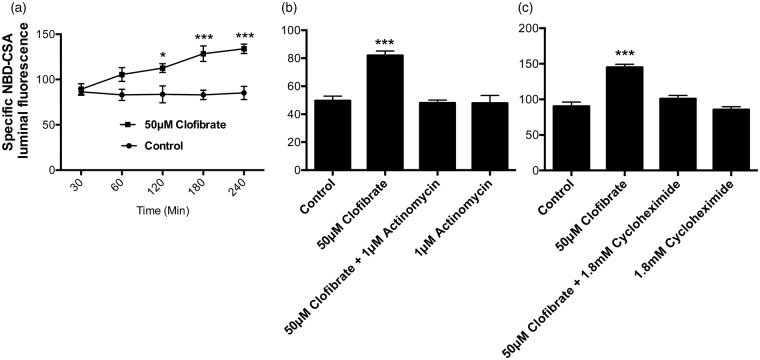
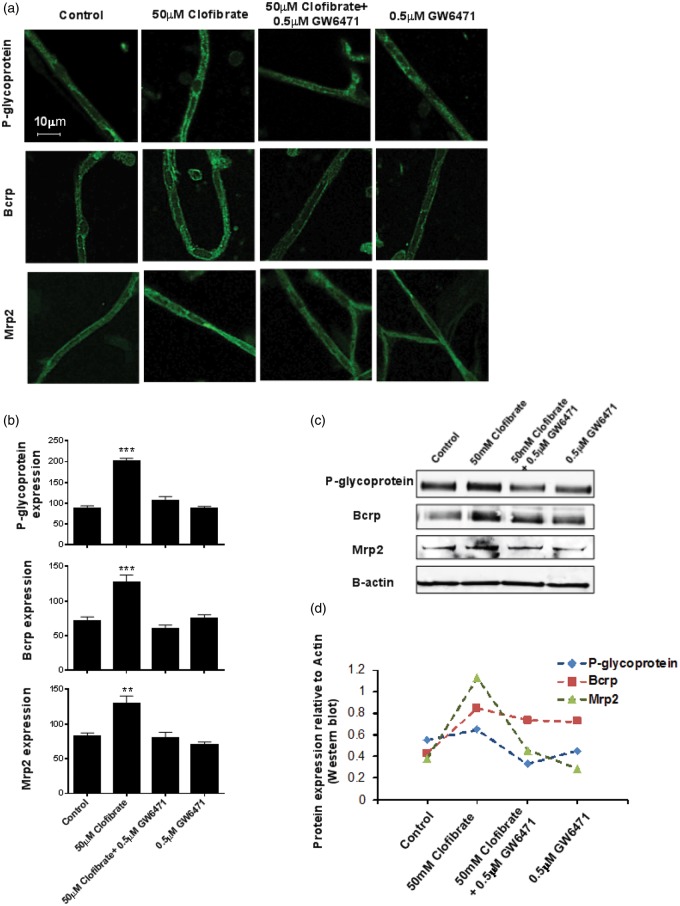
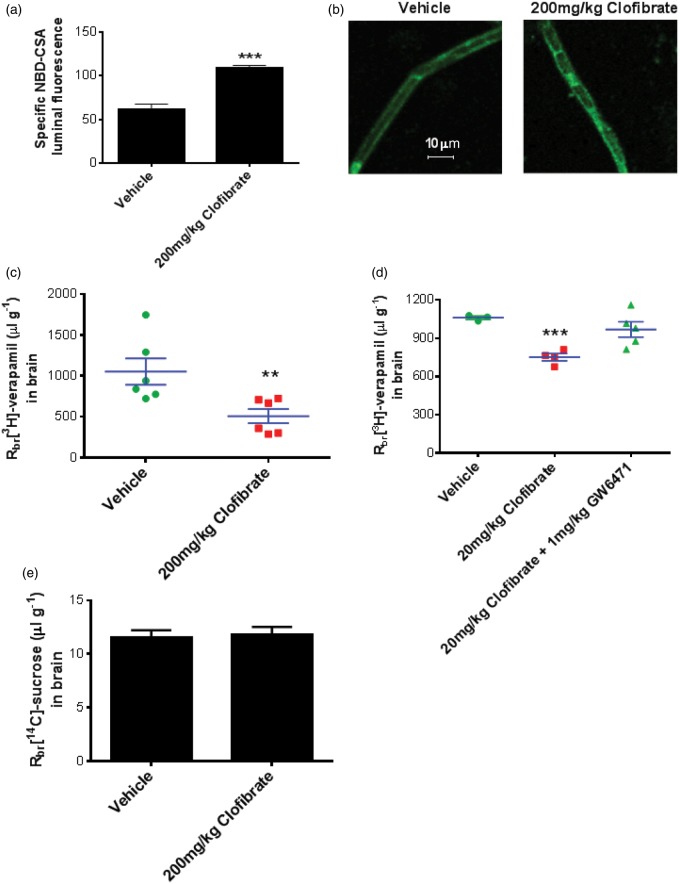
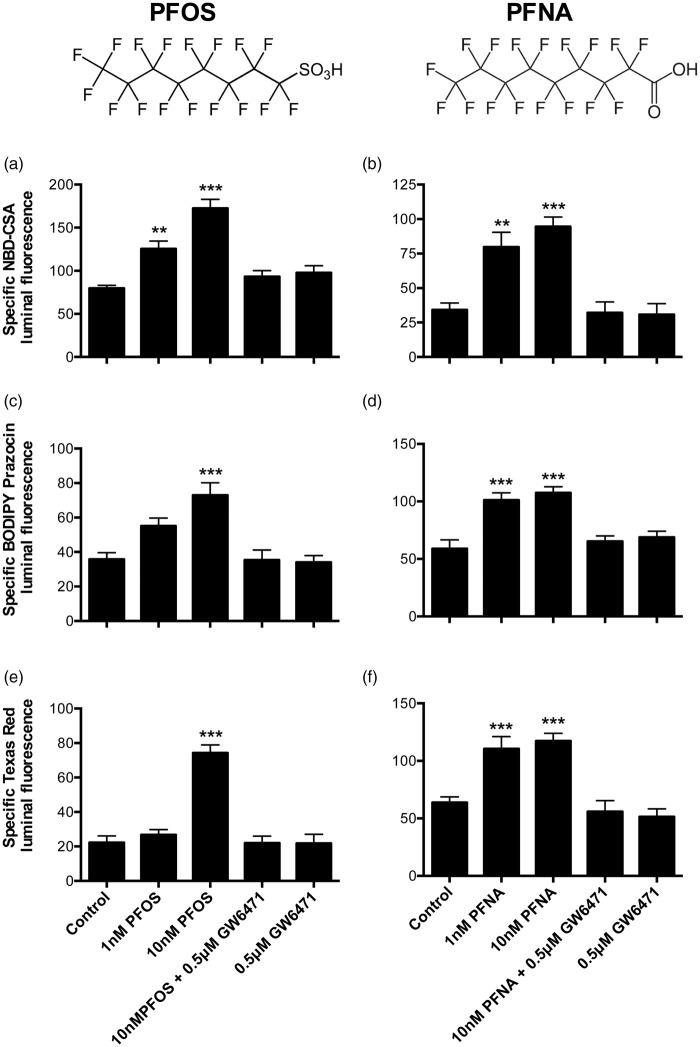
Lipid sensor peroxisome proliferator-activated receptor alpha (PPAR- α) is the master regulator of lipid metabolism. Dietary release of endogenous free fatty acids, fibrates, and certain persistent environmental pollutants, e.g. perfluoroalkyl fire-fighting foam components, are peroxisome proliferator-activated receptor alpha ligands. Here, we define a role for peroxisome proliferator-activated receptor alpha in regulating the expression of three ATP-driven drug efflux transporters at the rat and mouse blood-brain barriers: P-glycoprotein (Abcb1), breast cancer resistance protein (Bcrp/Abcg2), and multidrug resistance-associated protein 2 (Mrp2/Abcc2). Exposing isolated rat brain capillaries to linoleic acid, clofibrate, or PKAs increased the transport activity and protein expression of the three ABC transporters. These effects were blocked by the PPAR- α antagonist, GW6471. Dosing rats with 20 mg/kg or 200 mg/kg of clofibrate decreased the brain accumulation of the P-glycoprotein substrate, verapamil, by 50% (in situ brain perfusion; effects blocked by GW6471) and increased P-glycoprotein expression and activity in capillaries ex vivo. Fasting C57Bl/6 wild-type mice for 24 h increased both serum lipids and brain capillary P-glycoprotein transport activity. Fasting did not alter P-glycoprotein activity in PPAR- α knockout mice. These results indicate that hyperlipidemia, lipid-lowering fibrates and exposure to certain fire-fighting foam components activate blood-brain barrier peroxisome proliferator-activated receptor alpha, increase drug efflux transporter expression and reduce drug delivery to the brain.

Keywords: Blood–brain barrier; P-glycoprotein; PPAR; fasting; fibrate.


Figures

Figure 1.
Figure 1.
Linoleic acid upregulates transport activity of P-glycoprotein, Bcrp, and Mrp2 in rat brain capillaries. (a) Representative capillary images. Rat brain capillaries were treated with 10 and 50 μM BSA-conjugated linoleic acid for 4 h, followed by transport assay using fluorescent substrates NBD-CSA (P-glycoprotein), BODIPY Prazosin (Bcrp) and Texas Red (Mrp2). (b) Graphs represent mean fluorescence accumulation ± SEM for minimum of 10 capillaries from each group. All the values were normalized to transporter-specific inhibitor for negative control. Capillaries pre-incubated with GW6471 were used to demonstrate involvement of PPAR-α in transporter induction. Data are expressed as mean ± SE. Differences between means were deemed statistically significant when P < 0.05 using one-way ANOVA with a Tukey–Kramer post hoc test (for multiple comparisons). ***p < 0.001, significantly higher than control; **p < 0.01, significantly higher than control.
Figure 2.
Figure 2.
Effect of 24 h fasting on serum lipids and brain capillary P-glycoprotein function in C57Bl/6 and PPAR-α KO mice. (a) Age and weight matched C57Bl/6 and PPAR-α KO mice (n=5 per group, individually housed) were fasted for 24 h with ad libitum access to water. Serum collected from these mice was used for non-esterified free fatty acid (NEFA) quantification. (b) After 24 h fasting, brains from C57BL/6 and PPAR-α KO mice (n=5 per group) were used for capillary isolation and analyzing P-glycoprotein transport activity ex vivo using fluorescent substrate NBD-CSA. All the values were normalized to P-glycoprotein specific inhibitor PSC833 for negative control. Individual bars in the graph represent mean fluorescence accumulation ± SEM for minimum of 10 capillaries from each group. (c) Representative capillary images from C57BL/6 and PPAR-α KO mice fasting experiment. Data are expressed as mean ± SE. Differences between means were deemed statistically significant when p < 0.05 using one-way ANOVA with a Tukey–Kramer post hoc test (for multiple comparisons). ***p < 0.001, significantly higher than control; **p < 0.01, significantly higher than control.
Figure 3.
Figure 3.
Clofibrate increases transport activity of P-glycoprotein, Bcrp, and Mrp2 in rat brain capillaries. Rat brain capillaries were treated with 25 and 50 μM clofibrate for 4 h, followed by transport assay using fluorescent substrates. (a) NBD-CSA (P-glycoprotein), (b) BODIPY Prazosin (Bcrp) and (c) Texas Red (Mrp2). Graphs represent mean fluorescence accumulation ± SEM for minimum of 10 capillaries from each group. All the values were normalized to transporter-specific inhibitor for negative control. Capillaries pre-incubated with GW6471 for 45 min were used to demonstrate involvement of PPAR-α in transporter induction. Data are expressed as mean ± SE. Differences between means were deemed statistically significant when p < 0.05 using one-way ANOVA with a Tukey–Kramer post hoc test (for multiple comparisons). ***p < 0.001, significantly higher than control; **p < 0.01, significantly higher than control.
Figure 4.
Figure 4.
Clofibrate exposure induces P-glycoprotein transport activity in rat brain capillaries in time and transcription-translation dependent manner. (a) Rat brain capillaries were exposed to clofibrate for 30 to 240 min, followed by P-glycoprotein transport activity assay using fluorescent NBD-CSA. (b) Rat brain capillaries were pre-incubated with transcriptional inhibitor actinomycin or (c) translational inhibitor cycloheximide prior to clofibrate incubation for 4 h. Luminal NBD-CSA accumulation was observed as an indicator of P-glycoprotein transport in these capillaries in vitro. All the data points represent mean fluorescence accumulation ± SEM for minimum of 10 capillaries from each group. The values were normalized to transporter-specific inhibitor PSC833. Capillaries pre-incubated with GW6471 for 45 min were used to demonstrate involvement of PPAR-α in transporter induction. Data are expressed as mean ± SE. Differences between means were deemed statistically significant when p < 0.05 using one-way ANOVA with a Tukey–Kramer post hoc test (for multiple comparisons). ***p < 0.001, significantly higher than control; *p < 0.05, significantly higher than control.
Figure 5.
Figure 5.
Clofibrate increases protein expression of P-glycoprotein, Bcrp, and Mrp2 in rat brain capillaries. (a) After exposing rat brain capillaries to 25 and 50 μM clofibrate for 4h, we fixed them with paraformaldehyde-glutaraldehyde mixture, permeabilized with triton X, and subjected to immunohistochemical staining for P-glycoprotein, Bcrp, and Mrp2 using specific primary and fluorescent secondary antibodies. Ten or more confocal images were captured per group and representative images are displayed here. Capillaries pre-incubated with GW6471 for 45 min were used to demonstrate involvement of PPAR-α in transporter induction. (b) Quantification of intensity of membrane fluorescence from the transporter immunostained capillaries, minimum of 10 capillaries per group. Data are expressed as mean ± SE. Differences between means were deemed statistically significant when p < 0.05 using one-way ANOVA with a Tukey–Kramer post hoc test (for multiple comparisons). (c) Membrane fractions were isolated from rat brain capillaries exposed to 25 and 50 μM clofibrate for 4 h. The proteins were separated on SDS-PAGE gels and immunoblotted for P-glycoprotein, Bcrp, and Mrp2 using transporter-specific antibodies. (d) Western blots were quantified and values were normalized to actin expression.
Figure 6.
Figure 6.
Clofibrate dosing to rats increases P-glycoprotein activity and expression and reduces drug delivery to the brain. (a) Rats were dosed with 1% aqueous tween-80 (vehicle) or 200 mg/kg clofibrate (i.p., four days, n=5 per group), followed by brain capillary isolation to analyze P-glycoprotein transport activity ex vivo. (b) Capillaries isolated from brains of the rats dosed with 1% aqueous tween-80 (vehicle) or 200 mg/kg clofibrate (i.p., four days, n=5 per group) were subjected to immunohistochemical staining for P-glycoprotein. Representative confocal images are displayed here. (c) After four days of dosing with 1% aqueous tween-80 (vehicle) or 200 mg/kg clofibrate (i.p., four days, n=5 per group), rats were used for in situ brain perfusion. Brain penetration of [3H] verapamil was studied by quantifying radioactivity in brain tissue following in situ perfusion. (d) Rats were dosed with 1% aqueous tween-80 (vehicle) or 20 mg/kg clofibrate or 20 mg/kg clofibrate with 1 mg/kg GW6471 (oral gavage, 10 days, n=5 per group). Rats were subjected to in situ brain perfusion using [3H] verapamil or (E) [14C] sucrose. Data are expressed as mean ± SE. Differences between means were deemed statistically significant when p < 0.05 using one-way ANOVA with a Tukey–Kramer post hoc test (for multiple comparisons). ***p < 0.001, significantly different compared to vehicle; **p < 0.01, significantly different compared to vehicle.
Figure 7.
Figure 7.
Perfluorooctane sulfonate (PFOS) and perfluorononanoic acid (PFNA) increase transport activity of P-glycoprotein, Bcrp, and Mrp2 in rat brain capillaries. Rat brain capillaries were treated with 1 and 10 nM PFOS or PFNA for 4 h, followed by transport assay using fluorescent substrates. (a, b) NBD-CSA (P-glycoprotein), (c, d) BODIPY Prazosin (Bcrp), and (e, f) Texas Red (Mrp2). Graphs represent mean fluorescence accumulation ± SEM for minimum of 10 capillaries from each group. All the values were normalized to transporter-specific inhibitor for negative control. Capillaries pre-incubated with GW6471 for 45 min were used to demonstrate involvement of PPAR-α in transporter induction. Data are expressed as mean ± SE. Differences between means were deemed statistically significant when p < 0.05 using one-way ANOVA with a Tukey–Kramer post hoc test (for multiple comparisons). ***p < 0.001, significantly higher than control; **p < 0.01, significantly higher than control.

Similar articles

Cited by

References

    1. Crone C, Christensen O. Electrical resistance of a capillary endothelium. J Gen Physiol 1981; 77: 349–371. - PMC - PubMed
    1. Butt AM, Jones HC, Abbott NJ. Electrical resistance across the blood-brain barrier in anaesthetized rats: a developmental study. J Physiol 1990; 429: 47–62. - PMC - PubMed
    1. Miller DS, Nobmann SN, Gutmann H, et al. Xenobiotic transport across isolated brain microvessels studied by confocal microscopy. Mol Pharmacol 2000; 58: 1357–1367. - PubMed
    1. Hawkins BT, Rigor RR, Miller DS. Rapid loss of blood-brain barrier P-glycoprotein activity through transporter internalization demonstrated using a novel in situ proteolysis protection assay. J Cereb Blood Flow Metab 2010; 30: 1593–1597. - PMC - PubMed
    1. Hartz AM, Bauer B, Fricker G, Miller DS. Rapid regulation of P-glycoprotein at the blood-brain barrier by endothelin-1. Mol Pharmacol 2004; 66: 387–394. - PubMed

MeSH terms

LinkOut - more resources