. 2017 Mar;37(3):1014-1029.
doi: 10.1177/0271678X16649402. Epub 2016 Jul 20.

Aging-related alterations in eNOS and nNOS responsiveness and smooth muscle reactivity of murine basilar arteries are modulated by apocynin and phosphorylation of myosin phosphatase targeting subunit-1

Affiliations

Aging-related alterations in eNOS and nNOS responsiveness and smooth muscle reactivity of murine basilar arteries are modulated by apocynin and phosphorylation of myosin phosphatase targeting subunit-1

Lubomir T Lubomirov et al. J Cereb Blood Flow Metab. 2017 Mar.

Abstract

Aging causes major alterations of all components of the neurovascular unit and compromises brain blood supply. Here, we tested how aging affects vascular reactivity in basilar arteries from young (<10 weeks; y-BA), old (>22 months; o-BA) and old (>22 months) heterozygous MYPT1-T-696A/+ knock-in mice. In isometrically mounted o-BA, media thickness was increased by ∼10% while the passive length tension relations were not altered. Endothelial denudation or pan-NOS inhibition (100 µmol/L L-NAME) increased the basal tone by 11% in y-BA and 23% in o-BA, while inhibition of nNOS (1 µmol/L L-NPA) induced ∼10% increase in both ages. eNOS expression was ∼2-fold higher in o-BA. In o-BA, U46619-induced force was augmented (pEC50 ∼6.9 vs. pEC50 ∼6.5) while responsiveness to DEA-NONOate, electrical field stimulation or nicotine was decreased. Basal phosphorylation of MLC20-S19 and MYPT1-T-853 was higher in o-BA and was reversed by apocynin. Furthermore, permeabilized o-BA showed enhanced Ca2+-sensitivity. Old T-696A/+ BA displayed a reduced phosphorylation of MYPT1-T696 and MLC20, a lower basal tone in response to L-NAME and a reduced eNOS expression. The results indicate that the vascular hypercontractility found in o-BA is mediated by inhibition of MLCP and is partially compensated by an upregulation of endothelial NO release.

Keywords: Aging; MYPT1-T696 gene mutation; actin dynamics; basilar artery; neurovascular uncoupling; vascular hypercontractility.


Figures
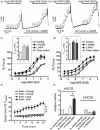
Figure 1.
Figure 1.
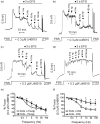
Modulation of U46619-induced contraction in young and old murine basilar arteries by NOS. (a, b): Examples of force traces with contractile responses to the thromboxane analogue U46619 (0.01–3 µmol/L) in y-BA (a) and o-BA (b) prior to and during NOS inhibition. (c, d): Dose-response curves for the effect of U46619 on force in y-BA (c) and o-BA (d): in the absence of inhibitor (open symbols; n = 15 for y-BA, n = 10 for o-BA), with 100 µmol/L pan-NOS inhibitor L-NAME (filled circles; n = 9 for y-BA, n = 5 for o-BA), with 1 µmol/L nNOS inhibitor L-NPA (filled triangles; n = 7 for y-BA, n = 5 for o-BA). Open diamonds in (c) and (d) depict the effect of U46619 in the time-matched controls from both age groups (n = 7 for y-BA, n = 4 for o-BA). The % Force in the ordinates in (c) and (d) is a normalization to the force elicited by 3 µmol/L U46619 in the absence of inhibitor. Inserts in (c) and (d) display absolute forces, elicited by 3 µmol/L U46619 without inhibitor (bars “1”), with 100 µmol/L NAME (bars “2”), with 1 µmol/L L-NPA (bars “3”). (e): Endothelium-denuded (“Endo-”) o-BA shows a continuous tone increase after mounting (n = 5), while this is not seen in denuded y-BA, nor in vessels with intact endothelium (“Endo+”). (f): Comparison of the eNOS and nNOS expression in y-BA and o-BA. The ordinate shows the fold change in the quotient of mRNA levels for eNOS/GAPDH (left) and nNOS/GAPDH (right) relative to the reference sample. As reference samples for eNOS, the young mouse tail artery was used (n = 5) and for nNOS, the young mouse fundus (n = 5). Error bars represent ±SEM. *p < 0.05, ***p < 0.001.
Figure 2.
Figure 2.
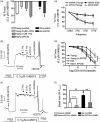
Attenuated relaxation of de-endothelized o-BA upon supramaximal EFS. (a to d): Examples of the effect of different EFS frequencies (0.1 ms pulse duration, 30 V, 3 s trains) on 0.3 µmol/L U46619 force. (a, b): y-BA (a) and o-BA (b) with intact endothelium. (c, d): Mechanically denuded y-BA (c) and o-BA (d). N = 4–8 for a–d. (e, f): Dependency of the EFS-induced force decline on stimulation frequency in y-BA (e) and o-BA (f) with intact endothelium (open symbols, “Endo+”) or upon de-endothelization (filled symbols, “Endo-”). Ordinates in (e) and (f); normalized force to the value elicited by 0.03 µmol/L U46619 in the respective age group; *p < 0.05. EFS: electrical field stimulation; PSS: physiological salt solution.
Figure 3.
Figure 3.
Aging attenuated submaximal EFS-induced relaxation of de-endothelized basilar arteries. Representative force traces from young (a) and old (b) basilar arteries pre-constricted with 0.3 (a) or 0.1 µmol/L (b) U46619. Summarized data of the relaxation induced by submaximal EFS (12.5–17.5 V, 0.1 ms pulses, 3 s trains) in young (c) and old (d) basilar arteries at control conditions (without inhibitors; n = 8 young, n = 5 old animals) and after pre-incubation with TTX (1 or 10 µmol/L, n = 5–8 young, n = 3 old animals) or L-NPA (3 µmol/L, n = 6 young and n = 3 old animals) and time-matched controls (n = 6–4). Data were expressed in percent of the force elicited by 0.3 µmol/L U46619 prior exposure to EFS and expressed as % force.
Figure 4.
Figure 4.
Apocynin (APCN) pre-treatment restored the impaired NO-responsiveness and the chemically but not electrically induced relaxation, and lowers basal tone of aged murine basilar arteries. (a): Effect of 100 µmol/L nicotine alone (control, n = 9 y-BA, n = 8 o-BA), and in the presence of 1 µmol/L TTX (n = 3 y-BA), 3 µmol/L L-NPA (n = 6 y-BA) and 600 µmol/L apocynin (n = 7 young and n = 4 old arteries). Force is expressed in % of 0.3 µmol/L U46619-induced contraction prior to nicotine application; *p < 0.05 TTX or L-NPA vs y-BA (control); #p < 0.001, y-BA (control) vs. o-BA (control); §p < 0.01 o-BA (control) vs o-BA with (APCN); p = 0.15 young (controls) vs. young (APCN). (b, c): Representative force traces displaying the effect of APCN on EFS and on nicotine-induced relaxation in y-BA (b) and o-BA (c). (d): Summary of the effect of submaximal EFS (12.5–17.5 V, 0.1 ms pulses, 3 s trains) in young and old BAs (n = 4). (e): Dose-response relation of DEA-NONOate-induced relaxation in y-BA and o-BA in the absence (n = 6 young, n = 5 old) and presence (n = 3 young, n = 5 old) of APCN. Before stimulation with 0.3 µmol/L U46619, arteries were pre-incubated for 15 min in 600 µmol/L APCN and were then additionally pre-treated with 100 µmol/L L-NAME. Force is expressed as percent of the force elicited by 0.3 µmol/L U46619, prior to application of DEA-NONOate, symbols represent mean ±SEM, *: p < 0.05 y-BA vs o-BA. There was no significant difference between the other groups (Dunnett's Multiple Comparison Test). (f): Basal tone of y-BA and o-BA, pre-incubated with 100 µmol/L L-NAME (n = 3 young and n = 5 old) or with 600 µmol/L APCN and 100 µmol/L L-NAME (n = 5 young and old BAs). **: p < 0.01, n.s. not significantly different (p = 0.12). Force is expressed in percent of U46619-induced contraction at 3 µmol/L (Fmax). Error bars represent (±) SEM.
Figure 5.
Figure 5.
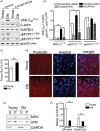
Aging increased basal phosphorylation of myosin regulatory light chain (pMLC20S-19) and reduced the G-actin content in murine basilar arteries. Representative western blots (a) and densitometric analysis (b) of pMLC20S-19 and of MYPT1 phosphorylation at T-853 and T-696 in vessels from both age groups, treated with vehicle (0.2% DMSO; time controls) or with 600 µmol/L apocynin (APCN). As loading controls, the membranes were incubated with antibodies against β-actin, GAPDH or MYPT1total. In (b), the ordinate represents phosphorylation as ratio of the immunoreactivities of pMLC20S-19/β-actin (n = 4) or pMYPT1T-853/MYPT1total (n = 4) or MYPT1T-696/MYPT1total (n = 3). (c): Steady state submaximal (pCa 6.1) Ca2+-induced contraction of young (n = 7) and old (n = 9) α-toxin permeabilized murine basilar arteries. Force is expressed as % of force at pCa = 4.3. (d): Representative confocal images from y-BA and o-BA co-stained with Alexa Fluor®555-phalloidin and Hoechst 33342 (a total of six arteries (six animals) per group were used for co-staining). Prior to imaging, the preparations were isometrically mounted and stretched as described in the Methods. (e): Representative western blots of centrifuged vessel preparations with the supernatant (S) containing G-actin and the pellet (P) containing F-actin (see Methods for details on preparation). The upper part of the gel was stained with Coomassie blue. Myosin heavy chain (MHC) is detected in the pellet only. Actin and GAPDH were detected with respective antibodies. (f): Densitometric analysis showing the G-actin-to-F-actin ratio (left) and the G-actin-to-GAPDH ratio in y-BA (white bars) and o-BA (black bars). Analysis included n = 5 arterial segments per age group. Error bars represent ±SEM. *p < 0.05, **p < 0.01.
Figure 6.
Figure 6.
Phosphorylation of MLC20 and MYPT1T-696, basal tone and eNOS expression in o-BA of MYPT1T696A/+-mice. (a, b): Representative western blots and densitometric quantification via calculation of the intensity ratios pMYPT1T-696 to MYPTtotal, pMLC20S-19 to β-actin and MYPTtotal to MHC, in o-BA from control animals (WT) and from MYPT1T696A/+-mice (n = 5 animals per group). The MYPTtotal-to-MHC ratio served as a measure for MYPT1 expression in WT and MYPT1T696A/+ animals (note that for MHC, the Coomassie stain signal intensity was used). (c): Comparison of the basal tone increase in the presence of L-NAME in y-BA (n = 9) and o-BA (n = 5) from WT animals, and in o-BA from MYPT1T696A/+-mice (n = 5). (d): eNOS expression, on the mRNA level, in y-BA (n = 8) and o-BA (n = 7) from WT animals, and in o-BA from MYPT1T696A/+-mice (n = 4; the data for y-BA and o-BA from WT arteries are replotted from Figure 1(f)). Relative eNOS mRNA levels are expressed as normalizations to the y-BA fold change value. Error bars represent ±SEM. *p < 0.05, **p < 0.01, n.s.: not significantly different. MHC: myosin heavy chain.

Similar articles

Cited by

References

    1. Iadecola C, Park L, Capone C. Threats to the mind: aging, amyloid, and hypertension. Stroke 2009; 40: S40–S44. - PMC - PubMed
    1. Park L, Zhou P, Pitstick R, et al. Nox2-derived radicals contribute to neurovascular and behavioral dysfunction in mice overexpressing the amyloid precursor protein. Proc Natl Acad Sci U S A 2008; 105: 1347–1352. - PMC - PubMed
    1. Park L, Anrather J, Girouard H, et al. Nox2-derived reactive oxygen species mediate neurovascular dysregulation in the aging mouse brain. J Cereb Blood Flow Metab 2007; 27: 1908–1918. - PubMed
    1. Han BH, Zhou ML, Johnson AW, et al. Contribution of reactive oxygen species to cerebral amyloid angiopathy, vasomotor dysfunction, and microhemorrhage in aged Tg2576 mice. Proc Natl Acad Sci U S A 2015; 112: E881–E890. - PMC - PubMed
    1. Iadecola C. The pathobiology of vascular dementia. Neuron 2013; 80: 844–866. - PMC - PubMed

MeSH terms

LinkOut - more resources