Multicenter Study
. 2016 May 19:7:11616.
doi: 10.1038/ncomms11616.

A genome-wide association scan implicates DCHS2, RUNX2, GLI3, PAX1 and EDAR in human facial variation

Affiliations
Multicenter Study

A genome-wide association scan implicates DCHS2, RUNX2, GLI3, PAX1 and EDAR in human facial variation

Kaustubh Adhikari et al. Nat Commun. .

Abstract

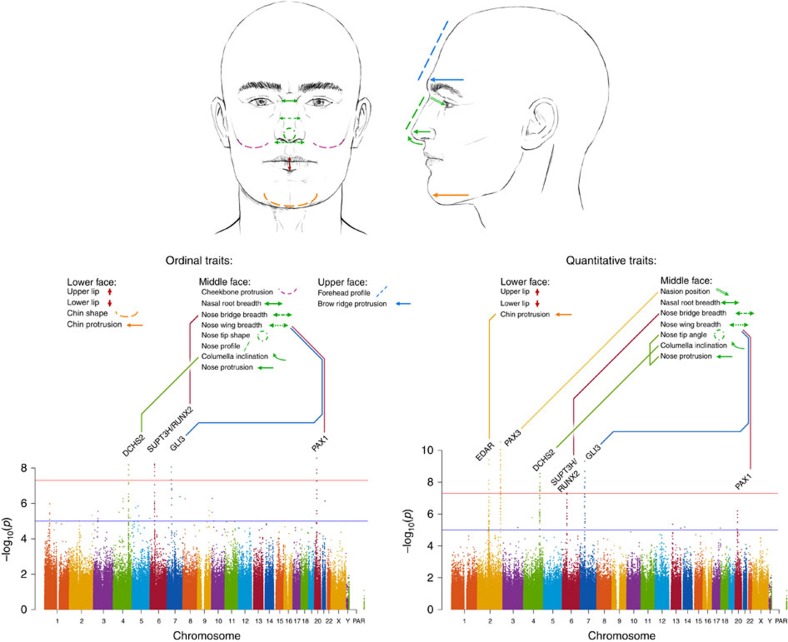
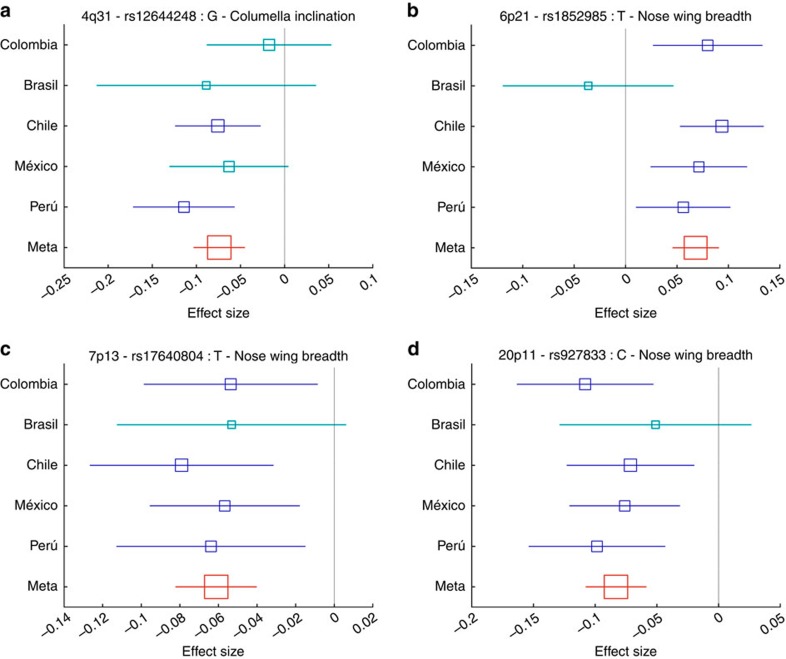
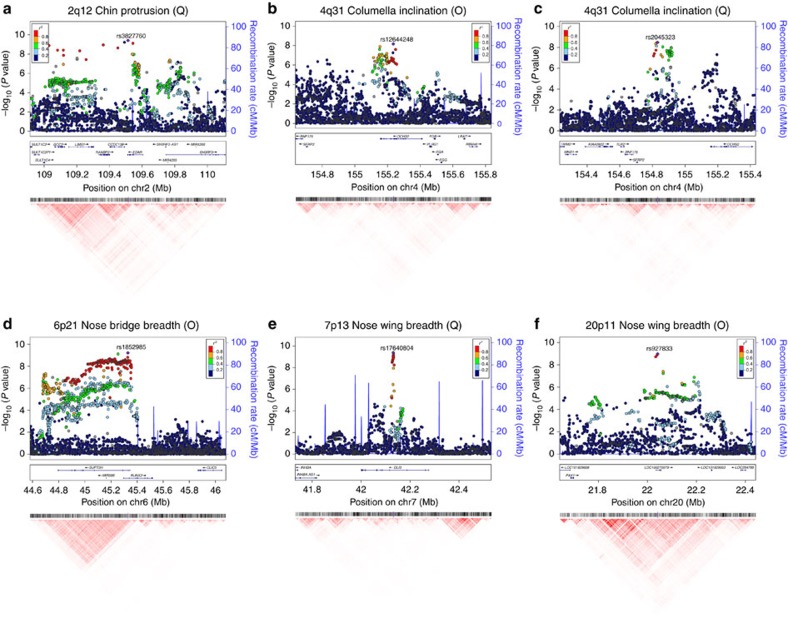
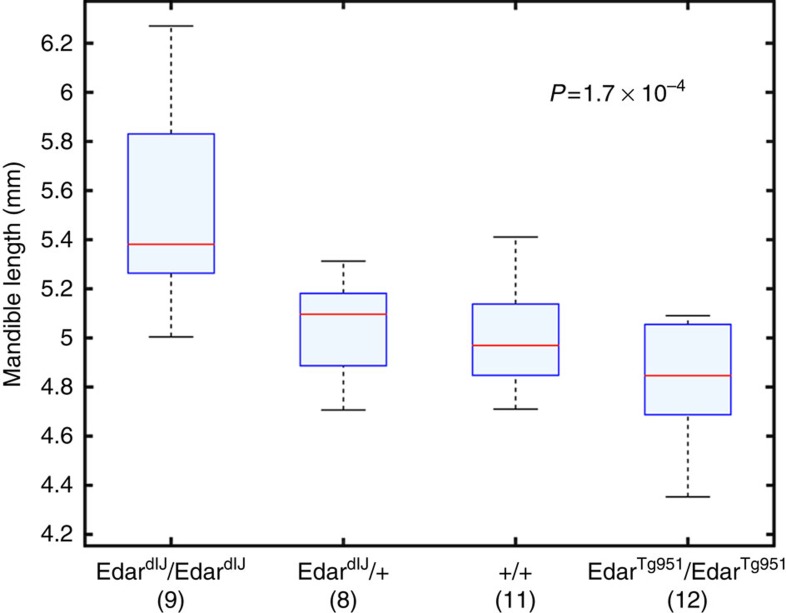
We report a genome-wide association scan for facial features in ∼6,000 Latin Americans. We evaluated 14 traits on an ordinal scale and found significant association (P values<5 × 10(-8)) at single-nucleotide polymorphisms (SNPs) in four genomic regions for three nose-related traits: columella inclination (4q31), nose bridge breadth (6p21) and nose wing breadth (7p13 and 20p11). In a subsample of ∼3,000 individuals we obtained quantitative traits related to 9 of the ordinal phenotypes and, also, a measure of nasion position. Quantitative analyses confirmed the ordinal-based associations, identified SNPs in 2q12 associated to chin protrusion, and replicated the reported association of nasion position with SNPs in PAX3. Strongest association in 2q12, 4q31, 6p21 and 7p13 was observed for SNPs in the EDAR, DCHS2, RUNX2 and GLI3 genes, respectively. Associated SNPs in 20p11 extend to PAX1. Consistent with the effect of EDAR on chin protrusion, we documented alterations of mandible length in mice with modified Edar funtion.


Figures

Figure 1
Figure 1. Overview of GWAS for facial features in the CANDELA sample.
We first carried out a GWAS using data for 14 ordinal facial features from the lower, middle and upper face in 5,958 individuals. For follow-up, we obtained quantitative proxies for 9 of the 14 ordinal traits initially examined (and also obtained a measure of nasion position) in a subset of 2,955 individuals, and performed another GWAS. For convenience, we summarize results across traits on a single ‘composite' Manhattan plot shown at the bottom of the figure (ordinal traits on the left and quantitative traits on the right). Each Manhattan plot displays all the SNPs with P values exceeding thresholds for genome-wide suggestive (10−5, blue line) or genome-wide significance (5 × 10⁻⁸, red line) for any trait. To avoid cluttering the figure, P values not reaching the suggestive threshold (that is, whose significance can be disregarded) are shown only for one trait (upper lip thickness). The names of the candidate genes closest to each association peak are provided (Table 1). These genes are connected with the list of associated facial features via lines of different colour. The location of these features is illustrated on the face drawings shown at the top of the figure. Face drawings were prepared by Emiliano Bellini. PAR, pseudo-autosomal region.
Figure 2
Figure 2. Effect sizes (regression coefficients) for the derived allele at index SNPs in the genome regions associated with ordinal face traits.
(a) 4q31 rs12644248, (b) 6p21 rs1852985, (c) 7p13 rs17640804, (d) 20p11 rs927833. Estimates obtained in each country are shown as blue boxes. Red boxes indicate estimates obtained in the meta-analysis. Box size is proportional to sample size. Horizontal bars indicate confidence intervals representing 2 × standard errors. Intervals that include zero (that is, non-significant effects) are shown in light blue.
Figure 3
Figure 3. Genomic regions showing genome-wide significant association to face traits.
For each facial feature we show the results that achieved strongest statistical significance regardless of the type of variable analysed (ordinal, O; or quantitative, Q). (a) 2q12 (Q), (b) 4q31 (O), (c) 4q31 (Q), (d) 6p21 (O), (e) 7p13(Q), (f) 20p11 (O). Plots not shown here are shown in Supplementary Fig. 7. Association results (on a −log10 P scale; left y-axis) are shown for SNPs ∼500 kb on either side of the index SNP (purple diamond; Table 1) with the marker (dot) colour indicating the strength of LD (r2) between the index SNP and that SNP in the 1000 genomes AMR data set. Local recombination rate in the AMR data is shown as a continuous blue line (scale on the right y-axis). Genes in each region, their intron–exon structure, direction of transcription and genomic coordinates (in Mb, using the NCBI human genome sequence, Build 37, as reference) are shown at the bottom. Plots were produced with LocusZoom. Below each region we also show an LD heatmap (using r2, ranging from red indicating r2=1 to white indicating r2=0) produced using a MATLAB implementation similar to Haploview.
Figure 4
Figure 4. Effect of Edar genotype on mouse mandible length.
We show boxplots of mandible length (y-axis) in mice with different Edar genotypes (x-axis). The measure of mandible length shown is the projected distance between head landmarks 5 and 10 (Supplementary Figs 8 and 9). Regression analysis indicates a significant effect of Edar genotype on mandible length (P value 1.7 × 10⁻⁴). Significant results were also obtained for other measurements of mandible length (Supplementary Table 16). Boxplot whiskers extend to data points within 1.5 times the interquartile range on both sides. The numbers in parenthesis below genotypic categories refer to the number of mice examined for each genotype.

Similar articles

Cited by

References

    1. Reyes-Centeno H., Hubbe M., Hanihara T., Stringer C. & Harvati K. Testing modern human out-of-Africa dispersal models and implications for modern human origins. J. Hum. Evol. 87, 95–106 (2015). - PubMed
    1. Harvati K. & Weaver T. D. Human cranial anatomy and the differential preservation of population history and climate signatures. Anat. Rec. A Discov. Mol. Cell. Evol. Biol. 288, 1225–1233 (2006). - PubMed
    1. von Cramon-Taubadel N. Evolutionary insights into global patterns of human cranial diversity: population history, climatic and dietary effects. J. Anthropol. Sci. 92, 43–77 (2014). - PubMed
    1. Sheehan M. J. & Nachman M. W. Morphological and population genomic evidence that human faces have evolved to signal individual identity. Nat. Commun. 5, 4800 (2014). - PMC - PubMed
    1. Ritz-Timme S. et al. A new atlas for the evaluation of facial features: advantages, limits, and applicability. Int. J. Legal. Med. 125, 301–306 (2011). - PubMed

Publication types

LinkOut - more resources