

Isolation of human salivary extracellular vesicles by iodixanol density gradient ultracentrifugation and their characterizations
- PMID: 27193612
- PMCID: PMC4871899
- DOI: 10.3402/jev.v5.30829
Isolation of human salivary extracellular vesicles by iodixanol density gradient ultracentrifugation and their characterizations
Abstract
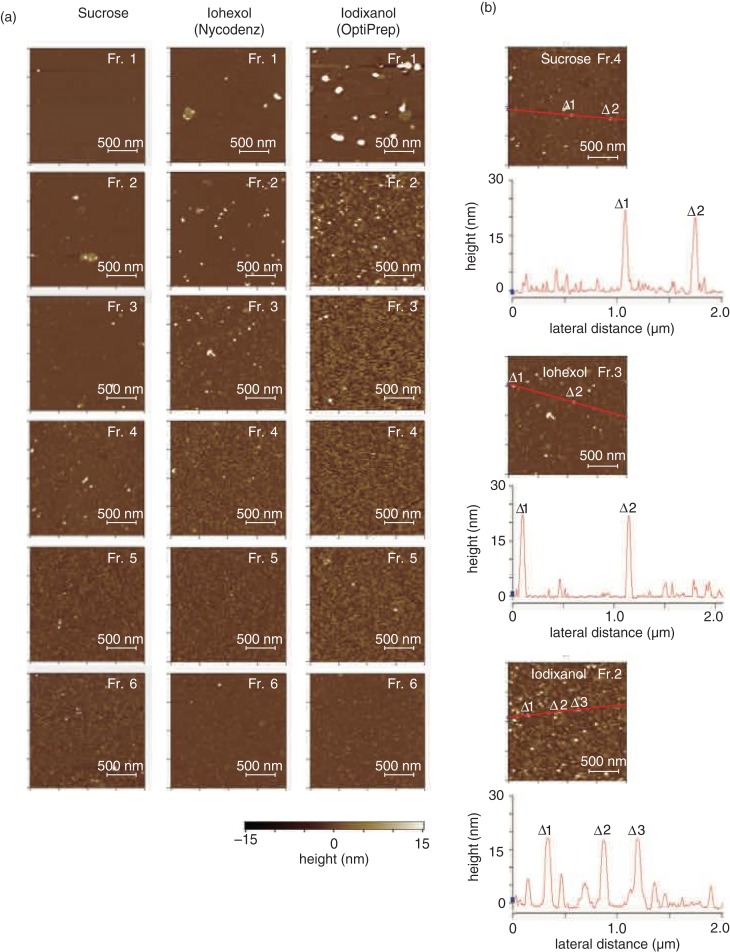
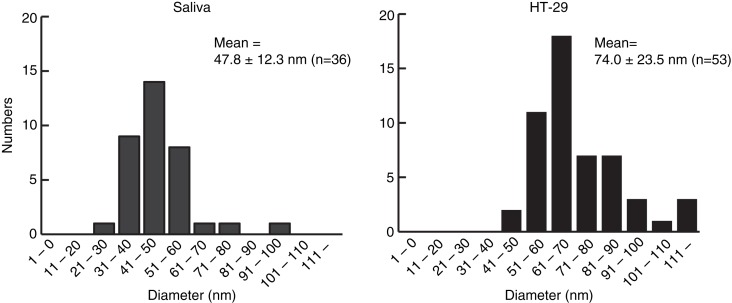
Diagnostic methods that focus on the extracellular vesicles (EVs) present in saliva have been attracting great attention because of their non-invasiveness. EVs contain biomolecules such as proteins, messenger RNA (mRNA) and microRNA (miRNA), which originate from cells that release EVs, making them an ideal source for liquid biopsy. Although there have been many reports on density-based fractionation of EVs from blood and urine, the number of reports on EVs from saliva has been limited, most probably because of the difficulties in separating EVs from viscous saliva using density gradient centrifugation. This article establishes a protocol for the isolation of EVs from human saliva using density gradient centrifugation. The fractionated salivary EVs were characterized by atomic force microscopy, western blot and reverse transcription polymerase chain reaction. The results indicate that salivary EVs have a smaller diameter (47.8±12.3 nm) and higher density (1.11 g/ml) than EVs isolated from conditioned cell media (74.0±23.5 nm and 1.06 g/ml, respectively). Additionally, to improve the throughput of density-based fractionation of EVs, the original protocol was further modified by using a fixed angle rotor instead of a swinging rotor. It was also confirmed that several miRNAs were expressed strongly in the EV-marker-expressing fractions.
Keywords: EVs; diagnosis; exosome; microRNA; saliva.
Figures


Similar articles
-
Isolation of Extracellular Vesicles in Saliva Using Density Gradient Ultracentrifugation.Methods Mol Biol. 2017;1660:343-350. doi: 10.1007/978-1-4939-7253-1_27. Methods Mol Biol. 2017. PMID: 28828669
-
Isolation of High-Purity Extracellular Vesicles by the Combination of Iodixanol Density Gradient Ultracentrifugation and Bind-Elute Chromatography From Blood Plasma.Front Physiol. 2018 Oct 23;9:1479. doi: 10.3389/fphys.2018.01479. eCollection 2018. Front Physiol. 2018. PMID: 30405435 Free PMC article.
-
Comparing small urinary extracellular vesicle purification methods with a view to RNA sequencing-Enabling robust and non-invasive biomarker research.Biomol Detect Quantif. 2019 Jun 4;17:100089. doi: 10.1016/j.bdq.2019.100089. eCollection 2019 Mar. Biomol Detect Quantif. 2019. PMID: 31194192 Free PMC article.
-
Salivary Extracellular Vesicle-Associated exRNA as Cancer Biomarker.Cancers (Basel). 2019 Jun 26;11(7):891. doi: 10.3390/cancers11070891. Cancers (Basel). 2019. PMID: 31247906 Free PMC article. Review.
-
Biological Properties of Milk-Derived Extracellular Vesicles and Their Physiological Functions in Infant.Front Cell Dev Biol. 2021 Jun 25;9:693534. doi: 10.3389/fcell.2021.693534. eCollection 2021. Front Cell Dev Biol. 2021. PMID: 34249944 Free PMC article. Review.
Cited by
-
Small extracellular vesicles as a multicomponent biomarker platform in urinary tract carcinomas.Front Mol Biosci. 2022 Sep 27;9:916666. doi: 10.3389/fmolb.2022.916666. eCollection 2022. Front Mol Biosci. 2022. PMID: 36237572 Free PMC article. Review.
-
Proteomics of Extracellular Vesicles: Update on Their Composition, Biological Roles and Potential Use as Diagnostic Tools in Atherosclerotic Cardiovascular Diseases.Diagnostics (Basel). 2020 Oct 19;10(10):843. doi: 10.3390/diagnostics10100843. Diagnostics (Basel). 2020. PMID: 33086718 Free PMC article. Review.
-
Procoagulant Microvesicles in COVID-19 Patients: Possible Modulators of Inflammation and Prothrombotic Tendency.Infect Drug Resist. 2022 Apr 29;15:2359-2368. doi: 10.2147/IDR.S355395. eCollection 2022. Infect Drug Resist. 2022. PMID: 35517897 Free PMC article.
-
Csi-let-7a-5p delivered by extracellular vesicles from a liver fluke activates M1-like macrophages and exacerbates biliary injuries.Proc Natl Acad Sci U S A. 2021 Nov 16;118(46):e2102206118. doi: 10.1073/pnas.2102206118. Proc Natl Acad Sci U S A. 2021. PMID: 34772807 Free PMC article.
-
Extracellular Vesicles in Acute Kidney Injury and Clinical Applications.Int J Mol Sci. 2021 Aug 18;22(16):8913. doi: 10.3390/ijms22168913. Int J Mol Sci. 2021. PMID: 34445618 Free PMC article. Review.
References
-
- Wong DT. Salivary diagnostics powered by nanotechnologies, proteomics and genomics. J Am Dent Assoc. 2006;137:313–21. - PubMed
-
- Pfaffe T, Cooper-White J, Beyerlein P, Kostner K, Punyadeera C. Diagnostic potential of saliva: current state and future applications. Clin Chem. 2011;57:675–87. - PubMed
-
- Humphrey SP, Williamson RT. A review of saliva: normal composition, flow, and function. J Prosthet Dent. 2001;85:162–9. - PubMed
-
- Deutsch O, Fleissig Y, Zaks B, Krief G, Aframian DJ, Palmon A. An approach to remove alpha amylase for proteomic analysis of low abundance biomarkers in human saliva. Electrophoresis. 2008;29:4150–7. - PubMed
-
- Krief G, Deutsch O, Gariba S, Zaks B, Aframian DJ, Palmon A. Improved visualization of low abundance oral fluid proteins after triple depletion of alpha amylase, albumin and IgG. Oral Dis. 2011;17:45–52. - PubMed
LinkOut - more resources
Full Text Sources
Other Literature Sources
Molecular Biology Databases
