. 2016 May 19;533(7603):359-65.
doi: 10.1038/nature17970. Epub 2016 May 11.

Near-atomic resolution visualization of human transcription promoter opening

Affiliations

Near-atomic resolution visualization of human transcription promoter opening

Yuan He et al. Nature. .

Abstract

In eukaryotic transcription initiation, a large multi-subunit pre-initiation complex (PIC) that assembles at the core promoter is required for the opening of the duplex DNA and identification of the start site for transcription by RNA polymerase II. Here we use cryo-electron microscropy (cryo-EM) to determine near-atomic resolution structures of the human PIC in a closed state (engaged with duplex DNA), an open state (engaged with a transcription bubble), and an initially transcribing complex (containing six base pairs of DNA-RNA hybrid). Our studies provide structures for previously uncharacterized components of the PIC, such as TFIIE and TFIIH, and segments of TFIIA, TFIIB and TFIIF. Comparison of the different structures reveals the sequential conformational changes that accompany the transition from each state to the next throughout the transcription initiation process. This analysis illustrates the key role of TFIIB in transcription bubble stabilization and provides strong structural support for a translocase activity of XPB.


Figures

Extended Data Figure 1
Extended Data Figure 1. Purification and activity of human PIC
a, SDS–PAGE (4–12% gradient gel followed by silver staining) of purified transcription factors and assembled PIC on a promoter DNA. b, The purified PIC in a, was ran on a 10% TBE-urea gel after supplying ribonucleoside triphosphates in a run-off reaction. kDa, kilodaltons.
Extended Data Figure 2
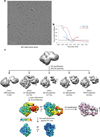
Extended Data Figure 2. Cryo-EM of the human CC
a, Representative raw micrograph. b, FSC curve and estimated resolution using the 0.143 criteria following the gold-standard procedure implemented in RELION for both the holo-complex and the PIC core. c, Refinement strategy for the holo-complex (see Methods). The local resolution estimation shows flexibility for TFIIH. Further 3D classification revealed the range of motion of TFIIH within the complex (pink and sky blue densities). Focused refinement on the PIC core (masking out TFIIH) improved alignment accuracy and improved the resolution for the core complex.
Extended Data Figure 3
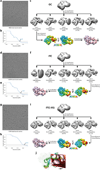
Extended Data Figure 3. Cryo-EM of the human OC/ITC/ITC(−IIS) complexes
a, d, g, Representative raw micrograph. b, e, h, FSC curve and estimated resolution using the 0.143 criteria following the gold-standard procedure implemented in RELION. c, f, i, Refinement strategy for the holo-complex (see Methods). The local resolution estimation shows flexibility for TFIIH. Further 3D classification revealed the range of motion of TFIIH within the complex (pink and blue densities). Notice that the direction and range of motion for these three states is similar. Compared to the CC, the pink densities are approximately the same, but the direction of motion from pink to blue has changed. j, Movement of TFIIH with respect to the core PIC from the CC to OC state.
Extended Data Figure 4
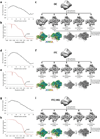
Extended Data Figure 4. Cryo-EM of the core human OC/ITC/ITC(−IIS) complexes
a, d, g, Dose-dependent B-factor plot from RELION. b, e, h, FSC curve and estimated resolution using the 0.143 criteria following the gold standard procedure implemented in RELION. c, f, i, Refinement strategy (see Methods). The local resolution estimation and final density map (filtered according to this local resolution) is shown for two different views and at two different thresholds (the higher threshold allows better visualization of the highest resolution features for the more stable elements).
Extended Data Figure 5
Extended Data Figure 5. Segmented cryo-EM densities and models for different regions of interest within the human core PIC in the CC, OC, ITC and ITC(−IIS) states
a, TFIIB and its interaction with DNA. b, Extension of TFIIA stabilized by interaction with TBP. c, Trigger loop in Pol II, viewed in an ‘off ’ state by comparison with crystallographic structures of yeast Pol II (2NVZ in blue and 1Y1V in green). d, TFIIE and its interacting partners with the PIC. e, TFIIF and its interacting partners with the PIC.
Extended Data Figure 6
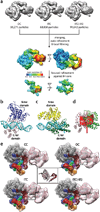
Extended Data Figure 6. Cryo-EM reconstruction and interpretation of human TFIIH
a, Refinement strategy (see Methods) for the seven subunit TFIIH core complex (the CAK subcomplex is too flexible to be visualized following averaging). The local resolution estimation for the PIC structure obtained by combining the OC, ITC and ITC(−IIS) data sets shows lower resolution for TFIIH, reflecting its flexible attachment. Focused refinement (using the mask marked by dashed lines) allowed us to improve the resolution for TFIIH. b–d, Comparison of human XPB and the ssoRad54 ATPase structures and their interaction with DNA. b, Human XPB–DNA model. N terminus is shown in navy blue, C terminus in pink and DNA in cyan. c, Crystal structure of ssoRad54 ATPase (PDB: 1Z63). The N terminus is shown in yellow, the C terminus in green and the DNA in cyan. Whereas the N-terminal domains of both proteins and the DNA can be easily superimposed, the C-terminal domains are in very different position. d, A 123° rotation would be required to superimpose the C-terminal domains around an axis located on the first residues (top, shown in spheres) that connects to the fixed N-terminal domain. The rotation axis and planes are coloured in red. e, Possible location of the TFIIEα–TFIIH/p62 interface. An unassigned density in the region of proximity/contact between TFIIE and TFIIH probably corresponding to the TFIIE–TFIIH interface is marked with boxes for each reconstruction. A tentative orientation of the NMR structure for a short C-terminal segment of TFIIEα bound to the PHD domain of p62 (PDB: 2RNR) is proposed in the centre for that flexible density region.
Extended Data Figure 7
Extended Data Figure 7. Position of the TBP–IIA–IIB module and mobile elements of Pol II
a–c, Comparison between a ‘synthetic’ structure of the CC, generated by superimposing human TBP–TFIIA–DNA (PDB: 1NVP), human TBP–TFIIB–DNA (PDB: 2C9B), and, most notably, the yeast Pol II–TFIIB (PDB: 4BBR) using common elements (green), and the human cryo-EM CC model (coloured). A number of elements are rotated between the two: the TBP-IIA-IIB-DNA subcomplex (a), the Pol II clamp (b), and the Pol II stalk (c). The rotation plane and angle are depicted in red. d, Comparison, shown in two different views, of a recently reported cryo-EM structure of yeast CC (green) and the human CC in this study. The structures were aligned using the rigid part of Pol II (that is, excluding the clamp and the stalk). The yeast TBP–TFIIA– TFIIB–DNA module and the mobile regions of Pol II (clamp and stalk) are in different relative positions. Whereas the TBP–TFIIA–TFIIB module and the clamp and stalk element resembles those in the ‘synthetic’ model (a–c), the path of the DNA is very different, in that it moves away, rather than towards the Pol II stalk.
Extended Data Figure 8
Extended Data Figure 8. Comparison of eukaryotic and bacterial initiation complexes around the active site
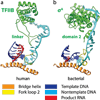
a, b, Equivalent close-up views of our ITC(−IIS) model (a) and the crystallographic structure of a bacterial initiation complex (4G7O) (b). The fork loop 2 is tilted in a very similar manner to that observed in our OC, ITC and ITC(−IIS) structures (see Figs 2b and 5f). Domain 2 within the bacterial σ factor is involved in stabilizing the non-template DNA in a similar manner as the TFIIB linker region in human initiation complex.
Extended Data Figure 9
Extended Data Figure 9. Comparison of selected regions of the human core PIC structures for the CC, OC, ITC and ITC(−IIS) states
a, Segmented density and model for TFIIB and Pol II loops critical for stabilization of the transcription bubble. The density for the nucleic acids has been omitted for clarity. b, Interaction of the Pol II clamp head with TFIIE. As the clamp closes down during promoter opening (CC to OC transition), the region of contact with TFIIE changes. c, Interaction of the Pol II clamp head with DNA near the promoter melting site. d, Interaction of RPB5 with DNA. e, Opening of two extra base pairs of DNA in the OC scaffold. EM density and the corresponding model near the initiation bubble upstream fork in the OC (left) and ITC(−IIS) (right) structures. Positions of the duplexed DNA downstream of the BRE were labelled relative to the +1 active site in each structure. The cartoon (bottom) shows the two aligned DNA templates for reference.
Figure 1
Figure 1. Cryo-EM reconstructions of human PIC in different states during the initiation process
a, Nucleic acid scaffolds used. Filled and open circles correspond, respectively, to the core promoter and poly-T mismatch sequences. For the OC, two additional bases upstream are opened in the cryo-EM structure. Black circles correspond to RNA. b–d, Cryo-EM reconstructions of holo-PICs (b), core PICs (c), and MDFF models (d), for the CC, OC, ITC and ITC(−IIS) states.
Figure 2
Figure 2. Examples of near-atomic resolution regions
a, EM densities and corresponding atomic models for the double-ψ β-barrel domain composing the conserved core of Pol II within RPB1 and RPB2 (ref. 49) (see also Supplementary Video 1). b, Structural details around the Pol II active site. Densities are shown at two different thresholds. The lower threshold (mesh) allows visualization of the more flexible elements.
Figure 3
Figure 3. Newly visualized structural elements of the human PIC
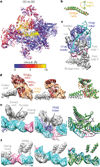
Segmented cryo-EM densities from the ITC(−IIS) reconstruction shown at two different thresholds (the lower threshold (mesh) facilitates visualization of the more flexible elements). a, Differences in the path of the B-linker of TFIIB between the yeast crystallographic model (green) and the human ITC cryo-EM structure (coloured as in the rest of the figures). Superimposition was performed by aligning the rigid part of Pol II (that is, excluding the clamp and the stalk), here and for all other figures. b, Residues 307–332 of TFIIAβ interact with the N-terminal lobe of TBP. c, Trigger loop in RPB1 in an open ‘off ’ state. The trigger loops in crystal structures of yeast EC in its closed ‘on’ state (2NVZ, light blue), and in its open ‘off ’ state (1Y1V, green) are shown for comparison. d, RAP30 WH domain and linker within TFIIF. Elements of the PIC in close proximity are indicated. e, Key domains of TFIIE and their interaction partners within the PIC. f, Cryo-EM structure of TFIIH (the flexible CAK subcomplex is not visible after averaging) obtained from a combined data set of open promoter states. Segmentation based on fitting of available structures and homology models.
Figure 4
Figure 4. Structural transitions during promoter opening
a, Colour-coded motion of backbone atoms between CC and OC based on r.m.s.d. b, Change of fork loop 2 near the active site between the CC (green) and OC (coloured) (see also Fig. 2b). A similar colour scheme is used for the superposition of CC and OC states in the third column of d–f. c, Segmented cryo-EM density from the OC reconstruction and the corresponding model for TFIIB and various Pol II loops critical for stabilization of the transcription bubble. The density for the nucleic acids has been omitted for clarity. d, Changes in the contact between the RPB1 coiled-coil and TFIIE during bubble opening. e, Changes near the melting start site involving the clamp head, coiled-coil domain, rudder domain and TFIIB. f, Changes in Pol II interaction with downstream DNA involving the clamp head and RPB5.
Figure 5
Figure 5. Nucleic acids rearrangements between stages of transcription
a, DNA paths before (green) and after (blue/cyan) TFIIH incorporation into the CC. XPB is coloured navy blue and the rest of the PIC is shown in transparency. b, Section through the CC density map and model showing the path of the DNA and its engagement by TFIIH. c, Segmented electron microscopy densities and models of promoter DNA in the CC and OC. d, Section through the OC density map and model showing the path of the DNA and its engagement by TFIIH. e, Comparison of the DNA path in our ITC(−IIS) state (blue/cyan) with that in the bovine EC structure (green). Segmented electron microscopy density of the EC single-stranded nontemplate DNA is shown to illustrate its path, as this part was not modelled in the published structure. f, Close-up views at the active site comparing the position of fork loop 2 relative to the nucleic acids and bridge helix in the human ITC(−IIS) (top) and bovine EC (bottom).
Figure 6
Figure 6. Possible region of DNA scrunching during initiation
a, b, Segmented cryo-EM densities and models for DNA and RNA near the Pol II active site for the OC (a) and ITC(−IIS) (b). TFIIB and Pol II loops that are critical for stabilization of the bubble are also shown (density omitted for clarity). c, Superimposition of the OC (green) and ITC(−IIS) (coloured) states. The lack of visible density (arrow) is interpreted as disorder at the site of scrunching, upstream of the contact with the TFIIB linker.

Comment in

References

    1. Roeder RG. The role of general initiation factors in transcription by RNA polymerase II. Trends Biochem. Sci. 1996;21:327–335. - PubMed
    1. Goodrich JA, Cutler G, Tjian R. Contacts in context: promoter specificity and macromolecular interactions in transcription. Cell. 1996;84:825–830. - PubMed
    1. Boeger H, et al. Structural basis of eukaryotic gene transcription. FEBS Lett. 2005;579:899–903. - PubMed
    1. Buratowski S, Hahn S, Guarente L, Sharp PA. Five intermediate complexes in transcription initiation by RNA polymerase II. Cell. 1989;56:549–561. - PubMed
    1. Cheung ACM, Sainsbury S, Cramer P. Structural basis of initial RNA polymerase II transcription. EMBO J. 2011;30:4755–4763. - PMC - PubMed

Publication types

MeSH terms