. 2016 May 19;533(7603):411-5.
doi: 10.1038/nature17662. Epub 2016 May 11.

An obligatory role for neurotensin in high-fat-diet-induced obesity

Affiliations

An obligatory role for neurotensin in high-fat-diet-induced obesity

Jing Li et al. Nature. .

Abstract

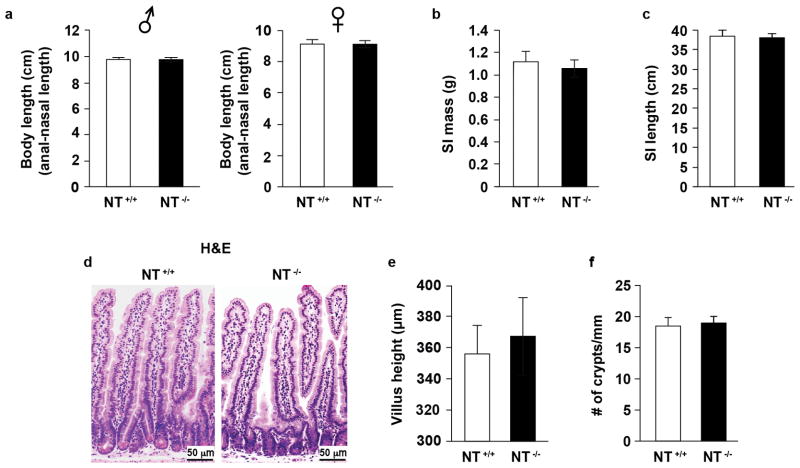
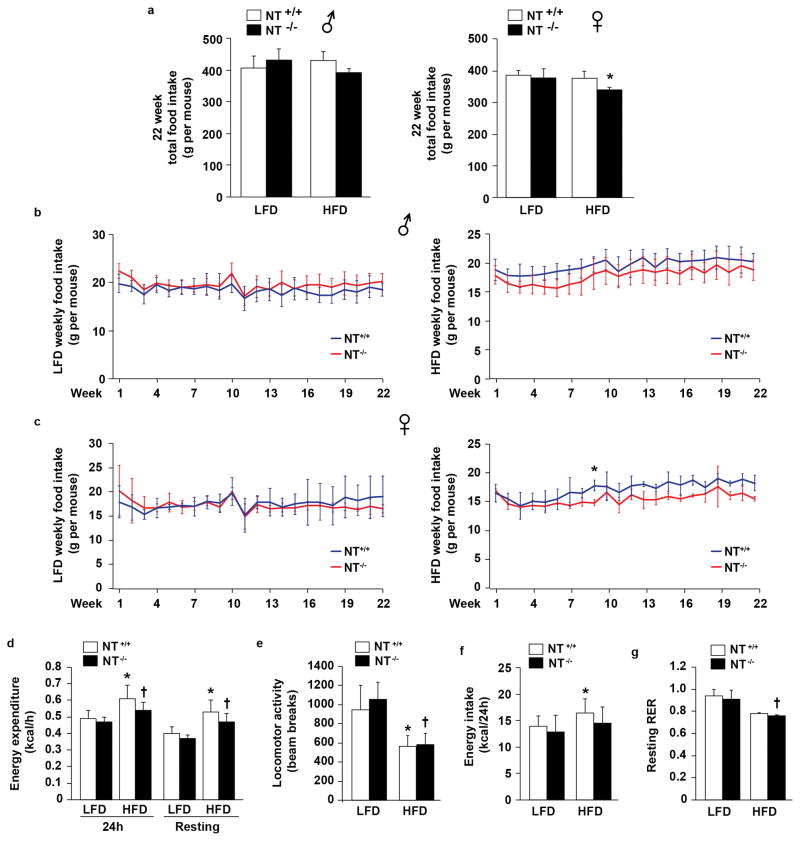
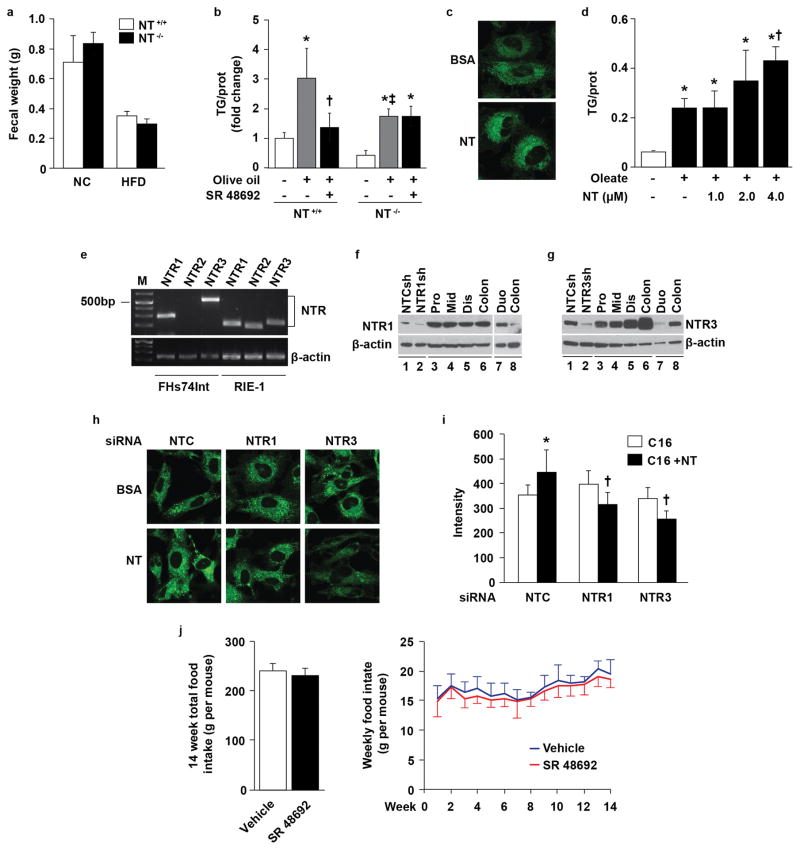
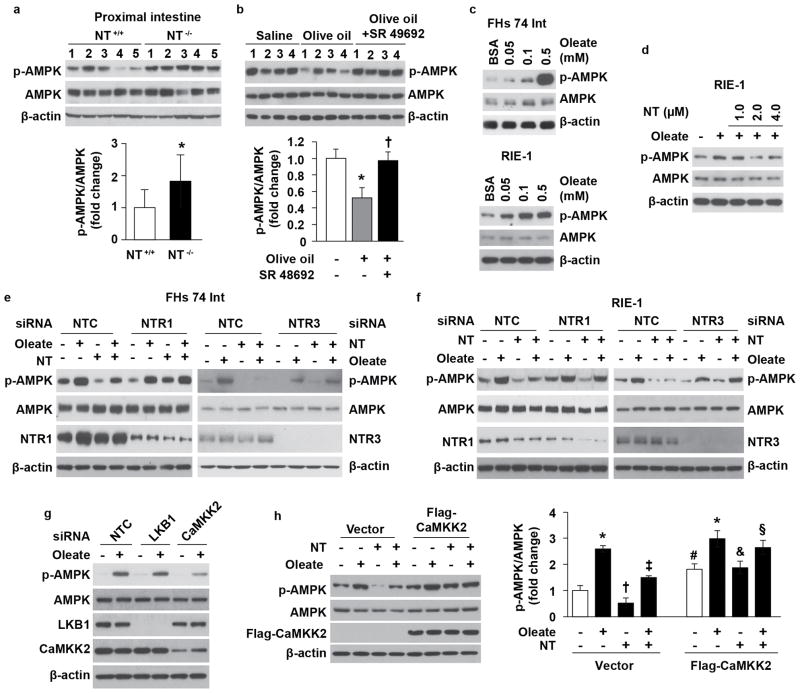
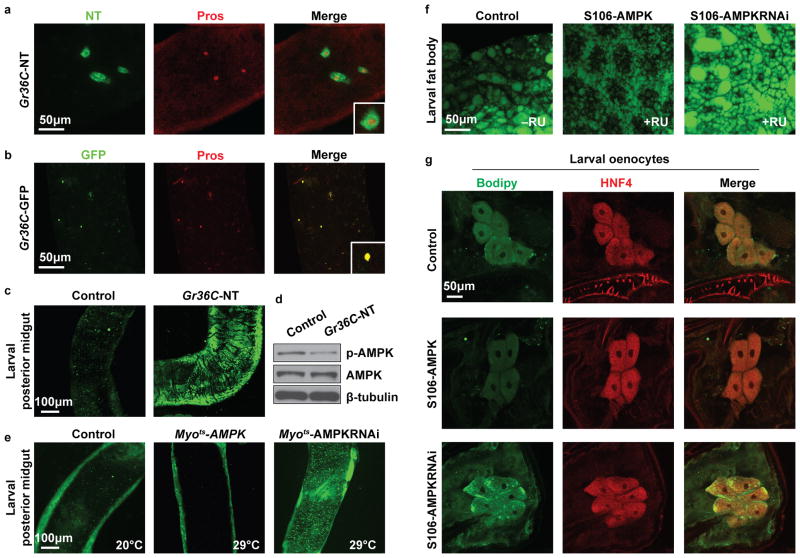
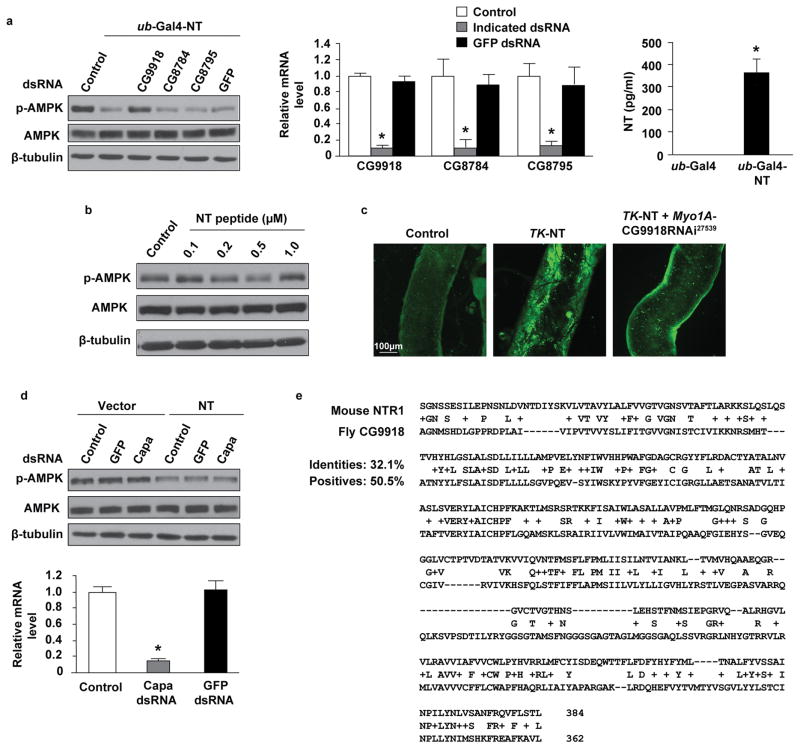
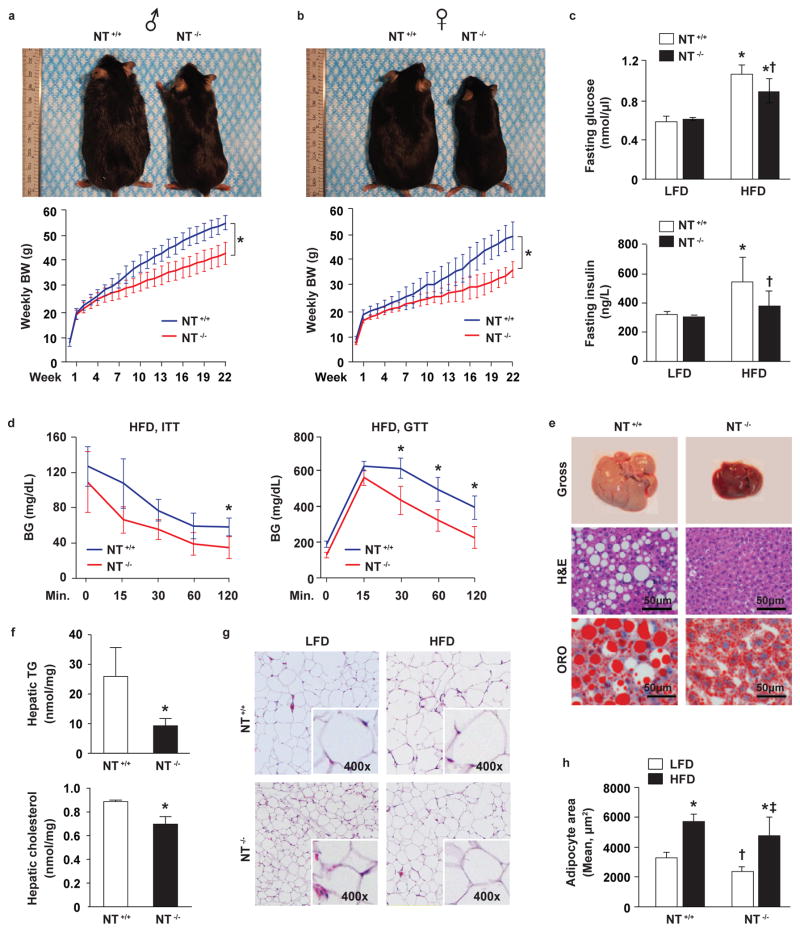
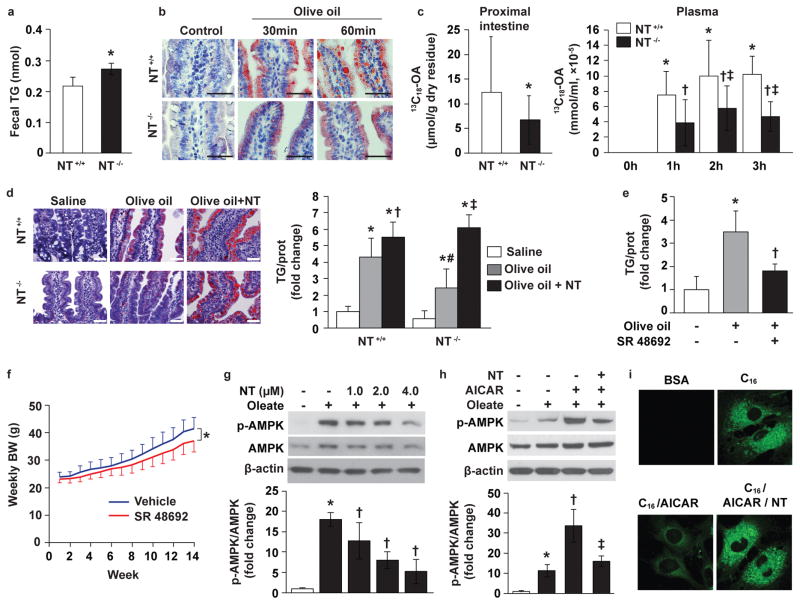
Obesity and its associated comorbidities (for example, diabetes mellitus and hepatic steatosis) contribute to approximately 2.5 million deaths annually and are among the most prevalent and challenging conditions confronting the medical profession. Neurotensin (NT; also known as NTS), a 13-amino-acid peptide predominantly localized in specialized enteroendocrine cells of the small intestine and released by fat ingestion, facilitates fatty acid translocation in rat intestine, and stimulates the growth of various cancers. The effects of NT are mediated through three known NT receptors (NTR1, 2 and 3; also known as NTSR1, 2, and NTSR3, respectively). Increased fasting plasma levels of pro-NT (a stable NT precursor fragment produced in equimolar amounts relative to NT) are associated with increased risk of diabetes, cardiovascular disease and mortality; however, a role for NT as a causative factor in these diseases is unknown. Here we show that NT-deficient mice demonstrate significantly reduced intestinal fat absorption and are protected from obesity, hepatic steatosis and insulin resistance associated with high fat consumption. We further demonstrate that NT attenuates the activation of AMP-activated protein kinase (AMPK) and stimulates fatty acid absorption in mice and in cultured intestinal cells, and that this occurs through a mechanism involving NTR1 and NTR3 (also known as sortilin). Consistent with the findings in mice, expression of NT in Drosophila midgut enteroendocrine cells results in increased lipid accumulation in the midgut, fat body, and oenocytes (specialized hepatocyte-like cells) and decreased AMPK activation. Remarkably, in humans, we show that both obese and insulin-resistant subjects have elevated plasma concentrations of pro-NT, and in longitudinal studies among non-obese subjects, high levels of pro-NT denote a doubling of the risk of developing obesity later in life. Our findings directly link NT with increased fat absorption and obesity and suggest that NT may provide a prognostic marker of future obesity and a potential target for prevention and treatment.


Conflict of interest statement

The authors declare no competing financial interests.

Figures

Extended Data Fig. 1
Extended Data Fig. 1. NT deficiency does not affect body length or small intestine morphology
a. Body length did not differ significantly between genotypes for either male (NT+/+ n=13, NT−/− n=12) or female (NT+/+ n=12, NT−/− n=12) mice. b–f. The average weight (b) and length (c) of the small intestine was similar between the genotypes (n=7). Proximal intestinal samples were H&E stained (d, bar=50 μm); villus height (e, n=6) and crypt numbers (f, n=6) have no significant differences between genotypes. Mice (7-mo-old) for all experiments were maintained on standard chow. All data are mean ± SD. Two-sided, Student’s t-test for all figures.
Extended Data Fig. 2
Extended Data Fig. 2. NT deficiency inhibits adiposity, inflammation and improves insulin/Akt signaling
a–c. Epididymal fat pad before (a, arrows) and after (b) dissection, and retroperitoneal fat pad (c, arrows) from male mice maintained on a normal chow (n=5). d–f. Representative epididymal (d, arrows), retroperitoneal (e) and pericardial fat pads (f) of male mice fed a HFD for 24wks (n=5). g. Weekly body weight (male NT+/+ and NT−/− n=13) and (female NT+/+ n=12, NT−/− n=14) of mice on a LFD for 22wks. *p<0.05 NT+/+ vs. NT−/− in male mice. h. Fat composition in male mice fed LFD or HFD for 24wks (n=5). *p<0.05 vs. LFD fat; †p<0.05 vs. NT+/+ LFD fat; ‡ p<0.05 vs. NT+/+ HFD fat; #p<0.05 vs. NT+/+ HFD lean. i. NT+/+ and NT−/− mice fed LFD or HFD for 22 wks after weaning were fasted overnight. Saline or insulin (5 units) was injected into the IVC. Five min after the injection, liver tissues were collected and protein extracts analyzed by western blot. A representative result is shown from 3 separate experiments. j. Male NT+/+ and NT−/− mice (7-mo-old) maintained on standard chow were fasted overnight followed by glucose (2 mg/kg) administration by gavage (n=5). Blood samples were collected both prior to and at the indicated times after glucose administration for measurement of plasma insulin (left panel) and glucose (right panel) levels. No statistically significant differences in either insulin or glucose levels were apparent between genotypes. k. Male NT+/+ and NT−/− mice (12-mo-old) fed standard diet after weaning were fasted for 16 h or fasted for 16 h and refed for 4 h (n=3). Blood was collected from IVC and plasma used to measure insulin. * p<0.05 vs. fasted NT+/+ mice. l. H&E staining of epididymal fat pad from male mice shown in Fig. 1g demonstrating inflammatory cells (arrows) (bar=100 μm). m. F4/80-positive macrophages (arrows) in epididymal fat pad from HFD-fed mice (bar=100 μm) (n=5). All data are mean ± SD. Linear mixed model for g; ANCOVA with Holm’s p-value adjustment for h, j, k (See Supplementary Fig. 1 for gel source data).
Extended Data Fig. 3
Extended Data Fig. 3. Food intake and indirect calorimetry measurements
a–c. Food intake was measured weekly for NT+/+ and NT−/− male (LFD n=3 and HFD n=4) and female (LFD n=3 and HFD n=4) mice. Analysis of cumulative food intake for 22wks did not show a significant difference except in female mice fed HFD. * p<0.05 vs. female NT+/+ fed HFD (a). For weekly food intake, there was no significant difference between genotypes in male mice on both diets (b) and female mice fed LFD (c, left panel); food intake on week 9 in female mice fed HFD reached significance between genotypes. * p<0.05 vs. NT−/− (c, right panel). d–g. Male mice on LFD and HFD diets for 24wks were placed in individual cages and indirect calorimetric analysis performed (n=10). Energy expenditure is presented by the average kcal/h in 24h and in resting period (d). Locomotor activity represents counts of beam breaks in a 30min-period (e). Energy intake represents the food intake in kcal for 24h (f). Resting RER is presented in g. * p<0.05 vs. LFD in NT+/+ mice; † p<0.05 vs. LFD in NT−/− mice. All data are mean ± SD. Two-sided, Student’s t-test per diet and sex groups for a; linear mixed model for b, c; ANCOVA for d, e, f, g.
Extended Data Fig. 4
Extended Data Fig. 4. NT promotes intestinal cell lipid absorption or accumulation
a. Fecal weight of male NT+/+ and NT−/− mice fed either normal chow (NC, NT+/+ n=4, NT−/− n=5) or HFD (NT+/+ n=7, NT−/− n=9) for 24wks; there was no significant difference between genotypes. b. Male NT+/+ and NT−/− mice (n=4) on normal chow were fasted overnight. Mice were injected with either saline or SR 48692 (2.5 mg/kg, i.p). Thirty min after the injection, mice were given olive oil (10 μl/g) by oral gavage and then sacrificed. The proximal small bowel was excised and intestinal TG content measured. *p<0.05 vs. saline in NT+/+ and NT−/− mice; † p<0.05 vs. olive oil only in NT+/+ mice; ‡ p<0.05 vs. olive oil only in NT+/+ mice. c. RIE-1 cells were pre-treated with BSA or NT (2 μM) for 30min, followed by incubation with BSA-conjugated BODIPY® FL C16 for 15min, and labeled lipids were visualized by confocal microscopy. Representative images are from 3 experiments. d. RIE-1 cells were pre-treated with or without NT at different concentrations for 30min followed by the addition of BSA-conjugated oleate (0.1 mM) and further incubation overnight. Cells were collected, lysed and TG was measured (n=3). * p<0.05 vs. BSA only; † p<0.05 vs. oleate only. e. Total RNA was isolated from human (FHs 74 Int) and rat (RIE-1) small intestinal epithelial cells and RT-PCR performed using specific primers targeting human or rat NTR1, 2 and 3. f–g. Expression of NTR1 (f) and NTR3 (g) was analyzed by western blot from mucosa scraped from mouse proximal (pro), middle (mid), distal (dis) small bowel and colon (lanes 3–6) as well as human duodenum (duo) and colon (lanes 7–8). Proteins from HepG2 (human hepatocellular carcinoma cell line) (e, lanes 1–2) and Caco-2 (human colon cancer cell line) (f, lanes 1–2) cells stably expressing NTR1, NTR3, or control (NTC) shRNA were used as positive and negative controls. h–i. RIE-1 cells transfected with non-targeting control (NTC) siRNA or NTR1 or NTR3 siRNA for 72h were treated with or without NT (2 μM) for 30min followed by BSA-conjugated BODIPY® FL C16 (C16) for 15min, and imaged by confocal microscopy to quantify fluorescence (h) and intensity (i) as described in Methods (n=30 cells). * p<0.05 vs. C16 in NTC siRNA; † p<0.05 vs. C16 plus NT in NTC siRNA. j. Cumulative (left panel) and weekly (right panel) food intake was measured in male wild type C57BL/6 mice fed HFD and chronically treated with either SR 48692 (n=13) or vehicle (n=12). Neither analysis demonstrated a significant difference. All data are mean ± SD. ANOVA with Holm’s p-value adjustment for a, b, d, i; two-sided, Student’s t-test for j (left panel); linear mixed model for j (right panel) (See Supplementary Fig. 1 for gel source data).
Extended Data Fig. 5
Extended Data Fig. 5. NT negatively regulates AMPK activity
a. Western blotting and densitometry of p-AMPK in proximal intestinal mucosa of male mice (12-mo-old) maintained on standard chow and fasted for 24 h (n=9). * p<0.05 vs. NT+/+. b. Western blotting and densitometry of p-AMPK levels using samples described in (Fig. 2e, n=8). * p<0.05 vs. saline; † p<0.05 vs. olive oil alone. c. FHs 74 Int (upper panel) and RIE-1 (lower panel) cells were treated with the indicated concentrations of oleate for 1h and lysates were analyzed by western blotting. d. RIE-1 cells were pre-treated with or without NT for 30min followed by combined treatment by BSA or oleate (0.1 mM) for 1h and western blot analysis. e. FHs 74 Int cells transfected with either human NTR1 or NTC siRNA (100 nM)), or either human NTR3 or NTC siRNA (20 nM) as indicated for 72h were pretreated with or without NT (2 μM) for 30min followed by treatment with oleate (0.1 mM) or BSA for 1h and western blot analysis. f. RIE-1 cells were transfected with rat siRNAs and treated with NT and oleate as described in (e). g. FHs 74 Int cells transfected with LKB1, CaMKK2 or control (all 40 nM) siRNAs for 3d were pretreated with NT (2 μM) for 30min followed by oleate (0.1 mM) for 1h and cell extracts were analyzed by western blotting. h. FHs 74 Int cells transfected with Flag-CaMKK2 and control vector for 48h were pretreated with or without NT (2 μM) followed by oleate (0.1 mM) for 1h and analyzed by western blotting (left panel); p-AMPK levels were determined as in (g) from 3 separate experiments (right panel). * p<0.05 vs. BSA in vector- and CaMKK2-transfected cells, respectively; † p<0.05 vs. BSA in vector-transfected cells; ‡ p<0.05 vs. oleate in vector-transfected cells; # p<0.05 vs. BSA in vector-transfected cells; & p<0.05 vs. NT alone in vector-transfected cells; § p<0.05 vs. oleate + NT in vector-transfected cells. All data are mean ± SD. Two-sided, Student’s t-test for a (lower panel); ANOVA with Holm’s p-value adjustment for b (lower panel), h (right panel) (See Supplementary Fig. 1 for gel source data).
Extended Data Fig. 6
Extended Data Fig. 6. NT regulates lipid droplet accumulation and AMPK activation in Drosophila midgut, fat body, and oenocytes
a. Midgut from Gr36C-NT adult (7d) was stained for NT and Prospero (Pros). Insets in a. and b. are high magnification images of individual Pros-expressing EE cells, co-expressing either NT, or nuclear GFP (see below), respectively (n=3). Bar, 50 μm. b. Similar experiment using Gr36C-Gal4 to drive nuclear GFP expression, demonstrating co-localization of GFP and Pros in nuclei of EE cells in adult flies (7d) (n=3). Bar, 50 μm. c. NT expression promotes the accumulation of lipid droplets. Midguts from either control Gr36C-Gal4 (left panel, 100%, n=15) or Gr36C-NT (right panel, 100%, n=19) 3rd instar larval stained with Bodipy. Similar results were obtained with Nile Red staining (data not shown). Bar, 100 μm. d. Western blot analysis of p-AMPK and AMPK levels in gastrointestinal tract of Gr36-Gal4 control and Gr36-NT 3rd instar larvae. e. Conditional expression of AMPK (middle panel, Myots-AMPK, 29°C, 86%, n=14) or AMPK RNAi (right panel, Myots-AMPKRNAi25931, 29°C, 91%, n=11) leads to either suppression or enhancement of lipid accumulation (visualized with Bodipy) as compared to control (left panel, Myots-AMPK, 20°C, 100%, n=9) 3rd instar larvae. Embryos were raised at 20°C and 96h after egg laying were switched to the nonpermissive temperature (29°C) to induce Gal4 expression. AMPK overexpression and RNAi inhibition were monitored by western blotting with AMPK antibody (data not shown). Bar, 100 μm. f. Similar results were obtained in 3rd instar larval fat bodies using a RU486- inducible S106-Gal4 driver to drive AMPK without RU486 (control, left panel, 100%, n=9), AMPK with RU486 (middle panel, 89%, n=9) or AMPK RNAi with RU486 (right panel, 100%, n=10) expression. Bar, 50 μm. g. Lipid accumulation in oenocytes (HNF-positive) visualized with Bodipy as in (e). Genotypes and fluorescent stains are indicated. Compare middle panels (100%, n=6) and bottom panels (89%, n=9) to top control panels (100%, n=8). Bar, 50 μm. (See Supplementary Fig. 1 for gel source data).
Extended Data Fig. 7
Extended Data Fig. 7. LC-MS/MS analysis of the processed NT peptide
a. The mass spectrum of the triply charged NT (NT3+) peptide eluted at 18.96 min in conditioned medium of S2 cells expressing full-length human NT precursor. The labeled three peaks are the isotopic envelope of NT3+ with a mass accuracy less than 2 ppm from the theoretical m/z value of 585.31050. b. The tandem mass spectrum of the triply charged NT3+ peptide. The m/z values of major fragment ions are designated, confirming the peptide as biologically active 13-amino acid NT. c. The amount of NT in S2 medium and fly GI tracts from adult Gr36C-NT flies (350 guts collected for each genotype) was quantified (N.D., not detected).
Extended Data Fig. 8
Extended Data Fig. 8. CG9918 (mouse NTR1 analog) RNAi blocks the NT-mediated decrease of p-AMPK levels in Drosophila S2 cells
a. S2 cells were transfected with ub-Gal4 plus UAST-NT (ub-Gal4-NT) or control (ub-Gal4) vector and treated with the indicated dsRNAs to knockdown individual receptors. Cell lysates were subjected to western blot with the indicated antibodies to examine the activation of AMPK (left panel). The efficiency of RNAi knockdown was monitored by real time-PCR (middle panel, n=3); * p<0.05 vs. control dsRNA. Medium from cells expressing either ub-Gal4 alone or ub-Gal4-NT was collected to examine NT levels by EIA, (right panel, n=6); * p<0.05 vs. ub-Gal4. b. S2 cells were treated with the indicated concentrations of NT peptide for 1h and AMPK activation was monitored as in (a). NT treatment (0.2, 0.5 μM) decreased p-AMPK to levels similar to those observed in ub-Gal4-NT transfected cells where NT levels reach approximately the same concentration (~350 pg/ml, 0.2 μM). c. Midguts of 3rd instar larvae from the indicated genotypes were stained with Bodipy to monitor the accumulation of lipid droplets. Left panel, w1118 control midgut accumulates low level of lipid (100%, n=8). Middle panel, larval midgut constitutively expressing NT by the TK promoter (TK-NT) accumulates high levels of lipid (100%, n=8). Right panel, larval midgut co-expressing TK-NT and Myo1A-CG9918RNAi27539 accumulated much lower levels of lipid (87%, n=15) compared to TK-NT midgut (middle panel). Bar, 100 μm. d. S2 cells were transfected with ub-Gal4-NT or control vector, treated with the indicated dsRNAs, and cell lysates were analyzed as in (a). Inactivation of Capability (Capa, CG15520), the Pyrokinin-1 in Drosophila, does not alter the levels of p-AMPK in either the presence or absence of NT (upper panel), indicating that NT prevents AMPK activation independently of Pyrokinin-1. Capa RNAi efficiency was monitored by real time-PCR (lower panel, n=3). * p<0.05 vs. control dsRNA. e. Amino acid sequence alignment of mouse NTR1 and Drosophila CG9918, identities and conserved residues (+) are indicated. All data are mean ± SD. ANOVA for a (middle panel), d (lower panel); two-sided, Wilcoxon rank-sum test for a (right panel). (See Supplementary Fig. 1 for gel source data).
Figure 1
Figure 1. Protective effects of NT-deficiency on obesity and comorbid conditions
a–b. Representative male (a) and female (b) NT+/+ and NT−/− mice fed a high-fat diet (HFD) for 22wks (upper panels). Body weight (BW) was measured weekly (lower panels) (male NT+/+ n=18 and NT−/− n=17 mice; female NT+/+ n=15 and NT−/− n=12 mice). BW slopes were compared: * p<0.05 NT+/+ vs. NT−/− mice. c. Plasma glucose (upper panel) and insulin (lower panel) levels quantified in 24h-fasted male mice maintained on a LFD or HFD for 24wks (LFD NT+/+ n=10, NT−/− n=10; HFD NT+/+ n=8, NT−/− n=10). * p<0.05 vs. LFD in NT+/+ and NT−/− mice, respectively; † p<0.05 vs. HFD in NT+/+ mice. d. Blood glucose (BG) during insulin tolerance test (ITT) (left panel, n=5) and glucose tolerance test (GTT) (right panel, n=3) in 6h-fasted male mice fed a HFD for 24wks. * p<0.05 vs. NT−/− mice. e. Gross, H&E and oil red O (ORO) imaging of livers of male mice fed a HFD for 24wks (n=5). Bar, 50μm. f. Hepatic triglyceride (TG) and cholesterol were analyzed by liquid chromatography–mass spectrometry (LC-MS) in 24h-fasted male mice fed a HFD for 24wks (n=3). * p<0.05 vs. NT+/+ mice. g. H&E staining of epididymal fat from male NT+/+ and NT−/− mice fed a LFD or HFD for 24wks (n=5). h. Quantitative analysis of adipocyte area (n=3). * p<0.05 vs. LFD in NT+/+ and NT−/− mice, respectively; † p<0.05 vs. LFD in NT +/+ mice; ‡ p<0.05 vs. HFD in NT +/+ mice. All data are mean ± SD. Linear mixed model for a, b; ANOVA with Holm’s p-value adjustment for c, h; two-sided, Student’s t-test for d, f (See methods).
Figure 2
Figure 2. NT deficiency reduces intestinal lipid absorption
a. Fecal triglyceride (TG) was analyzed in male mice fed a high-fat diet (HFD) for 24wks (n=3). * p=0.05 vs. NT+/+ mice. b. Oil red O (ORO) staining of proximal intestines from male mice fed normal chow with or without olive oil (OO) by oral gavage after overnight fasting (n=3). Bar, 50 μm. c. Levels of 13C18-oleic acid (OA) in male mice fed normal chow and given 13C18-OA mixed in olive oil by gavage after an overnight fast were analyzed by nanospray FT-MS. Left panel (n=5), * p<0.05 vs. NT+/+ mice. Right panel (n=4), *† p<0.05 vs. 0h in NT+/+ and NT−/− mice, respectively; ‡ p<0.05 vs. 2h and 3h in NT+/+ mice. d. ORO staining of proximal intestines from male mice following gavage with saline, olive oil, or olive oil plus NT (3600nmol/kg body weight, i.p.) after an overnight fast (left panel, n=5). Bar, 50 μm; TG (in mg) was quantified in proximal intestines and normalized to the amount of protein (in mg) as described in Methods (right panel) (n=5). Graph presents the fold change vs. saline in NT+/+ mice. * p<0.05 vs. saline in NT+/+ and NT−/− mice, respectively; † p<0.05 vs. OO in NT+/+ mice; ‡ p<0.05 vs. OO in NT−/− mice; # p<0.05 vs. OO in NT+/+. e. Proximal intestines from mice given saline, OO, or OO + SR 48692 were collected and TG levels quantified as described above (n=8). Graph presents the fold change vs. control mice. * p<0.05 vs. control mice; † p<0.05 vs. mice with OO only. f. Weekly body weight was measured in male wild type C57BL/6 mice fed HFD and treated with SR 48692 (2.5mg/kg diluted in diH2O and administered by oral gavage twice a day) or vehicle (vehicle n=12; SR 48692 n=13). BW slopes were compared: * p<0.05 vehicle vs. SR treatment. g–h. FHs 74 Int cells were pre-treated with or without NT at different dose as indicated for 30min followed by combined treatment with oleate (0.1 mM) for 1h and western blotting of cell extracts (top panel); densitometric analysis of p-AMPK is from 3 separate experiments and normalized to total AMPK; graph demonstrates the fold change of p-AMPK vs. BSA (lower panel). * p<0.05 vs. BSA; † p<0.05 vs. oleate alone; ‡ p<0.05 vs. oleate plus AICAR. h. FHs 74 Int cells were treated with or without NT (2 μM) for 30min followed by AICAR (1 mM) for 2h and oleate (0.1 mM) for 1h and analyzed by western blot (top panel); p-AMPK levels were determined as in (g) from 3 separate experiments (lower panel). * p<0.05 vs. BSA; † p<0.05 vs. oleate alone; ‡ p<0.05 vs. oleate + AICAR. i. FHs 74 Int cells were treated with NT (2 μM) for 30min followed by addition of AICAR (1 mM) for another 3h; cells were then incubated with BSA or BODIPY® FL C16 (C16) for 15min and images taken by confocal microscopy. Representative images are from 3 experiments. All data are mean ± SD. Two-sided, Student’s t-test for a, c (left panel); ANOVA with Holm’s p-value adjustment for c (right panel), d (right panel), e, g (lower panel), h (lower panel); linear mixed model for f (See methods). (See Supplementary Fig. 1 for gel source data.)
Figure 3
Figure 3. NT suppresses AMPK activation and promotes lipid accumulation in Drosophila
a. Midguts from 7d adult flies expressing either Gr36C-w1118 (control, 100%, n=7; the percentage used here and in subsequent analyses indicates the percent of organs exhibiting the phenotype) or Gr36C-NT (93%, n=15) were stained with Bodipy. Bar, 100 μm. b. Oenocytes on the basal surface of the lateral epidermis of 3rd instar larvae expressing Gr36C- w1118 (100%, n=15) or Gr36C-NT (93%, n=15) were stained with Bodipy to monitor lipid accumulation (green) and the anti-HNF4 antibody to mark the oenocytes (red). Bar, 50 μm. c. Fat bodies attached to the salivary gland from the 3rd instar larvae expressing Gr36C- w1118 (100%, n=14) or Gr36C-NT (100%, n=8) were stained with Bodipy. Bar, 50 μm. d. Flies expressing Gr36C- w1118 or Gr36C-NT (n=5) were treated with either standard or high-fat (HFD) diets, and guts were stained with Nile Red to examine the accumulation of lipids (arrows). Bar, 100 μm. e. NT was expressed by voila-Gal4 and TG (in mg) was measured and normalized to body weight (in mg) in male adult flies fed either standard diet (SD) or HFD (n=3). voila-w1118 served as control. * p<0.05 vs. SD in control- and NT-expressing flies, respectively; † p<0.05 vs. SD in control flies; ‡ p<0.05 vs. HFD in control flies. f. Western blotting was performed to monitor the levels of AMPK in adult midgut shown in (a). g. Myo1A-Gal4 combined with tub-Gal80ts (Myots) does not express active Gal4 at 20°C permissive temperature. Shown in the left panel is the midgut from a 7d adult expressing Myots-AMPK raised at 20°C, stained with Bodipy, and used as a control (100%, n=11). Midguts expressing AMPK (middle panel, 94%, n=16) or AMPKRNAi25931 (right panel, 100%, n=12) from 7d adults at 29°C (active Gal4) were stained with Bodipy. Bar, 100 μm. The levels of AMPK were monitored by western blot. All data are mean ± SD. ANOVA with Holm’s p-value adjustment for e (See methods). (See Supplementary Fig. 1 for gel source data.)

Comment in

References

    1. Ogden CL, Yanovski SZ, Carroll MD, Flegal KM. The epidemiology of obesity. Gastroenterology. 2007;132:2087–2102. - PubMed
    1. Kopelman PG. Obesity as a medical problem. Nature. 2000;404:635–643. - PubMed
    1. Guh DP, et al. The incidence of co-morbidities related to obesity and overweight: a systematic review and meta-analysis. BMC Public Health. 2009;9:88. - PMC - PubMed
    1. Polak JM, et al. Specific localisation of neurotensin to the N cell in human intestine by radioimmunoassay and immunocytochemistry. Nature. 1977;270:183–184. - PubMed
    1. Ferris CF, Hammer RA, Leeman SE. Elevation of plasma neurotensin during lipid perfusion of rat small intestine. Peptides. 1981;2(Suppl 2):263–266. - PubMed

Publication types

MeSH terms