

Translation elicits a growth rate-dependent, genome-wide, differential protein production in Bacillus subtilis
- PMID: 27193784
- PMCID: PMC5683663
- DOI: 10.15252/msb.20156608
Translation elicits a growth rate-dependent, genome-wide, differential protein production in Bacillus subtilis
Abstract
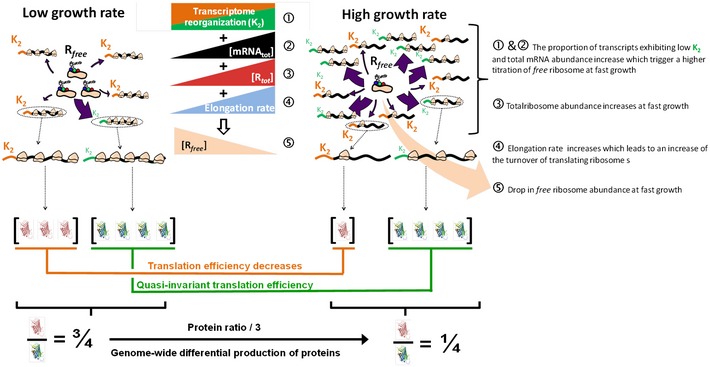
Complex regulatory programs control cell adaptation to environmental changes by setting condition-specific proteomes. In balanced growth, bacterial protein abundances depend on the dilution rate, transcript abundances and transcript-specific translation efficiencies. We revisited the current theory claiming the invariance of bacterial translation efficiency. By integrating genome-wide transcriptome datasets and datasets from a library of synthetic gfp-reporter fusions, we demonstrated that translation efficiencies in Bacillus subtilis decreased up to fourfold from slow to fast growth. The translation initiation regions elicited a growth rate-dependent, differential production of proteins without regulators, hence revealing a unique, hard-coded, growth rate-dependent mode of regulation. We combined model-based data analyses of transcript and protein abundances genome-wide and revealed that this global regulation is extensively used in B. subtilis We eventually developed a knowledge-based, three-step translation initiation model, experimentally challenged the model predictions and proposed that a growth rate-dependent drop in free ribosome abundance accounted for the differential protein production.
Keywords: Bacillus subtilis; global regulation; growth rate; protein production; translation efficiency.
© 2016 The Authors. Published under the terms of the CC BY 4.0 license.
Figures

Total RNA abundance in B. subtilis (blue dots) at different growth rates (0.25 h−1, 0.40 h−1, 0.60 h−1, 1.2 h−1 and 1.7 h−1; this work). The 95% confidence intervals are shown with horizontal and vertical bars. Previously quantified total RNA abundance in B. subtilis (green dots) from Dauner et al (2001). Data are fit with a first‐order polynomial.
Scheme of the experimental design developed to quantify the relative abundance of total mRNA and of each transcript across growth conditions. r 1 and r 2 stand for total ribosomal RNA amounts, t 1 and t 2 stand for total transfer RNA amounts, and m 1 and m 2 stand for total messenger RNA amounts in growth conditions 1 and 2, respectively. S i corresponds to the amount of the ten different in vitro‐synthesized (spike‐in) transcripts. c 1, c 2 and c Si correspond to the amounts of cDNA reverse transcribed from m 1, m 2 and S i. Note that the amount of S i added to the total RNA extract of either growth condition is identical, which straightforwardly allows calculating the scaling factor between growth conditions (see Appendix section 1.4).
Mean‐normalized scaling factor.
First‐order polynomial fit of normalized total mRNA abundance (as inferred from the scaling factor and total RNA abundance). The total mRNA abundance measured at slow growth (μ = 0.4 h−1) was then assigned a value of 1.0 and total mRNA abundances across the other conditions were reported normalized to this value (in arbitrary units, AU; note that AU is a quantity.OD600 −1). The 95% confidence interval is shown with shaded areas.
The population of transcripts was sorted into two groups using a slow (μ = 0.4 h−1) and a fast growth condition (μ = 1.7 h−1). The first group contained transcripts for which the abundance increased faster than the growth rate (green), and the second group included all other transcripts (orange). The enriched sub‐group of transcripts at fast growth contained the ribosomal mRNAs (dark green) and several non‐ribosomal mRNAs (light green). The corresponding datasets can be found in Dataset EV1.

Total RNA abundance as function of the growth rate. Data are linearly fit (dashed line).
First‐order polynomial fit of total RNA abundance (black) and rRNA abundance (red, as calculated from the rRNA percentage within the total RNA pool; panels C and D). The 95% confidence intervals are shown with shaded areas.
Percentage of each rRNA species (filled‐in circles) in total RNA as function of the growth rate. rRNA sub‐species are fit with a second‐degree polynomial (dashed line). The corresponding 95% confidence band is given by the coloured area.
Percentage of total rRNA species (filled‐in circles) in total RNA as function of the growth rate obtained by summing every rRNA species (from panel C). Total rRNA is fit with a first‐degree polynomial (dashed line). The corresponding 95% confidence band is given by the coloured area.
Distribution histograms of one (out of four replicates) representative expression dataset (spike‐in genome‐wide array) per medium.
Plots of a representative gene expression dataset from SE‐, S‐, CH‐ and CHG‐grown cells vs. a representative gene expression dataset from CHG‐grown cells. The red line corresponds to the bisector and the blue lines to linear fits. Blue and red lines are identical when plotting two replicates of the very same growth condition (CHG vs. CHG), while with increasing growth rates, expressions of an increasing number of genes are switched off.
Normalized mRNA abundance of four constitutively expressed genes (see Fig 2B). The 95% confidence intervals are shown with bars. The corresponding datasets can be found in Dataset EV1.

Blue dots represent the GFP abundance in different growth conditions (average of 12 technical replicates); the 95% confidence intervals are given as horizontal and vertical bars. Data were fit with a third‐order polynomial (dashed line), and the 95% confidence interval of the fit is shown in grey.
Normalized fbaA transcript abundance (i.e. proportion of fbaA transcript within total mRNA × normalized total mRNA abundance from Fig 1D).
Relative abundance (measured by qPCR) of the gfp mRNA to the endogenous fbaA mRNA in strain fbaATIRfbaA as a function of the growth rate. Filled circles are the mean of eight replicates in one medium; the 95% confidence intervals are depicted as bars. Data are fit with a third‐order polynomial (dashed line), and the 95% confidence interval of the fit is shown in grey.
Deduced translation efficiency (h−1) of the fbaATIRfbaA construct as a function of the growth rate. Note that translation efficiency in h−1 is a slight abuse of notation since we divided protein abundance (in FAU.OD600 −1) by the normalized transcript abundance (AU, quantity.OD600 −1). The 95% confidence interval is shown in grey. The corresponding datasets can be found in [Link], [Link].

- A, B
Relative abundance (qPCR) of the gfp mRNA to the natural fbaA mRNA in the different strains as function of the growth rate. Filled‐in circles correspond to 8 replicates per medium. Data are fit with a third‐degree polynomial (dashed line) and the 95% confidence bands are given by the coloured area.
- C
The gfp mRNA produced by the hsTIR0 construct exhibits a differential stability with increasing growth rate as compared to that of hsTIRfbaA, the 95% confidence bounds is given as bar and the data are fit with a third‐degree polynomial polynomial (dashed line).
- D
Ratios between the relative abundance of gfp mRNAs from the different strains and that of the fbaATIRfbaA strain are invariant with growth rate. Filled‐in circles are the mean of the 8 replicates (from panel A) per medium; the 95% confidence bounds are given as bars and the data are fit with first‐degree polynomial (dashed line).
- E
as a function of for the fbaATIRfbaA strain (in blue) using the dataset plotted on Fig 2 and linearly fitted (dashed line). The straight line has a slope of −1 and indicates a linear dependency to μ−1.
- F
as a function of for the fbaATIRmodif1 and fbaATIRshort (in red and green, respectively) using the dataset plotted in Fig 3 and linearly fitted (dashed lines). The straight line has a slope of ‐1 and indicates a linear dependency to μ−1.
- G, H
The black dots represent ratios of translation efficiencies (λ) between two strains (hsTIRfbaA gfp vs. hsTIRmodif2 gfp on panel G; hsTIRfbaA gfp vs. hsTIR modif1 gfp on panel H) and 95% of confidence is given as vertical bars. The dashed curves are computed using the parameters estimated on Fig 4. The corresponding datasets can be found in Dataset EV2.

- A
Circles represent the GFP abundance (in fluorescence arbitrary units by optical density units: FAU.OD600 −1) measured during exponential growth for 12 replicates at a given growth rate for constructs fbaATIRfbaA gfp, fbaATIRmodif1 gfp and fbaATIRshort gfp. The GFP levels were fit with a third‐degree polynomial (dashed line); 95% confidence intervals are given in the coloured areas.
- B, C
Black dots represent the ratio of the GFP abundance after correction of the different mRNA stability by qPCR (i.e. ratio of translation efficiencies, λ) between two strains (fbaATIRshort gfp vs. fbaATIRmodif1 gfp in panel B; fbaATIRshort gfp vs. fbaATIRfbaA gfp in panel C) and the 95% confidence intervals are given as vertical bars (see Appendix section 3.1). The dashed curves are computed using the parameters estimated on Fig 4. The corresponding datasets can be found in Dataset EV2.

Inference of R free abundance. R free abundance was fit with a third‐order polynomial (black line); the 95% confidence interval is given by the grey area (see Appendix section 3.3).
Set of {K 1i, K 2i} pairs for six synthetic constructs. The three upper plots correspond to synthetic constructs having a translation efficiency as and the three lower plots correspond to synthetic constructs having a translation efficiency as, with large as compared to . The ratio K 1 hsTIRfbaA/K 2 hsTIRfbaA was scaled to 1 in order to relatively estimate the entire set of K 1i and K 2i constants (for detailed explanation, see Appendix section 3.3). Red curves represent model‐based fits of GFP abundance quantified in more than 120 cultures for each bacterial strain (black dots).
Relative translation efficiencies of the six strains from panel (B) (fbaATIRfbaA gfp in blue, fbaATIRmodif1 gfp in red, fbaATIRshort gfp in green and hsTIRfbaA gfp, hsTIRmodif1 gfp and hsTIRmodif2 gfp in black). The grey area corresponds to the space of possible translation efficiencies, which is bounded by the translation efficiency when K 2i is much larger than R free (hsTIRfbaA gfp, hsTIRmodif1 gfp and hsTIRmodif2 gfp) and when R free is much larger than K 2i (theoretical values, dashed black line). The corresponding datasets can be found in Dataset EV2.

Plot of the values of K 1i (in log10) vs. K 2i (in log10) for each of the 698 transcripts (i), denoted R free‐unsaturated, for which translation efficiencies were in the form of a Michaelis–Menten‐type rate law. For illustration purpose, filled‐in circles correspond to the tufA (in red) and sdpC (in blue) transcripts. The grey area represents the variation in R free (Fig EV3C). 223 transcripts, denoted R free‐saturated, exhibited a constant translation efficiency (i.e. K 2i ˜ 0, Fig EV3A) and 81 transcripts, denoted R free‐undersaturated, exhibited a linear relationship between their translation efficiencies and R free (i.e. K 2i ≫ R free, Fig EV3B).
Gene‐specific, growth rate‐dependent translation efficiencies estimated for 1,002 transcripts (i, index of transcripts) and normalized to the growth‐rate point 0.25 h−1 (colour bar and z‐axis). The plain lines separate transcripts by groups of fifty. The list of the transcripts corresponding to each panel can be found in Dataset EV3.

Plot of the K 1i (in log10) of each of the 223 transcripts (i, index of transcripts) that exhibited a constant translation efficiency (R free‐saturated).
Plot of the values of K 1i/K 2i ratio (in log10) of each of the 81 transcripts (i, index of transcripts) that exhibited a linear relationship between their translation efficiencies and R free (R free‐undersaturated).
Inference of R free abundance from the genome‐wide proteome and transcriptome datasets (black line); the 95% confidence interval is given by the grey area (see Appendix section 3.4). The free ribosome abundance at slow growth was assigned a value of 1.0 and free ribosome abundance in other conditions is reported normalized to this value. The free ribosome abundance estimated from the synthetic reporter library is represented with the dashed black line. The list of the transcripts corresponding to panels (A) and (B) can be found in Dataset EV3.
Complete model of protein (Pi) production derived from Fig 7A, with the translation efficiency in parentheses (for more detail, see Appendix section 2).
Putative R free abundance variation with respect to the addition of a translation inhibitor. The R free abundance in media with 1 mg ml−1 tetracycline (green line) compared with R free abundance in media without tetracycline (black line).

Inhibition of the elongation phase results in an increase in total ribosome abundance (modified from Scott et al, 2010).
Circles represent the ratios of translation efficiencies computed at each growth rate for 12 replicate cultures of the fbaATIRmodif1 gfp and fbaATIRshort gfp strains. The dark grey, blue and red dots correspond to the ratios obtained in the presence of 0, 0.5 and 1 mg ml−1 tetracycline, respectively. The green and purple arrows overlay the “ratio vs. μ” variations resulting from the addition of tetracycline in rich (CH, CHG) and intermediate (S, TS) media, respectively. The orange area illustrates the little variation in the ratios in poor media (M9SE and M9P). The corresponding datasets can be found in Dataset EV4. The 95% confidence intervals are given as vertical bars.

Knowledge‐based, three‐step translation initiation model (for more information, see Appendix section 2.1). The growth rate‐dependent molecular entities and rates of the translation initiation process are the abundance of the translation initiation complex (R free), the 50S subunit, the mRNA abundance (mRNAi) and the protein elongation aggregated parameter (k pi, Table 2; Bremer & Dennis, 2008). The growth rate‐independent parameters are the binding constant of R free onto the mRNAi (k bi), the release constant (k ‐bi) of mRNAi‐associated R free (R bi), the accommodation constant (k ai) of R bi on the start codon, the disaccommodation constant (k‐ai) of Rbi‐accommodated Rai from the start codon and the constant of the initiation of translation elongation (kti).
The elementary three‐step translation initiation model gives rise to translation efficiency in the form of a Michaelis–Menten‐like equation with the two integrative constants, K 1i and K 2i (see Fig EV3).
Formal relationship relating total ribosome (RTot) and mRNA species (mi) abundances with the free ribosome abundance (R free; see Appendix section 2.3). The sum of the Michaelis–Menten‐like equations (blue) is an increasing function of global and gene‐specific variables (ϕ([R free], [mi], K 1i, K 2i, k pi)). n indicates the number of different mRNA species.
The left and right parts of the equation from panel (C), respectively, in purple and blue, are plotted vs. the free ribosome abundance, [R free]. The intersection (①) corresponds to the equilibrium in a given growth condition. Following a growth‐rate increase from μ1 to μ2 (μ2 > μ1), total ribosome abundance increases (from plain to dashed purple line), and the equilibrium (②) is shifted towards a decrease in R free abundance. The global growth rate‐dependent transcriptome reorganization (Fig 1E) can directly trigger a drop in R free abundance by increasing titration if a significant fraction of the transcripts from the first class (green) exhibits lower K 2i values than the second class (orange).


- A–C
The hsTIRfbaA gfp transcript abundance increases with increasing growth rate (violet to grey), while the translation efficiency strongly decreases since the K 2 constant does not compensate for the drop in R free abundance.
- D–F
The fbaATIRshort gfp transcript abundance increases with increasing growth rate (violet to grey), while the translation efficiency only slightly decreases because the K 2 constant partially compensates for the drop in R free abundance.
- G–I
The dhaSTIRdhaS gfp transcript abundance decreases with increasing growth rate (violet to grey), which is the consequence of its chromosomal location at the vicinity of the terminus of replication. The translation efficiency strongly decreases since the K 2 constant does not compensate for the drop in R free abundance.
- J–L
The ackATIRackA gfp transcript abundance strongly increases with increasing growth rate (violet to grey) and compensate for the strong drop in translation efficiency. The ackA gene is not supposed to be regulated neither positively nor negatively in the growth media used to reach the four different growth rates.
References
-
- Aichaoui L, Jules M, Le Chat L, Aymerich S, Fromion V, Goelzer A (2012) BasyLiCA: a tool for automatic processing of a Bacterial Live Cell Array. Bioinformatics 28: 2705–2706 - PubMed
-
- Botella E, Fogg M, Jules M, Piersma S, Doherty G, Hansen A, Denham EL, Le Chat L, Veiga P, Bailey K, Lewis PJ, van Dijl JM, Aymerich S, Wilkinson AJ, Devine KM (2010) pBaSysBioII: an integrative plasmid generating gfp transcriptional fusions for high‐throughput analysis of gene expression in Bacillus subtilis . Microbiology 156: 1600–1608 - PubMed
-
- Bremer H, Dennis PP (2008) Modulation of chemical composition and other parameters of the cell at different exponential growth rates In EcoSal — Escherichia coli and Salmonella: Cellular and Molecular Biology, Böck A, Curtiss R, III, Kaper JB, Karp PD, Neidhardt FC, Nyström T, Slauch JM, Squires CL, Ussery D. (eds), 5.2.3. Washington, DC: ASM Press; - PubMed
Publication types
MeSH terms
Substances
LinkOut - more resources
Full Text Sources
Other Literature Sources
Molecular Biology Databases
