. 2016 May 18:17:370.
doi: 10.1186/s12864-016-2690-6.

Host specialization of the blast fungus Magnaporthe oryzae is associated with dynamic gain and loss of genes linked to transposable elements

Affiliations

Host specialization of the blast fungus Magnaporthe oryzae is associated with dynamic gain and loss of genes linked to transposable elements

Kentaro Yoshida et al. BMC Genomics. .

Abstract

Background: Magnaporthe oryzae (anamorph Pyricularia oryzae) is the causal agent of blast disease of Poaceae crops and their wild relatives. To understand the genetic mechanisms that drive host specialization of M. oryzae, we carried out whole genome resequencing of four M. oryzae isolates from rice (Oryza sativa), one from foxtail millet (Setaria italica), three from wild foxtail millet S. viridis, and one isolate each from finger millet (Eleusine coracana), wheat (Triticum aestivum) and oat (Avena sativa), in addition to an isolate of a sister species M. grisea, that infects the wild grass Digitaria sanguinalis.

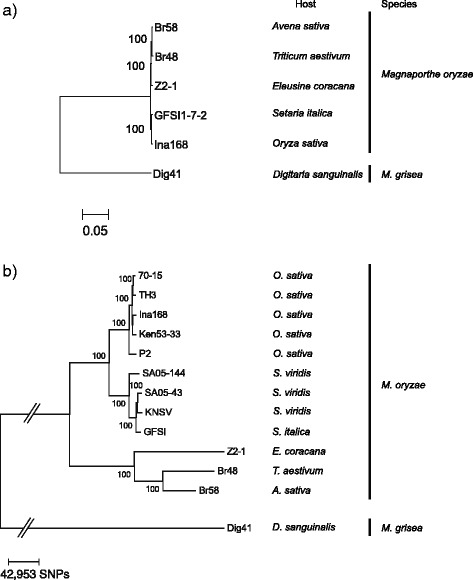
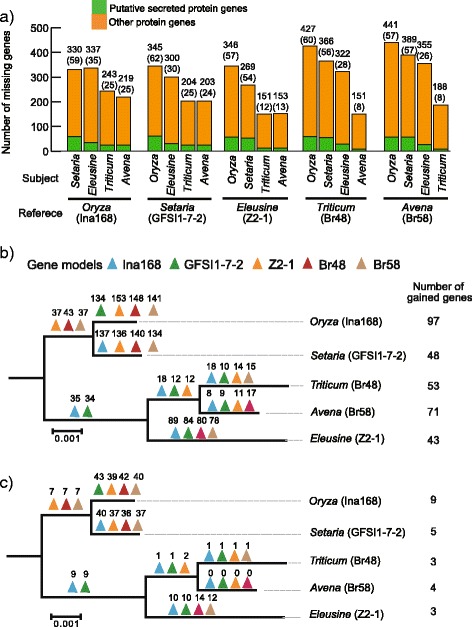
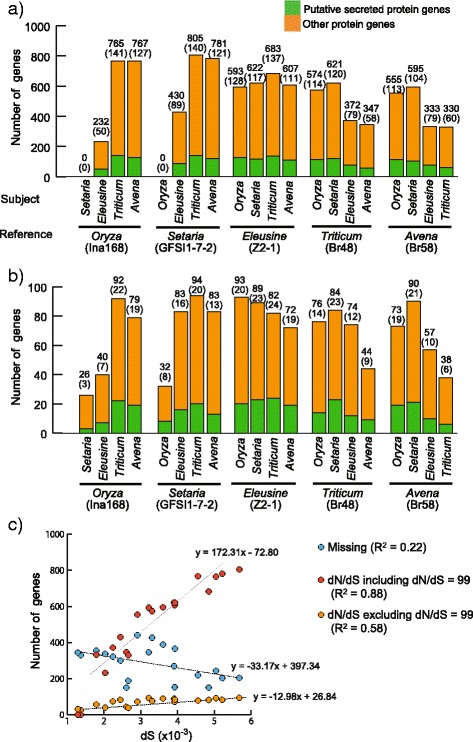
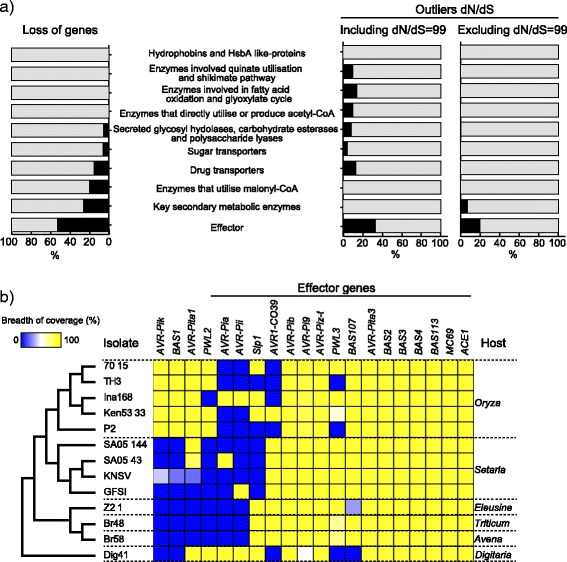
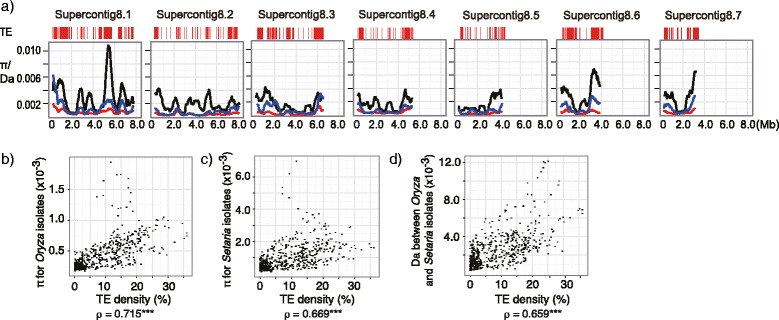
Results: Whole genome sequence comparison confirmed that M. oryzae Oryza and Setaria isolates form a monophyletic and close to another monophyletic group consisting of isolates from Triticum and Avena. This supports previous phylogenetic analysis based on a small number of genes and molecular markers. When comparing the host specific subgroups, 1.2-3.5 % of genes showed presence/absence polymorphisms and 0-6.5 % showed an excess of non-synonymous substitutions. Most of these genes encoded proteins whose functional domains are present in multiple copies in each genome. Therefore, the deleterious effects of these mutations could potentially be compensated by functional redundancy. Unlike the accumulation of nonsynonymous nucleotide substitutions, gene loss appeared to be independent of divergence time. Interestingly, the loss and gain of genes in pathogens from the Oryza and Setaria infecting lineages occurred more frequently when compared to those infecting Triticum and Avena even though the genetic distance between Oryza and Setaria lineages was smaller than that between Triticum and Avena lineages. In addition, genes showing gain/loss and nucleotide polymorphisms are linked to transposable elements highlighting the relationship between genome position and gene evolution in this pathogen species.

Conclusion: Our comparative genomics analyses of host-specific M. oryzae isolates revealed gain and loss of genes as a major evolutionary mechanism driving specialization to Oryza and Setaria. Transposable elements appear to facilitate gene evolution possibly by enhancing chromosomal rearrangements and other forms of genetic variation.

Keywords: Evolution; Functional redundancy; Host specialization; Magnaporthe oryzae; Pathogenomics; Transposable elements.


Figures

Fig. 1
Fig. 1
Phylogenetic relationship for Magnaporthe oryzae infecting crops and M. grisea. a The maximum likelihood (ML) tree based on third codon positions of 3257 single copy genes. b The ML tree based on 859,067 SNPs distributed on the whole genome. M. grisea (Dig41) was used as an outgroup. The numbers on the branches indicate bootstrap probability. The right of the tree show their corresponding host species. The bar below the tree shows genetic distance per site
Fig. 2
Fig. 2
The gain and loss of genes in the five representatives of Magnaporthe oryzae host-specific subgroups. a The bar plot shows the number of missing genes from each reference genome. The number of secreted protein genes is shown in parentheses. b The event of gain and loss of genes on the evolutionary history of the five representatives of M. oryzae. c The event of gain loss of putative secreted protein genes. The triangles indicate deletion events for each gene model of the host-specific subgroups of M. oryzae. The numbers above the triangles are corresponding to the number of genes that was lost once in the evolutionary history of M. oryzae. Blue, green yellow, red and ivory indicate the gene models of Oryza isolate Ina168, Setaria isolate GFSI1-7-2, Eleusine isolate Z2-1, Triticum isolate Br48, and Avena isolate Br58, respectively. At the right of the tree, the number of gain of genes for each host-specific subgroup was shown
Fig. 3
Fig. 3
A contrast pattern between nucleotide substitutions and gain/loss of genes in the host-specific subgroups of Magnaporthe oryzae. a-b The bar plot shows the number of genes showing outlier values of dN/dS between the reference isolate and each of other four representatives when dN/dS = 99 was included (a) or excluded (b). The green and orange bars are corresponding to secreted protein genes and non-secreted protein genes, respectively. The number of secreted protein genes is shown in parentheses. c The plot between the number of polymorphic genes and the number of synonymous substitutions per site. The red and blue circles indicate missing genes and genes showing dN/dS > 1.5, respectively. Each of the trend lines is shown
Fig. 4
Fig. 4
Characterization of genes showing gain/loss and excess of nonsynonymous substitutions. a-c The pie charts indicate the number of proteins whose domains were detected more than once or only once in the genome in four categories. The high percentage of genes experiencing loss (a) and with outlier values of dN/dS when dN/dS = 99 was included (b) or excluded (c) encodes proteins whose domains are present in multiple copies in each genome. d The percentage of shared domains of proteins whose genes showing presence/absence polymorphisms between two host-specific subgroups. e-f The percentage of shared domains of proteins whose genes showing outlier values of dN/dS between two host-specific subgroups when dN/dS = 99 was included (e) or excluded (f). The numbers in (d-f) are corresponding to the number of pfam domain. The values in (a-f) are shown when Z-1 gene model was used
Fig. 5
Fig. 5
Highly polymorphic in the effector genes between and within the host-specific subgroups of M. oryzae. a The percentage of genes showing loss, outlier values of dN/dS when dN/dS was included or excluded for each functional category. The black and gray bars indicate the percentage of genes showing loss or outlier values of dN/dS and the others, respectively. These percentages were calculated when we used 70-15 strain genome as the reference. b Distribution of presence and absence of genes encoding the known effectors in M. oryzae and M. grisea. Heat map shows breadth coverage of genes. The blue and yellow panels indicate absence and presence polymorphisms, respectively. The tree indicates the relationship among the tested pathogens based on Fig. 1b
Fig. 6
Fig. 6
Genes showing presence and absence polymorphisms are linked to transposable elements. a The alignments view of short reads around SLP1 region. SLP1 was surrounded by multiple mapping reads and partial LTR retrotransposons. b Distribution of presence and absence polymorphisms within Oryza and Setaria isolates according to local TE density. Magnaporthe genes were ranked on the basis of ascending distance from 5’-end (y-axis) and 3’-end (x-axis) of genes to TEs. The number of genes corresponding to genes in each bin is shown as a heat map. 25, 50 and 75 % indicate first quartile, median and third quartile, respectively. The left and right panels are the distributions of all genes and genes showing presence/absence polymorphisms, respectively. c The bar plot shows the ratio of the number of genes showing presence and absence polymorphisms within Oryza and Setaria isolates to genes at each of category C1, C2, and C3. Statistical significance was evaluated by using exact Wilcoxon Mann–Whitney rank sum test (***: P < 0.001). Since the ratio in the C3 was very small, the value is not seen in the figure
Fig. 7
Fig. 7
The level of DNA polymorphisms in M. oryzae is correlated with the density of transposable elements. a Results of sliding window analysis of π for Oryza isolates (red), π for Setaria isolates (blue), and the number of net nucleotide substitutions per site (Da) (Nei 1987) between Oryza and Setaria isolates are given for seven supercontigs. These values were estimated based on nucleotide variations at synonymous sites and noncoding regions. Window size is 500 Kbp. Step size is 50 Kbp. TE: location of transposable elements. Correlation between the density of transposable elements and three measurements: nucleotide diversity (π) of Oryza (b) and Setaria (c) isolates, and distance (Da) between Oryza and Setaria isolates (d)

References

    1. Kato H, Yamamoto M, Yamaguchi-Ozaki T, Kadouchi H, Iwamoto Y, Nakayashiki H, et al. Pathogenicity, Mating Ability and DNA Restriction Fragment Length Polymorphisms of Pyricularia Populations Isolated from Gramineae, Bambusideae and Zingiberaceae Plants. J Gen Plant Pathol. 2000;66:30–47. doi: 10.1007/PL00012919. - DOI
    1. Dean R, Van Kan JAL, Pretorius ZA, Hammond-Kosack KE, Di Pietro A, Spanu PD, et al. The Top 10 fungal pathogens in molecular plant pathology. Mol Plant Pathol. 2012;13:414–30. doi: 10.1111/j.1364-3703.2011.00783.x. - DOI - PMC - PubMed
    1. Talbot NJ. On the trail of a cereal killer: Exploring the biology of Magnaporthe grisea. Annu Rev Microbiol. 2003;57:177–202. doi: 10.1146/annurev.micro.57.030502.090957. - DOI - PubMed
    1. Couch BC, Fudal I, Lebrun M-H, Tharreau D, Valent B, van Kim P, et al. Origins of host-specific populations of the blast pathogen Magnaporthe oryzae in crop domestication with subsequent expansion of pandemic clones on rice and weeds of rice. Genetics. 2005;170:613–30. doi: 10.1534/genetics.105.041780. - DOI - PMC - PubMed
    1. Hirata K, Kusaba M, Chuma I, Osue J. Speciation in Pyricularia inferred from multilocus phylogenetic analysis. Mycol Res. 2007;111:799–808. doi: 10.1016/j.mycres.2007.05.014. - DOI - PubMed

Publication types

Substances

LinkOut - more resources