. 2016 May 18;36(20):5472-88.
doi: 10.1523/JNEUROSCI.1720-15.2016.

Npas1+ Pallidal Neurons Target Striatal Projection Neurons

Affiliations

Npas1+ Pallidal Neurons Target Striatal Projection Neurons

Kelly E Glajch et al. J Neurosci. .

Abstract

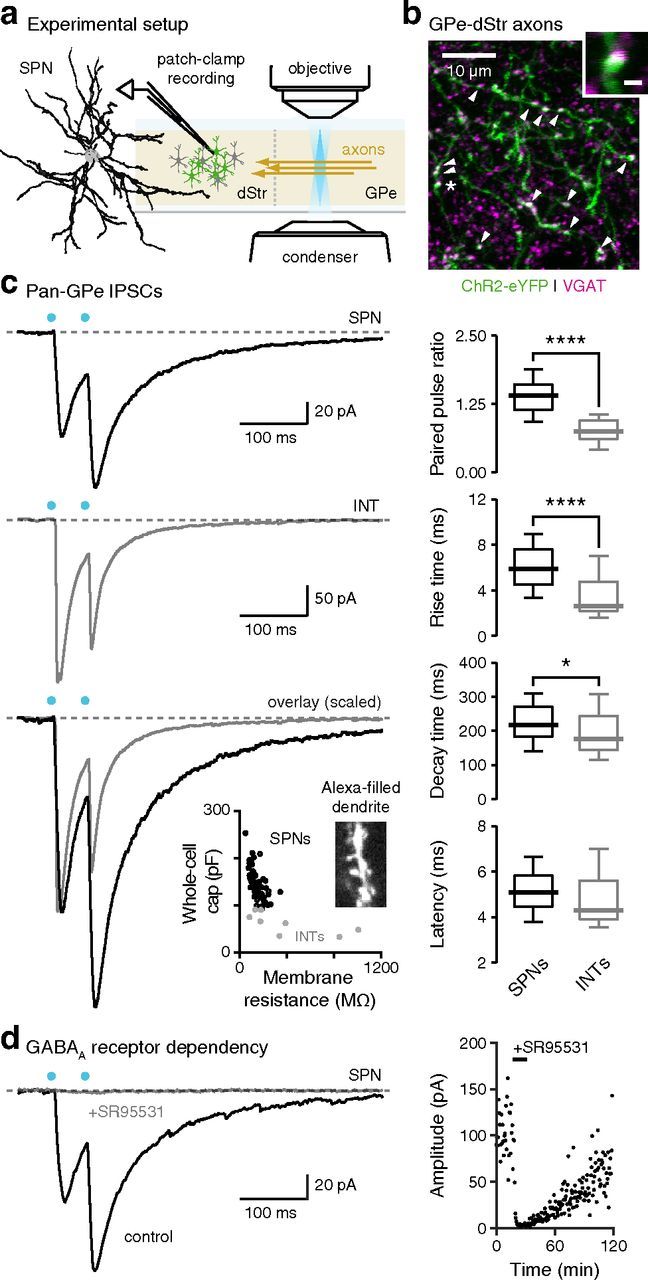
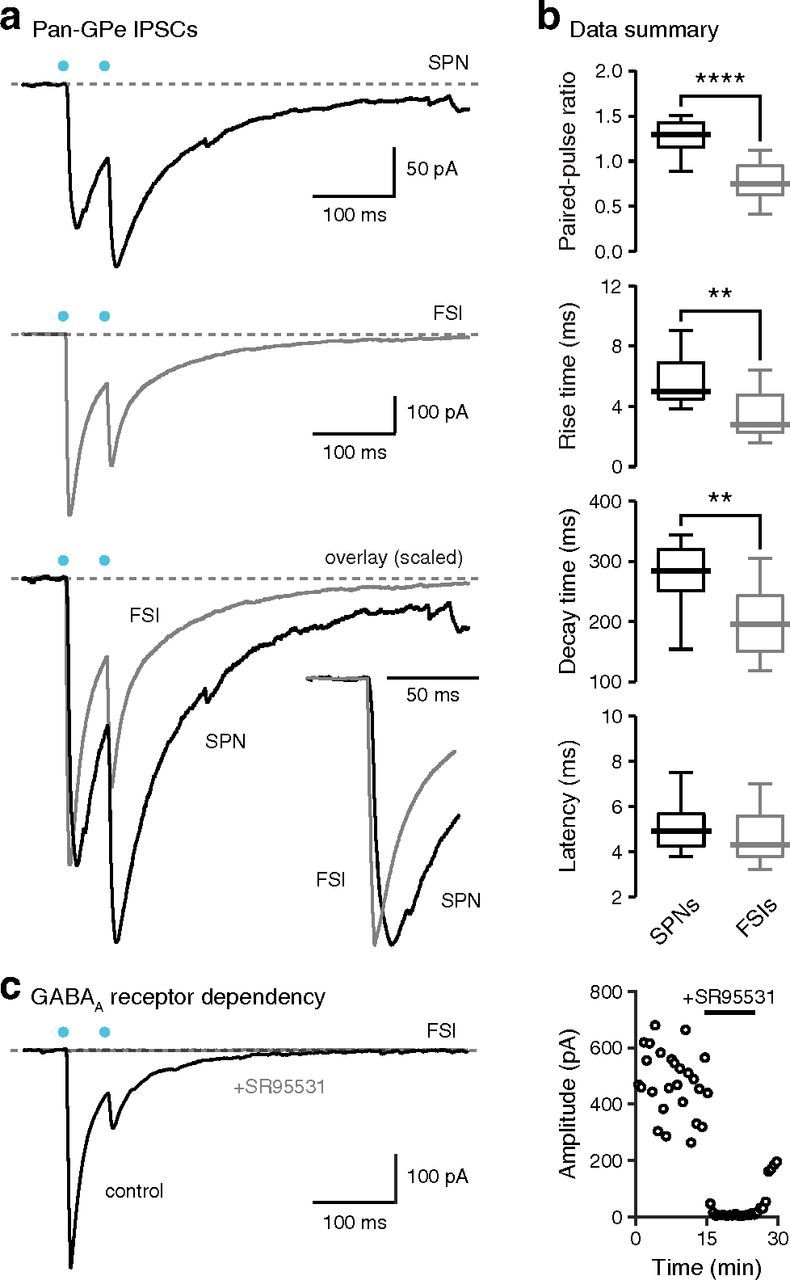
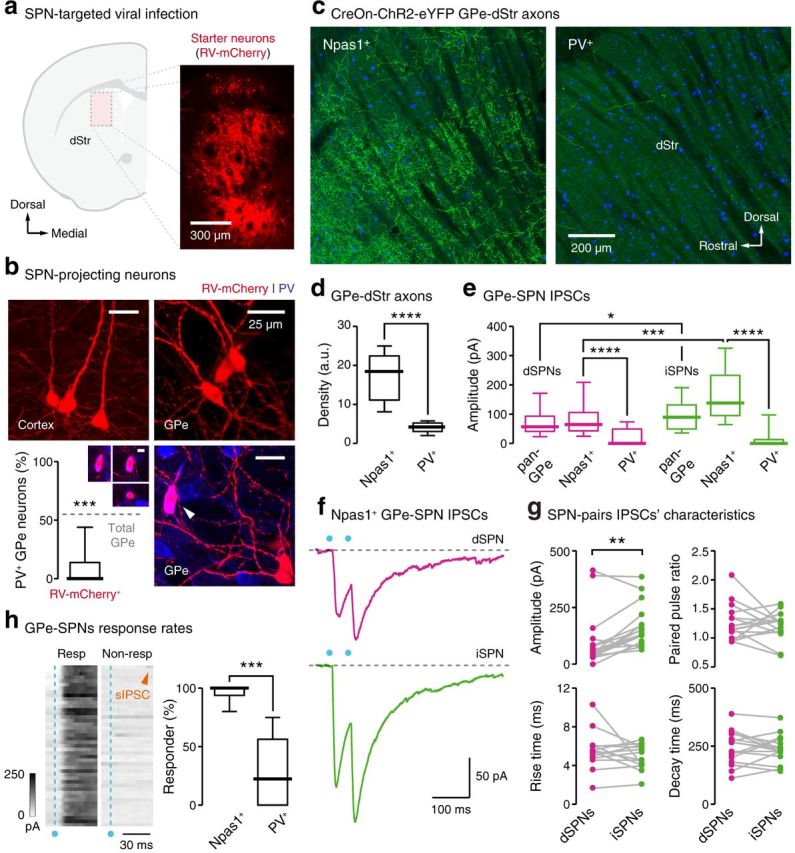
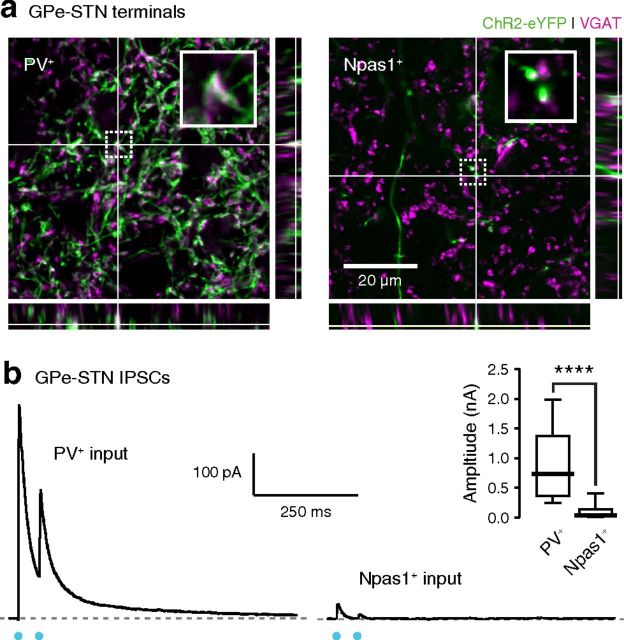
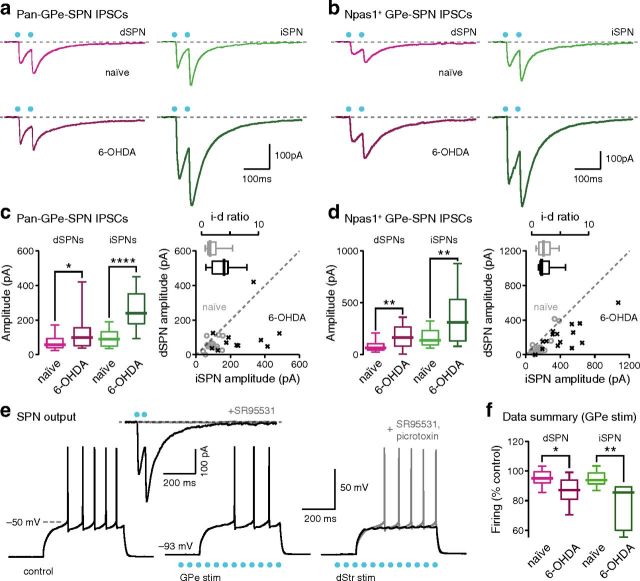
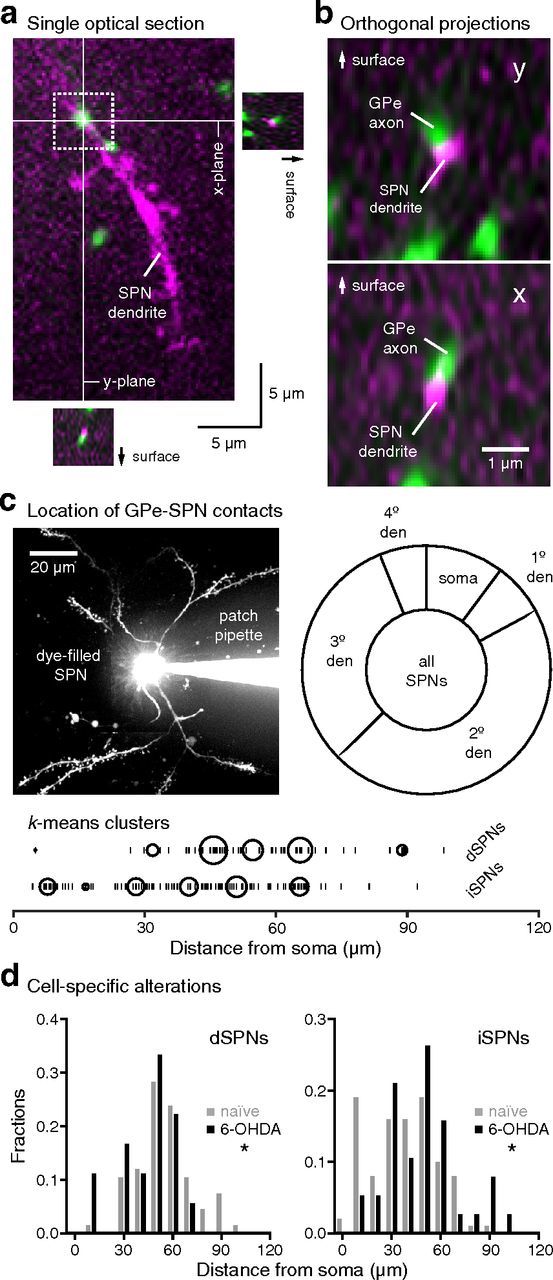
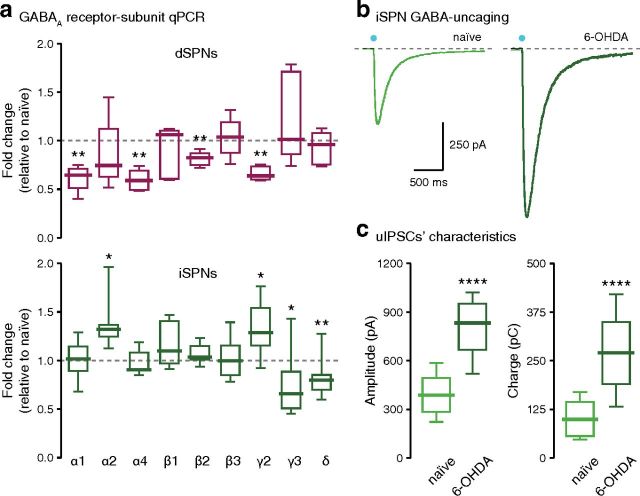
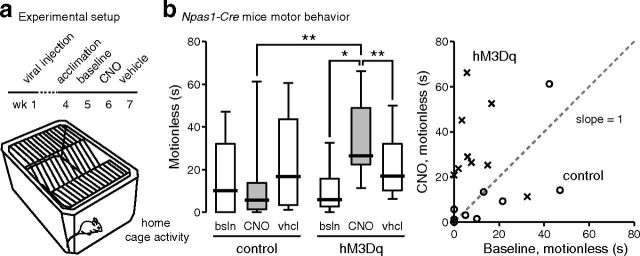
Compelling evidence demonstrates that the external globus pallidus (GPe) plays a key role in processing sensorimotor information. An anatomical projection from the GPe to the dorsal striatum has been described for decades. However, the cellular target and functional impact of this projection remain unknown. Using cell-specific transgenic mice, modern monosynaptic tracing techniques, and optogenetics-based mapping, we discovered that GPe neurons provide inhibitory inputs to direct and indirect pathway striatal projection neurons (SPNs). Our results indicate that the GPe input to SPNs arises primarily from Npas1-expressing neurons and is strengthened in a chronic Parkinson's disease (PD) model. Alterations of the GPe-SPN input in a PD model argue for the critical position of this connection in regulating basal ganglia motor output and PD symptomatology. Finally, chemogenetic activation of Npas1-expressing GPe neurons suppresses motor output, arguing that strengthening of the GPe-SPN connection is maladaptive and may underlie the hypokinetic symptoms in PD.

Significance statement: An anatomical projection from the pallidum to the striatum has been described for decades, but little is known about its connectivity pattern. The authors dissect the presynaptic and postsynaptic neurons involved in this projection, and show its cell-specific remodeling and strengthening in parkinsonian mice. Chemogenetic activation of Npas1(+) pallidal neurons that give rise to the principal pallidostriatal projection increases the time that the mice spend motionless. This argues that maladaptive strengthening of this connection underlies the paucity of volitional movements, which is a hallmark of Parkinson's disease.

Keywords: 6-OHDA; Npas1-Cre; arkypallidal neurons; extrinsic inhibition; pallidostriatal projection.


Figures

Figure 1.
Figure 1.
Pallidostriatal projection targets both spiny projection neurons and interneurons. a, SPNs were identified and patch clamped in ex vivo brain slices. An example of a reconstructed SPN is shown. Blue (peak 450 nm) excitation wavelength was delivered locally to the GPe through both the 60× objective and the condenser to trigger GABA release from pallidostriatal axons expressing the excitatory opsin ChR2. b, Following intrapallidal injection of a constitutive, pan-neuronal hSyn-ChR2-eYFP AAV, ChR2-eYFP-expressing axons (green) and boutons were observed in the dStr under laser-scanning confocal microscopy. The apposition of the vesicular GABA transporter (magenta) is shown as white. An example [marked with an asterisk (“*”)] is shown at a higher magnification in the inset. Scale bar, 1 μm. c, Left, Representative IPSC recordings from an SPN (top, black) and an INT (middle, gray) are shown. A paired-pulse (20 Hz) light stimulation (blue circle) was used to activate the pan-GPe input. Bottom, Traces from the two examples were overlaid and peak-scaled to illustrate the difference in the PPR and kinetics of the IPSCs observed in the two cell classes. Inset, Relationship between whole-cell capacitance and membrane resistance of both SPNs (black) and INTs (gray) is plotted. A photomicrograph is included to illustrate the identification of a typical SPN based on its unique dendritic morphology. Right, Summary data are presented as box plots. SPNs displayed a larger PPR (SPNs: 1.41 ± 0.23, n = 92 cells; INTs: 0.75 ± 0.16, n = 25 cells; p < 0.0001, Mann–Whitney U test), a longer rise time (SPNs: 5.9 ± 1.4 ms, n = 92 cells; INTs: 2.6 ± 1.0 ms, n = 25 cells; p < 0.0001, Mann–Whitney U test), and a longer decay time (SPNs: 217.0 ± 44.0 ms, n = 92 cells; INTs: 177.0 ± 41.6 ms, n = 25 cells; p = 0.0277, Mann–Whitney U test) relative to INTs. Latency was not different between SPNs and INTs (SPNs: 4.9 ± 0.6 ms, n = 12 cells; INTs: 4.3 ± 0.7 ms, n = 17 cells; p = 0.2677, Mann–Whitney U test). SPN subtypes were not differentiated. d, Left, Current records showing the effect of SR95531 on GPe-SPN IPSCs in a representative SPN. Right, A plot of the time course showing the sensitivity of GPe-SPN IPSCs to the application of SR95531 (horizontal bar). Medians ± median absolute deviations and two-tailed p values are listed. Medians, interquartile ranges, and 10–90th percentiles are also presented in a graphic format. Asterisks denote statistical significance level (*p < 0.05, ****p < 0.0001, Mann–Whitney U test and Wilcoxon signed rank test).
Figure 2.
Figure 2.
Pallidostriatal projection targets fast-spiking interneurons. a, Left, Representative IPSC recordings from an SPN (top, black) and an FSI (middle, gray) were shown. A paired-pulse (20 Hz) light stimulation (blue circle) was used to activate the pan-GPe input. Bottom, Traces from the two examples were overlaid and peak-scaled to illustrate the difference in the PPR and kinetics of the IPSCs observed in the two cell classes. Inset, A blown-up version of the first IPSCs. b, Summary data are presented as box plots. SPNs displayed a larger PPR (SPNs: 1.30 ± 0.12, n = 12 cells; FSIs: 0.75 ± 0.16, n = 17 cells; p < 0.0001, Mann–Whitney U test), a longer rise time (SPNs: 5.2 ± 0.7 ms, n = 12 cells; FSIs: 2.8 ± 1.1 ms, n = 17 cells; p = 0.0015, Mann–Whitney U test), and a longer decay time (SPNs: 284.0 ± 35.9 ms, n = 12 cells; FSIs: 195.7 ± 46.7 ms, n = 17 cells; p = 0.0051, Mann–Whitney U test) relative to FSIs. Latency was not different between SPNs and FSIs (SPNs: 4.9 ± 0.6 ms, n = 12 cells; FSIs: 4.3 ± 0.7 ms, n = 17 cells; p = 0.2677, Mann–Whitney U test). For this dataset, SPNs and FSIs were both from the PV reporter (PvalbCre;R26LSL-tdTomato) line; accordingly, SPN subtypes were not differentiated. Medians ± median absolute deviations and two-tailed p values are listed. c, Left, Current records showing the effect of SR95531 on GPe-FSI IPSCs in a representative FSI. Right, A plot of the time course showing the sensitivity of GPe-FSI IPSCs to the application of SR95531 (horizontal bar). Medians, interquartile ranges, and 10–90th percentiles are also presented in a graphic format. Asterisks denote statistical significance level (**p < 0.01, ****p < 0.0001, Mann–Whitney U test and Wilcoxon signed rank test).
Figure 3.
Figure 3.
Npas1+ GPe neurons constitute the primary pallidal input to the dStr. a, Left, a schematic diagram of a coronal mouse brain section illustrating the location of the virus injections for monosynaptic tracing. Drd1a-Cre and Drd2-Cre were used to target dSPNs and iSPNs, respectively. Right, A photomicrograph showing the center of infection and mCherry-expressing, rabies virus-infected (RV-mCherry+) SPNs. b, Top left, As a proof-of-concept, retrogradely labeled layer 5 cortical neurons are shown. Top right, Representative retrogradely labeled neurons (red) in the GPe. Bottom right, Immunohistochemistry for PV is shown in blue. An example of a PV+ retrogradely labeled neuron is shown (magenta, arrowhead). Orthogonal projections of this neuron are shown as an inset (bottom left). Scale bar, 10 μm. Two PV retrogradely labeled neurons (red) are clearly visible at the lower right corner of the field. Bottom left, A box plot summarizing the abundance of PV+ GPe neurons retrogradely labeled with RV-mCherry+. This is less than the total number of PV+ neurons in the GPe as a whole (RV-mCherry+: 0.0 ± 0.0%, n = 21 sections; total: 55.3 ± 6.2%, n = 15 sections; p < 0.0001, Mann–Whitney U test). Data from both Drd1a-Cre (4 of 75 cells, 5.3%) and Drd2-Cre (7 of 89 cells, 7.9%) are not different (p = 0.8630) and are thus pooled. c, Sagittal brain sections showing the density of ChR2-eYFP-labeled GPe axons in the rostrodorsal area of the dStr in an Npas1-Cre mouse (left) and a Pvalb-Cre mouse (right). Sections were also immunolabeled for HuCD (blue) to decipher the cytoarchitecture. Note, the top left dark area corresponds to the external capsule. A single confocal optical section is illustrated in both examples. Scale bar applies to both panels in c. d, Npas1+: 18.6 ± 5.7 a.u., n = 9 ROIs; PV+: 4.3 ± 1.2 a.u.; n = 9 ROIs, p < 0.0001, Mann–Whitney U test. e, Response amplitudes of the pan-, Npas1+, and PV+ GPe input to dSPNs (magenta) and iSPNs (green) are summarized in box plots. IPSC amplitude from the PV+ GPe input was smaller relative to the Npas1+ GPe input in both dSPNs (PV+ input: 0 ± 0 pA, n = 23 cells; Npas1+ input: 64.5 ± 21.6 pA, n = 27 cells; p < 0.0001, Mann–Whitney U test) and iSPNs (PV+ input: 0 ± 0 pA, n = 13 cells; Npas1+ input: 138.2 ± 50.9 pA, n = 29 cells; p < 0.0001, Mann–Whitney U test). IPSC amplitude was larger in iSPNs compared with dSPNs from both pan-GPe input (iSPNs: 89.5 ± 41.4 pA, n = 47 cells; dSPNs: 56.9 ± 19.1 pA, n = 35 cells; p = 0.0220, Mann–Whitney U test) and Npas1+ GPe input (dSPNs: 64.5 ± 21.6 pA, n = 27 cells; iSPNs: 138.2 ± 50.9 pA, n = 29 cells; p = 0.0002, Mann–Whitney U test). f, Representative recordings of Npas1+ GPe-dSPN (top, magenta) and GPe-iSPN IPSCs (bottom, green). g, Box plots summarizing the properties of Npas1+ GPe IPSCs in dSPN–iSPN pairs. iSPNs exhibited larger amplitude (top left; iSPNs, 134.1 ± 40.3 pA; dSPNs = 55.3 ± 23.5 pA; n = 17 pairs; p = 0.0017, Wilcoxon signed rank test) relative to dSPNs. However, there was no difference in PPR (top right; dSPNs, 1.18 ± 0.17; iSPNs, 1.26 ± 0.13; n = 16 pairs; p = 0.6322, Wilcoxon signed rank test), rise time (bottom left; dSPNs, 5.6 ± 0.7 ms; iSPNs, 5.6 ± 1.1 ms; n = 16 pairs; p = 0.2030, Wilcoxon signed rank test), or decay time (bottom right; dSPNs, 247.0 ± 50.1 ms; iSPNs, 234.1 ± 28.0 ms; n = 16 pairs; p = 0.5966, Wilcoxon signed rank test). h, Left, Grayscale representation of GPe-SPN IPSCs in a “responder” neuron. Each row represents a single trial. Blue circles and dotted lines indicate the timing of the optogenetic stimulation of the GPe. A “nonresponder” neuron (right) is included for comparison. A spontaneous IPSC is highlighted (orange arrow). Right, Response rate of SPNs to different GPe inputs (Npas1+ input: 100.0 ± 0%, n = 9 mice; PV+ input: 22.5 ± 22.5%, n = 6 mice; p = 0.0002). For simplicity, dSPNs (Npas1+ input, 27 cells; PV+ input, 22 cells) and iSPNs (Npas1+ input, 29 cells; PV+ input, 13 cells) are pooled. Medians ± median absolute deviations and two-tailed p values are listed. Medians, interquartile ranges, and 10–90th percentiles are also presented in a graphic format. Asterisks denote statistical significance level (*p < 0.05, **p < 0.01, ***p < 0.001, ****p < 0.0001, Mann–Whitney U test and Wilcoxon signed rank test).
Figure 4.
Figure 4.
PV+ GPe neurons constitute the primary pallidal input to the STN. a, High-magnification images showing the spatial relationship between vesicular GABA transporter terminals (magenta) with axons (green) from PV+ neurons (left) and Npas1+ neurons (right). Rectangular images showing orthogonal projections. Crosshairs indicate the projected planes. Insets show high-magnification views of areas within the squares (dotted line). Scale bar applies to both panels in a. b, Sample current traces showing the responsiveness of STN neurons to paired-pulse (20 Hz) optogenetic activation (blue) of PV+ GPe input (left) and Npas1+ GPe input (right; PV+ = 738.0 ± 409.0 pA, n = 18 cells; Npas1+ = 40.3 ± 19.1 pA, n = 16 cells; p < 0.0001, Mann–Whitney U test). Medians ± median absolute deviations and two-tailed p values are listed. Medians, interquartile ranges, and 10–90th percentiles are also presented in a graphic format. Asterisks denote statistical significance level (****p < 0.0001, Mann–Whitney U test).
Figure 5.
Figure 5.
GPe-SPN input is enhanced in a mouse model of Parkinson's disease. a, Representative pan-GPe-SPN IPSCs from naïve mice (magenta and green) and a chronic 6-OHDA lesioned mouse model of Parkinson's disease (maroon and dark green). b, Representative Npas1+ GPe-SPN IPSCs from naïve mice (magenta and green) and a chronic 6-OHDA lesioned mouse model of Parkinson's disease (maroon and dark green). c, Left, box plots summarizing the amplitude of pan-GPe-SPN population IPSCs from naïve mice (magenta and green) and chronic 6-OHDA lesioned mice (maroon and dark green). An increase in IPSC amplitude was observed in chronic 6-OHDA lesioned mice from both dSPNs (naïve: 56.9 ± 19.1 pA, n = 35 cells; 6-OHDA: 99.8 ± 47.2 pA, n = 19 cells; p = 0.0285, Mann–Whitney U test) and iSPNs (naïve: 89.5 ± 41.4 pA, n = 47 cells; 6-OHDA: 240.4 ± 98.8 pA, n = 36 cells; p < 0.0001, Mann–Whitney U test) compared with naïve mice. Right, dSPN–iSPN pairs from naïve (gray, n = 11 cells) and chronic 6-OHDA lesioned mice (black, n = 12 cells). Each symbol represents a dSPN–iSPN pair. Inset, The ratio of IPSC amplitude between dSPN–iSPN pairs in naïve mice (gray) and chronic 6-OHDA-lesioned mice (black) was calculated and denoted as “i-d ratio.” There was no difference in the i-d ratios of chronic 6-OHDA lesioned mice (black) and naïve mice (gray; p = 0.1007) d, Left, Box plots summarizing the amplitude of Npas1+ GPe-SPN population IPSCs from naïve mice (magenta and green) and chronic 6-OHDA lesioned mice (maroon and dark green). An increase in IPSC amplitude was observed in chronic 6-OHDA lesioned mice from both dSPNs (naïve: 64.5 ± 21.6 pA, n = 27 cells; 6-OHDA: 164.7 ± 91.0 pA, n = 20 cells; p = 0.0036, Mann–Whitney U test) and iSPNs (naïve: 138.2 ± 50.9 pA, n = 29 cells; 6-OHDA: 311.3 ± 194.2 pA, n = 29 cells; p = 0.0026, Mann–Whitney U test) compared with naïve mice. Right, Comparison of dSPN–iSPN pairs from naïve (gray, n = 16 cells) and chronic 6-OHDA lesioned mice (black, n = 14 cells). Each symbol represents a dSPN–iSPN pair. Inset, The i-d ratio is not different between naïve mice (gray) and 6-OHDA lesioned mice (black; p > 0.9999). e, Sample voltage traces of an iSPN from a chronic 6-OHDA lesioned mouse. Left, Excitability of SPNs was measured using a single current step that generated five action potentials in the control condition. Middle, GPe stimulation of pallidostriatal axons suppressed iSPN firing. Right, Terminal field stimulation (dStr stim) of pallidostriatal axons abolished iSPN firing (black). Right, This effect was reversed with the coapplication of SR95531 (10 μm) and picrotoxin (100 μm; gray). Inset, A representative Npas1+ GPe-iSPN IPSCs from a chronic 6-OHDA lesioned mouse showing the sensitivity of the GPe input to a GABAA receptor antagonist, SR95531. f, Box plots summarizing the impact of the pan-GPe input stimulation on SPN excitability in naïve and chronic 6-OHDA lesioned mice. 6-OHDA iSPNs exhibited a reduction in the relative firing rate compared with the effect seen in naïve iSPNs (naïve: 94.0 ± 3.1%, n = 10 cells; 6-OHDA: 85.5 ± 3.8%, n = 6 cells; p = 0.0017, Mann–Whitney U test). Similarly, 6-OHDA dSPNs also exhibited a reduction in the relative firing compared with the response in naïve dSPNs (naïve: 95.1 ± 3.6%, n = 10 cells, 6-OHDA: 87.1 ± 3.8%, n = 6 cells; p = 0.0415, Mann–Whitney U test). Medians ± median absolute deviations and two-tailed p values are listed. Medians, interquartile ranges, and 10–90th percentiles are also presented in a graphic format. Asterisks denote statistical significance level (*p < 0.05, **p < 0.01, ****p < 0.0001, Mann–Whitney U test and Wilcoxon signed rank test).
Figure 6.
Figure 6.
GPe input targets dendrites of dSPNs and iSPNs. a, Top left, A single optical section showing a representative contact formed between an eYFP+ GPe axon (green) and an SPN dendrite (magenta) in an ex vivo slice. Square images show orthogonal x-projection (bottom) and y-projection (right). Crosshairs indicate the projected planes. b, Enlarged and rotated view of the x-projections (bottom) and y-projections (top) of the GPe-SPN contact shown in a. c, Top left, A composite micrograph of the somatodendritic morphology of an Alexa Fluor-filled SPN in an ex vivo slice. The branch order of dendrites can be easily discerned. Top right, Graphic representation of the subcellular compartments of SPNs contacting with eYFP+ GPe axons in naïve mice (n = 174 contacts). The majority of the contacts occur on dendrites of both dSPNs (n = 67 contacts) and iSPNs (n = 107 contacts). Approximately 90% of all GPe-SPN contacts were formed on the secondary (dSPNs = 46.3%, n = 31 contacts; iSPNs = 43.9%, n = 47 contacts), tertiary (dSPNs: 38.8%, n = 26 contacts; iSPNs: 23.4%, n = 25 contacts), and quaternary (dSPNs: 7.5%, n = 5 contacts; iSPNs: 4.7%, n = 5 contacts) dendrites. Contacts on somatic regions (dSPNs: 1.5%, n = 1 contact; iSPNs: 18.7%, n = 20 contacts) and primary dendrites (dSPNs: 4.5%, n = 3 contacts; iSPNs: 9.3%, n = 10 contacts) of SPNs were scarce. The relative distribution of GPe-SPN contacts in different subcellular compartments differs between dSPNs and iSPNs (p = 0.0039, Fisher's exact test). Bottom, A graphic representation showing the distribution of GPe-SPN contacts in naïve mice. The size of the k-means cluster (circles) denotes the relative density of contacts (vertical lines). d, Histogram showing the Euclidean distances of GPe-SPN contacts as a function of eccentricity. A difference in GPe-dSPN contact location (left) between naïve (black) and chronic 6-OHDA lesioned (gray) mice is observed (naïve: 52.0 ± 10.4 μm, n = 67 contacts; 6-OHDA: 48.4 ± 9.2 μm, n = 18 contacts; p = 0.0363, Mann–Whitney U test). Similarly, a difference in GPe-iSPN contact location (right) between naïve (black) and chronic 6-OHDA lesioned (gray) mice is observed (naïve: 39.9 ± 15.0 μm, n = 107 contacts; 6-OHDA: 49.3 ± 14.7 μm, n = 38 contacts; p = 0.0367, Mann–Whitney U test). Medians ± median absolute deviations and two-tailed p values are listed (*p < 0.05, Mann–Whitney U test).
Figure 7.
Figure 7.
iSPNs have increased GABAA receptor surface expression following chronic 6-OHDA lesion. a, Transcript expression of different GABAA receptor subunits in dSPNs (top) and iSPNs (bottom) following chronic 6-OHDA lesion. Results are presented as fold differences relative to their respective naïve controls. Only data for α1 (Gabra1), α2 (Gabra2), α4 (Gabra1), β1 (Gabrb1), β2 (Gabrb2), β3 (Gabrb3), γ2 (Gabra2), γ3 (Gabra3), and δ (Gabrd) are included. No data for α3 (Gabra3), α5 (Gabra5), or γ1 (Gabra1) are presented as they have low or undetectable expression in SPNs. b, Representative GABA-uncaging responses (uIPSCs) in iSPNs from naïve (green, left) and chronic 6-OHDA lesioned (dark green, right) mice. c, Box plots summarizing the difference between naïve (green, left) and chronic 6-OHDA lesioned (dark green, right) mice in uIPSC amplitude (naïve: 387.8 ± 90.8 pA, n = 22 cells; 6-OHDA: 832.6 ± 110.1 pA, n = 10 cells; p < 0.0001, Mann–Whitney U test) and charge (naïve: 99.3 ± 42.9 pC, n = 22 cells; 6-OHDA: 270.8 ± 60.1 pC, n = 10 cells; p < 0.0001, Mann–Whitney U test). Medians ± median absolute deviations and two-tailed p values are listed. Medians, interquartile ranges, and 10–90th percentiles are also presented in a graphic format. Asterisks denote statistical significance level (*p < 0.05, **p < 0.01, ****p < 0.0001, Mann–Whitney U test and Wilcoxon signed rank test).
Figure 8.
Figure 8.
Activation of Npas1+ GPe neurons suppresses motor output. a, Experimental setup and timeline. Motor behavior assessed using an automated home cage scoring system. Subjects were repeatedly tested for 4 consecutive weeks at 1 week intervals. b, Left, Intraperitoneal injection of CNO (gray) did not alter the time spent motionless by control Npas1-Cre mice relative to baseline values (p = 0.6406, Wilcoxon signed rank test) or to vehicle values (p = 0.1641, Wilcoxon signed rank test; baseline: 10.2 ± 10.2 s; CNO: 5.7 ± 4.5 s; vehicle: 16.7 ± 14.1 s; n = 9 mice). The control group included two naïve Npas1-Cre mice and seven sham-injected Npas1-Cre mice. Intraperitoneal injection of CNO (gray) increased the length of time that the Npas1-Cre mice spent motionless with hM3Dq AAV infection in the GPe relative to baseline (baseline: 6.0 ± 4.1 s; CNO: 26.4 ± 5.6 s; n = 9 mice; p = 0.0273, Wilcoxon signed rank test). This effect of CNO was reversible (CNO: 26.4 ± 5.6 s; vehicle: 17.0 ± 4.5 s; n = 9 mice; p = 0.0039, Wilcoxon signed rank test) and was different from CNO in control Npas1-Cre mice (p = 0.0056, Mann–Whitney U test). Right, The effects of CNO on control mice (circles) and hM3Dq mice (crosses) are shown. Each symbol represents an individual mouse. Medians ± median absolute deviations and two-tailed p values are listed. Medians, interquartile ranges, and 10–90th percentiles are also presented in a graphic format. Asterisks denote statistical significance level (*p < 0.05, **p < 0.01, Mann–Whitney U test and Wilcoxon signed rank test).

Similar articles

Cited by

References

    1. Abdi A, Mallet N, Mohamed FY, Sharott A, Dodson PD, Nakamura KC, Suri S, Avery SV, Larvin JT, Garas FN, Garas SN, Vinciati F, Morin S, Bezard E, Baufreton J, Magill PJ. Prototypic and arkypallidal neurons in the dopamine-intact external globus pallidus. J Neurosci. 2015;35:6667–6688. doi: 10.1523/JNEUROSCI.4662-14.2015. - DOI - PMC - PubMed
    1. Abedi PM, Delaville C, De Deurwaerdère P, Benjelloun W, Benazzouz A. Intrapallidal administration of 6-hydroxydopamine mimics in large part the electrophysiological and behavioral consequences of major dopamine depletion in the rat. Neuroscience. 2013;236:289–297. doi: 10.1016/j.neuroscience.2013.01.043. - DOI - PubMed
    1. Albin RL, Young AB, Penney JB. The functional anatomy of basal ganglia disorders. Trends Neurosci. 1989;12:366–375. doi: 10.1016/0166-2236(89)90074-X. - DOI - PubMed
    1. Allen K, Monyer H. Interneuron control of hippocampal oscillations. Curr Opin Neurobiol. 2015;31:81–87. doi: 10.1016/j.conb.2014.08.016. - DOI - PubMed
    1. Anderson ME, Horak FB. Influence of the globus pallidus on arm movements in monkeys. III. Timing of movement-related information. J Neurophysiol. 1985;54:433–448. - PubMed

Publication types

MeSH terms

Substances

LinkOut - more resources