. 2016 Jul 11;90(15):6818-6831.
doi: 10.1128/JVI.00276-16. Print 2016 Aug 1.

CD8+ T Cell Breadth and Ex Vivo Virus Inhibition Capacity Distinguish between Viremic Controllers with and without Protective HLA Class I Alleles

Affiliations

CD8+ T Cell Breadth and Ex Vivo Virus Inhibition Capacity Distinguish between Viremic Controllers with and without Protective HLA Class I Alleles

Catherine K Koofhethile et al. J Virol. .

Abstract

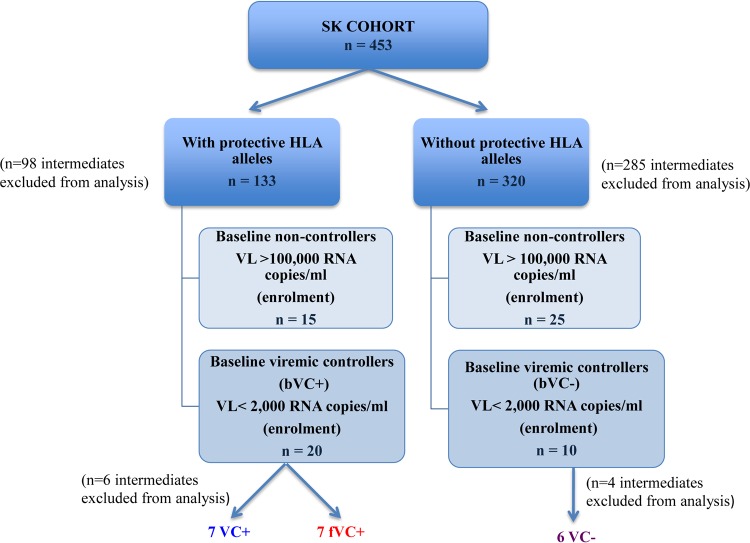
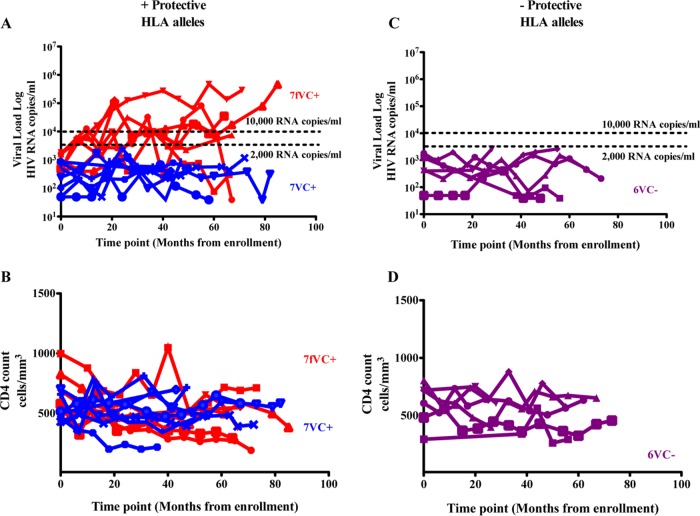
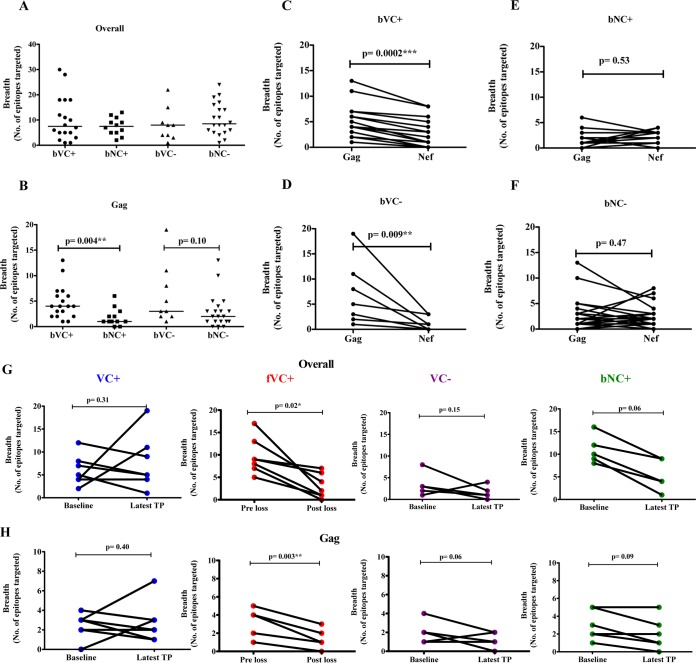
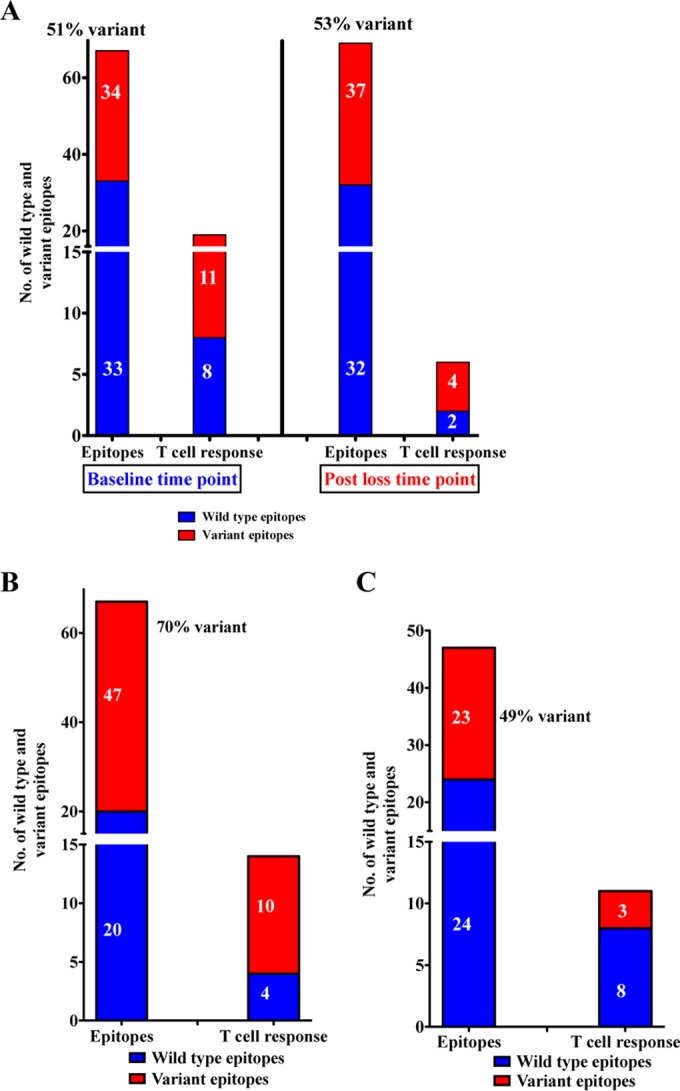
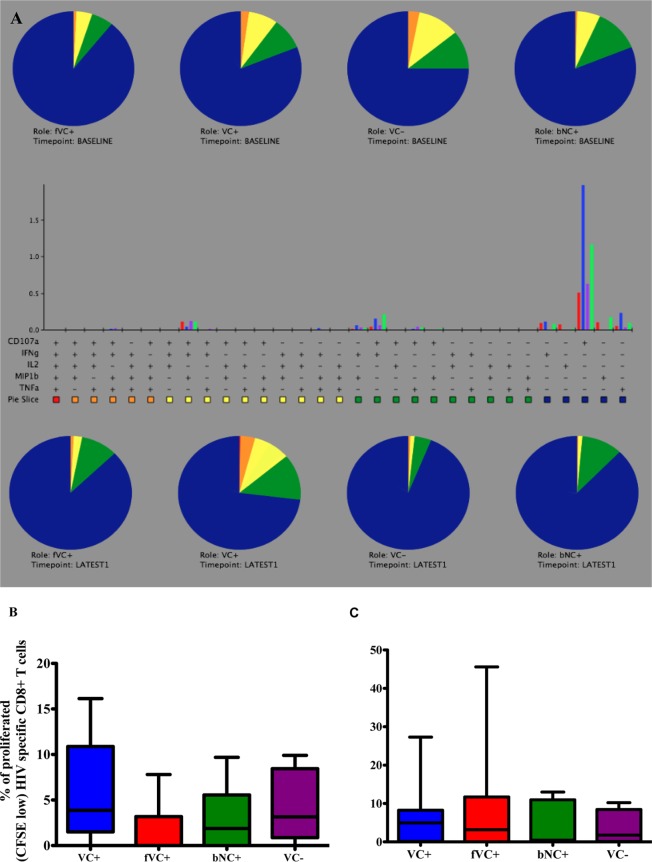
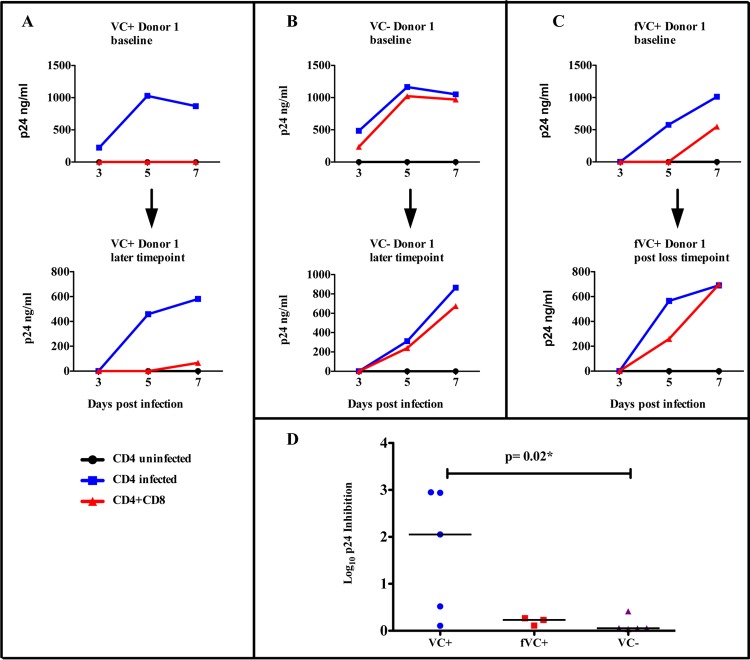
The mechanisms of viral control and loss of viral control in chronically infected individuals with or without protective HLA class I alleles are not fully understood. We therefore characterized longitudinally the immunological and virological features that may explain divergence in disease outcome in 70 HIV-1 C-clade-infected antiretroviral therapy (ART)-naive South African adults, 35 of whom possessed protective HLA class I alleles. We demonstrate that, over 5 years of longitudinal study, 35% of individuals with protective HLA class I alleles lost viral control compared to none of the individuals without protective HLA class I alleles (P = 0.06). Sustained HIV-1 control in patients with protective HLA class I alleles was characteristically related to the breadth of HIV-1 CD8(+) T cell responses against Gag and enhanced ability of CD8(+) T cells to suppress viral replication ex vivo In some cases, loss of virological control was associated with reduction in the total breadth of CD8(+) T cell responses in the absence of differences in HIV-1-specific CD8(+) T cell polyfunctionality or proliferation. In contrast, viremic controllers without protective HLA class I alleles possessed reduced breadth of HIV-1-specific CD8(+) T cell responses characterized by reduced ability to suppress viral replication ex vivo These data suggest that the control of HIV-1 in individuals with protective HLA class I alleles may be driven by broad CD8(+) T cell responses with potent viral inhibitory capacity while control among individuals without protective HLA class I alleles may be more durable and mediated by CD8(+) T cell-independent mechanisms.

Importance: Host mechanisms of natural HIV-1 control are not fully understood. In a longitudinal study of antiretroviral therapy (ART)-naive individuals, we show that those with protective HLA class I alleles subsequently experienced virologic failure compared to those without protective alleles. Among individuals with protective HLA class I alleles, viremic control was associated with broad CD8(+) T cells that targeted the Gag protein, and CD8(+) T cells from these individuals exhibited superior virus inhibition capacity. In individuals without protective HLA class I alleles, HIV-1-specific CD8(+) T cell responses were narrow and poorly inhibited virus replication. These results suggest that broad, highly functional cytotoxic T cells (cytotoxic T lymphocytes [CTLs]) against the HIV-1 Gag protein are associated with control among those with protective HLA class I alleles and that loss of these responses eventually leads to viremia. A subset of individuals appears to have alternative, non-CTL mechanisms of viral control. These controllers may hold the key to an effective HIV vaccine.


Figures

FIG 1
FIG 1
Groups and subgroups of study participants. The 70 HIV-1 subtype C-chronically infected participants were from the Sinikithemba (SK) cohort in Durban, South Africa. Viremic controllers (VC+/−) were enrolled with a VL of below 2,000 HIV RNA copies/ml and maintained this low VL for the entire enrollment duration. Failing VCs (fVCs) were enrolled with a VL of below 2,000 HIV RNA copies/ml, and the VL increased to more than 10,000 HIV RNA copies/ml at a minimum of 2 subsequent time points.
FIG 2
FIG 2
Gating strategy for polyfunctionality (A) and proliferative capacity (B) of CD8+ T cells upon stimulation with Gag peptide pools. For polyfunctionality of CD8+ T cells (A), the initial gating was on lymphocytes followed by the forward scatter height (FCS-H) versus forward scatter area (FSC-A) to eliminate the doublets. We then gated on the live CD3+ T cell population followed by gating of CD8+ and CD4+ T cell populations, followed by the gating for individual respective functions (set based on the negative control); these were used to identify positive responses. For the proliferation of CD8+ T cells (B), the initial gating was on lymphocytes followed by gating on the live CD3+ T cell population and then on CD8+ and CD4+ T cell populations. The next gates were set on the CFSE-negative CD8+ population to identify proliferated CD8+ T cell populations. The individual gating for proliferating cells was set based on the negative control (no stimulation); these were used to identify positive responses by subtraction from stimulated proliferating population. SSC, side scatter; FITC, fluorescein isothiocyanate.
FIG 3
FIG 3
Longitudinal viral load (A and C) and absolute CD4 T cell count (B and D) patterns among baseline viremic controllers with and without protective HLA alleles. fVC+, failing viremic controllers with protective HLA alleles (enrolled with a viral load of <2,000 HIV RNA copies/ml and later lost control, n = 7; loss of control is defined by an increase in viral load to >10,000 HIV RNA copies/ml at 2 or more time points during follow-up); VC+/−, viremic controllers with or without protective HLA alleles (maintained viral load of <2,000 HIV RNA copies/ml for the entire course of follow-up).
FIG 4
FIG 4
Baseline (A to F) and longitudinal (G and H) ELISpot screening of HIV-specific T cell responses. Overall breadth to the entire HIV proteome (A) and breadth of Gag-specific immune responses (B) among individuals with or without protective HLA alleles (bVC+/ and bNC+/−). An ELISpot matrix assay followed by confirmation with overlapping peptides spanning the entire HIV-1 clade C proteome was used on thawed PBMCs. The breadth of Gag versus Nef was assessed among the study groups: bVC+ (baseline viremic controllers with protective HLA alleles, n = 18) (C), bNC+ (baseline noncontrollers with protective HLA alleles, n = 12) (E), bVC (baseline VC without protective HLA alleles, n = 9) (D), and bNC (baseline noncontrollers without protective HLA alleles, n = 20) (F). (G and H) Longitudinal ELISpot screening of HIV-specific T cell responses. (G) Overall breadth across entire HIV proteome. (H) Breadth of Gag among viremic controllers (VC+, n = 7), failing viremic controllers (fVC+, n = 7), and baseline noncontrollers (bNC+, n = 6) with protective HLA alleles and viremic controllers (VC, n = 5) without protective HLA alleles. PBMCs were stimulated with optimal peptides restricted only to individuals with HLA-B alleles and spanning the whole HIV proteome. TP, time point.
FIG 5
FIG 5
Immunogenicity and viral escape in fVC+ subjects before and after loss of viral control (A) and in VC+ (B) and VC (C) subjects at baseline. We evaluated if the epitopes within the Gag region had variant sequences either within the epitope or within the 5 flanking amino acids. HIV-1 clade C Gag consensus sequence was used as reference for comparison in this analysis. We assessed mutations within epitopes restricted by the patients' protective HLA class I alleles plus epitopes restricted by the other HLA-B alleles that the subjects possessed. The percentage of variant sequences was calculated by counting the number of epitopes with sequence changes divided by the cumulative number of epitopes restricted by each patient's HLA types that were tested multiplied by 100 [(number of variant sequences/cumulative number of epitopes tested) × 100].
FIG 6
FIG 6
Polyfunctionality (A) and proliferative capacity (B and C) of CD8+ T cells upon stimulation with Gag peptide pools—among viremic controllers (VC+), failing viremic controllers (fVC+), baseline noncontrollers (bNC+) with protective HLA alleles, and viremic controllers without protective HLA alleles (VC), at baseline and at later time points. The 5 functions studied were CD107a, IFN-γ, IL-2, MIP-1β, and TNF-α. On the pie charts (A), red represents 5 functions, orange represents 4 functions, yellow represents 3 functions, green represents 2 functions, and blue represents 1 function. The gating strategy is shown in Fig. 2A. Boolean gating was performed in order to allow creation of a full array of possible combinations of up to 32 response patterns. Positive responses were reported after background correction, and the percentage of epitope-specific CD8+ T cell responses had to be at least two times higher than background for each tested marker. PESTLE (version 1.6.2) and SPICE 5.0 (Mario Roederer, ImmunoTechnology Section, Vaccine Research Center, NIH, Bethesda, MD) were used to analyze the multifunctional data. The same subjects were assessed for the proliferation of CD8+ T cells at baseline (B) and latest time point (C). The gating strategy is shown in Fig. 2B. GraphPad Prism version 5.0a software (GraphPad Software, San Diego, CA, USA) was used to analyze group data sets.
FIG 7
FIG 7
Ex vivo viral inhibition of NL4-3-infected CD4+ T cells by autologous CD8+ T cells. Infected CD4+ T cells were cultured ex vivo with CD8+ T cells at a ratio of 1:1. Blue lines represent infected CD4+ T cells alone, black lines represent the negative control (uninfected CD4+ T cells), and the red lines represent ex vivo coculture of infected CD4+ T cells with autologous CD8+ T cells. (A) Representative data for 1 VC+ at baseline and later time point. (B) One VC at baseline and later time point. (C) Representative data for 1 fVC+ at baseline and later time point. (D) Log10 p24 inhibition of individual subjects was calculated by subtracting log10 p24 values with CD8+ T cells from log10 p24 values without CD8+ T cells at day 7; here, we compared 5 VC+ with 3 fVC+ and 5 VC individuals.

References

    1. UNAIDS. 2013. Global report: UNAIDS report on the global AIDS epidemic 2013. UNAIDS, Geneva, Switzerland.
    1. Schmitz JE, Kuroda MJ, Santra S, Sasseville VG, Simon MA, Lifton MA, Racz P, Tenner-Racz K, Dalesandro M, Scallon BJ, Ghrayeb J, Forman MA, Montefiori DC, Rieber EP, Letvin NL, Reimann KA. 1999. Control of viremia in simian immunodeficiency virus infection by CD8+ lymphocytes. Science 283:857–860. doi:10.1126/science.283.5403.857. - DOI - PubMed
    1. Kiepiela P, Leslie AJ, Honeyborne I, Ramduth D, Thobakgale C, Chetty S, Rathnavalu P, Moore C, Pfafferott KJ, Hilton L, Zimbwa P, Moore S, Allen T, Brander C, Addo MM, Altfeld M, James I, Mallal S, Bunce M, Barber LD, Szinger J, Day C, Klenerman P, Mullins J, Korber B, Coovadia HM, Walker BD, Goulder PJR. 2004. Dominant influence of HLA-B in mediating the potential co-evolution of HIV and HLA. Nature 432:769–775. doi:10.1038/nature03113. - DOI - PubMed
    1. Kiepiela P, Ngumbela K, Thobakgale C, Ramduth D, Honeyborne I, Moodley E, Reddy S, de Pierres C, Mncube Z, Mkhwanazi N, Bishop K, van der Stok M, Nair K, Khan N, Crawford H, Payne R, Leslie A, Prado J, Prendergast A, Frater J, McCarthy N, Brander C, Learn GH, Nickle D, Rousseau C, Coovadia H, Mullins JI, Heckerman D, Walker BD, Goulder P. 2007. CD8+ T-cell responses to different HIV proteins have discordant associations with viral load. Nat Med 13:46–53. doi:10.1038/nm1520. - DOI - PubMed
    1. Migueles SA, Connors M. 2010. Long-term nonprogressive disease among untreated HIV-infected individuals: clinical implications of understanding immune control of HIV. JAMA 304:194–201. doi:10.1001/jama.2010.925. - DOI - PubMed

Publication types

MeSH terms

Substances

LinkOut - more resources