

Using Genotyping by Sequencing to Map Two Novel Anthracnose Resistance Loci in Sorghum bicolor
- PMID: 27194807
- PMCID: PMC4938647
- DOI: 10.1534/g3.116.030510
Using Genotyping by Sequencing to Map Two Novel Anthracnose Resistance Loci in Sorghum bicolor
Abstract
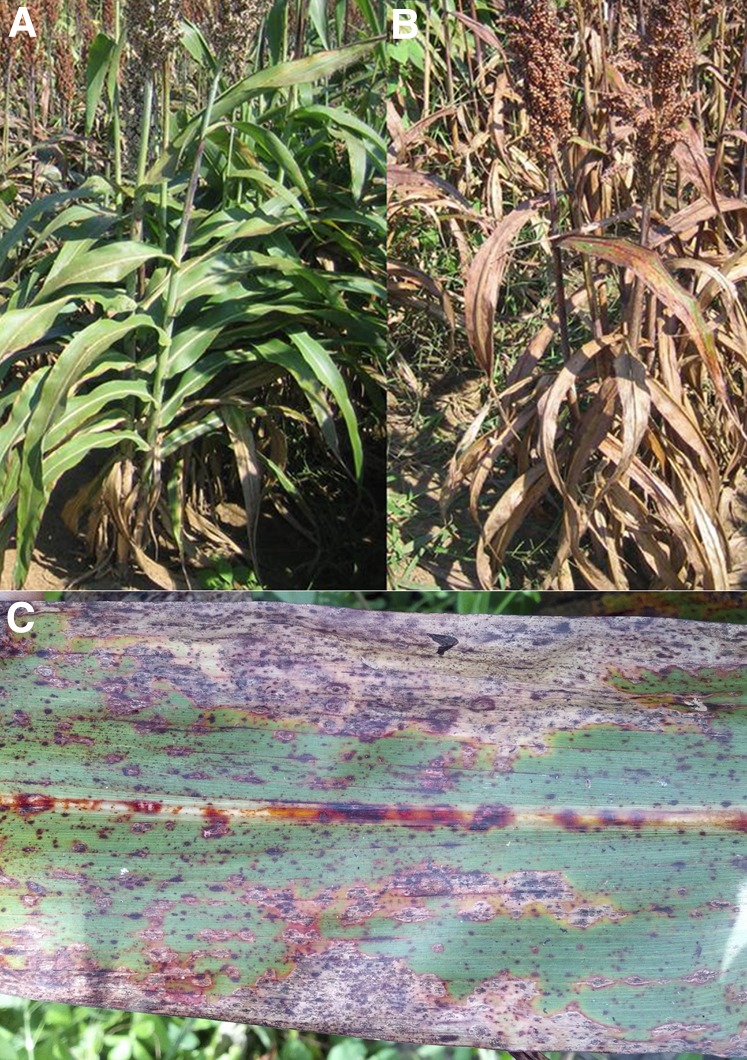
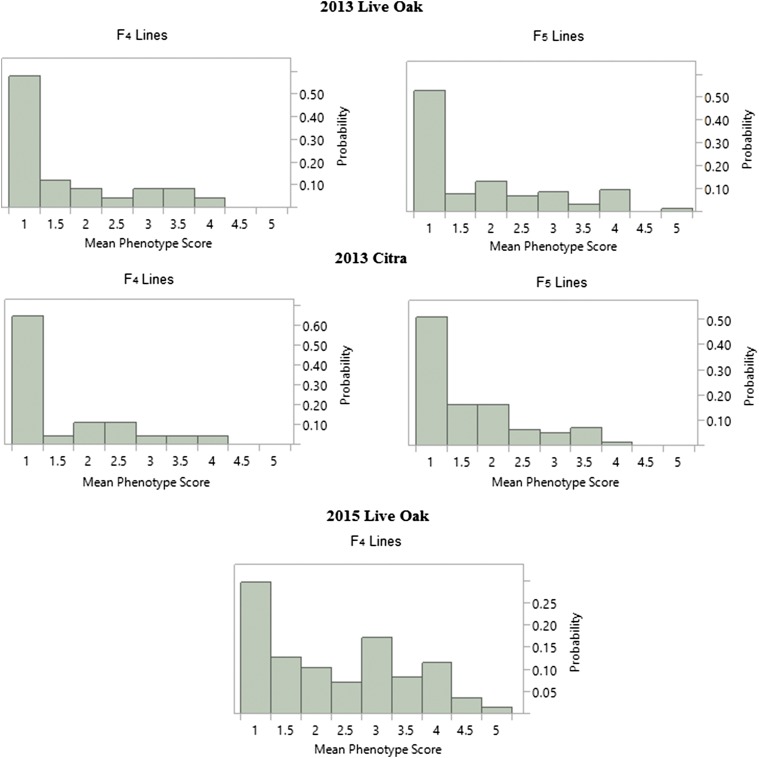
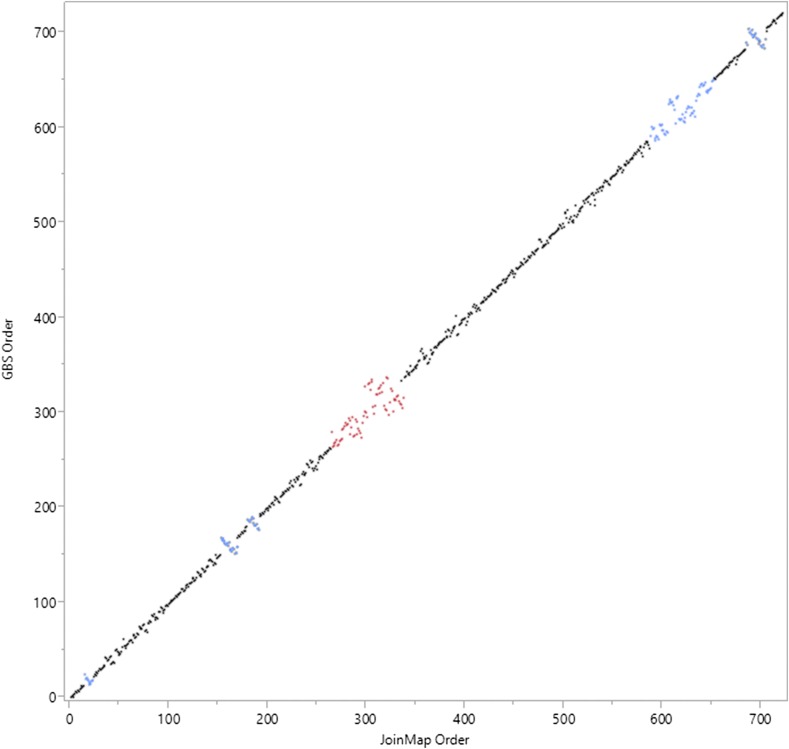
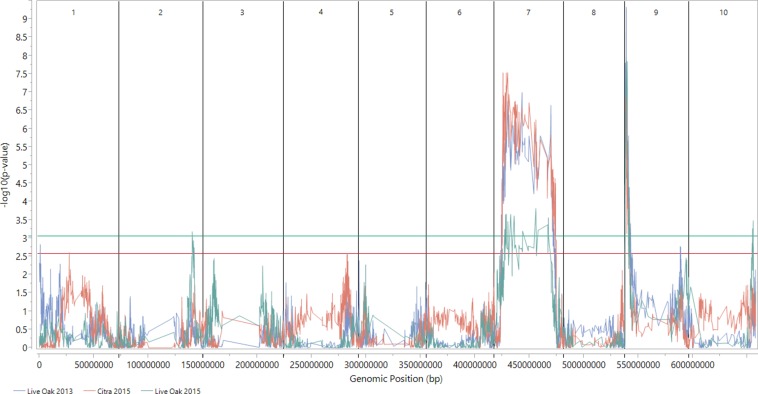
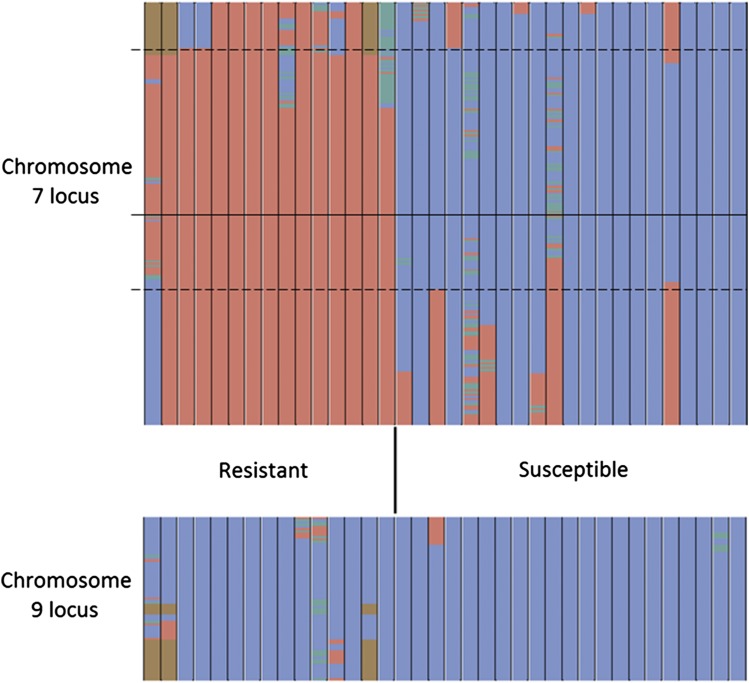
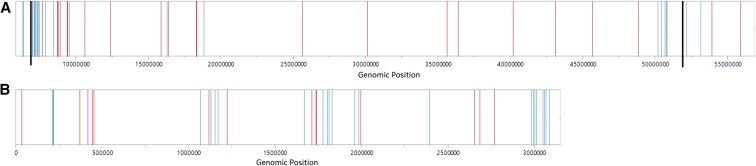
Colletotrichum sublineola is an aggressive fungal pathogen that causes anthracnose in sorghum [Sorghum bicolor (L.) Moench]. The obvious symptoms of anthracnose are leaf blight and stem rot. Sorghum, the fifth most widely grown cereal crop in the world, can be highly susceptible to the disease, most notably in hot and humid environments. In the southeastern United States the acreage of sorghum has been increasing steadily in recent years, spurred by growing interest in producing biofuels, bio-based products, and animal feed. Resistance to anthracnose is, therefore, of paramount importance for successful sorghum production in this region. To identify anthracnose resistance loci present in the highly resistant cultivar 'Bk7', a biparental mapping population of F3:4 and F4:5 sorghum lines was generated by crossing 'Bk7' with the susceptible inbred 'Early Hegari-Sart'. Lines were phenotyped in three environments and in two different years following natural infection. The population was genotyped by sequencing. Following a stringent custom filtering protocol, totals of 5186 and 2759 informative SNP markers were identified in the two populations. Segregation data and association analysis identified resistance loci on chromosomes 7 and 9, with the resistance alleles derived from 'Bk7'. Both loci contain multiple classes of defense-related genes based on sequence similarity and gene ontologies. Genetic analysis following an independent selection experiment of lines derived from a cross between 'Bk7' and sweet sorghum 'Mer81-4' narrowed the resistance locus on chromosome 9 substantially, validating this QTL. As observed in other species, sorghum appears to have regions of clustered resistance genes. Further characterization of these regions will facilitate the development of novel germplasm with resistance to anthracnose and other diseases.
Keywords: Colletotrichum sublineola; GBS; anthracnose; sorghum.
Copyright © 2016 Felderhoff et al.
Figures
Similar articles
-
Genome-Wide Association Mapping of Anthracnose (Colletotrichum sublineolum) Resistance in NPGS Ethiopian Sorghum Germplasm.G3 (Bethesda). 2019 Sep 4;9(9):2879-2885. doi: 10.1534/g3.119.400350. G3 (Bethesda). 2019. PMID: 31289022 Free PMC article.
-
Exploring the genetic basis of anthracnose resistance in Ethiopian sorghum through a genome-wide association study.BMC Genomics. 2024 Jul 8;25(1):677. doi: 10.1186/s12864-024-10545-2. BMC Genomics. 2024. PMID: 38977981 Free PMC article.
-
Genome-Wide Association Mapping of Anthracnose (Colletotrichum sublineolum) Resistance in the U.S. Sorghum Association Panel.Plant Genome. 2018 Jul;11(2). doi: 10.3835/plantgenome2017.11.0099. Plant Genome. 2018. PMID: 30025025
-
Elucidating Anthracnose Resistance Mechanisms in Sorghum-A Review.Phytopathology. 2020 Dec;110(12):1863-1876. doi: 10.1094/PHYTO-04-20-0132-RVW. Epub 2020 Nov 4. Phytopathology. 2020. PMID: 33100146 Review.
-
Understanding the Sorghum-Colletotrichum sublineola Interactions for Enhanced Host Resistance.Front Plant Sci. 2021 Apr 20;12:641969. doi: 10.3389/fpls.2021.641969. eCollection 2021. Front Plant Sci. 2021. PMID: 33959139 Free PMC article. Review.
Cited by
-
Genome-Wide Association Mapping of Anthracnose (Colletotrichum sublineolum) Resistance in NPGS Ethiopian Sorghum Germplasm.G3 (Bethesda). 2019 Sep 4;9(9):2879-2885. doi: 10.1534/g3.119.400350. G3 (Bethesda). 2019. PMID: 31289022 Free PMC article.
-
An evolutionarily conserved non-synonymous SNP in a leucine-rich repeat domain determines anthracnose resistance in watermelon.Theor Appl Genet. 2019 Feb;132(2):473-488. doi: 10.1007/s00122-018-3235-y. Epub 2018 Nov 16. Theor Appl Genet. 2019. PMID: 30446794
-
Quantitative trait loci from identification to exploitation for crop improvement.Plant Cell Rep. 2017 Aug;36(8):1187-1213. doi: 10.1007/s00299-017-2127-y. Epub 2017 Mar 28. Plant Cell Rep. 2017. PMID: 28352970 Review.
-
Response and disease resistance evaluation of sorghum seedlings under anthracnose stress.Sci Rep. 2024 Sep 20;14(1):21978. doi: 10.1038/s41598-024-70088-0. Sci Rep. 2024. PMID: 39304668 Free PMC article.
-
Evaluation of genetic diversity, agronomic traits, and anthracnose resistance in the NPGS Sudan Sorghum Core collection.BMC Genomics. 2020 Jan 28;21(1):88. doi: 10.1186/s12864-020-6489-0. BMC Genomics. 2020. PMID: 31992189 Free PMC article.
References
-
- Ali M., Warren H., 1987. Physiological races of Colletotrichum graminicola on sorghum. Plant Dis. 71: 402–404.
-
- Almagro L., Ros L. G., Belchi-Navarro S., Bru R., Barceló A. R., et al. , 2009. Class III peroxidases in plant defence reactions. J. Exp. Bot. 60: 377–390. - PubMed
-
- Ashok M., Siradhana B. S., Mishra A., 1992. Effect of host age on sorghum anthracnose. Gujarat Agric. Univ. Res. J. 18: 135–136.
Publication types
MeSH terms
LinkOut - more resources
Full Text Sources
Other Literature Sources
Research Materials
Miscellaneous