

A Novel Protein Elicitor (PeBA1) from Bacillus amyloliquefaciens NC6 Induces Systemic Resistance in Tobacco
- PMID: 27194952
- PMCID: PMC4870718
- DOI: 10.7150/ijbs.14333
A Novel Protein Elicitor (PeBA1) from Bacillus amyloliquefaciens NC6 Induces Systemic Resistance in Tobacco
Abstract
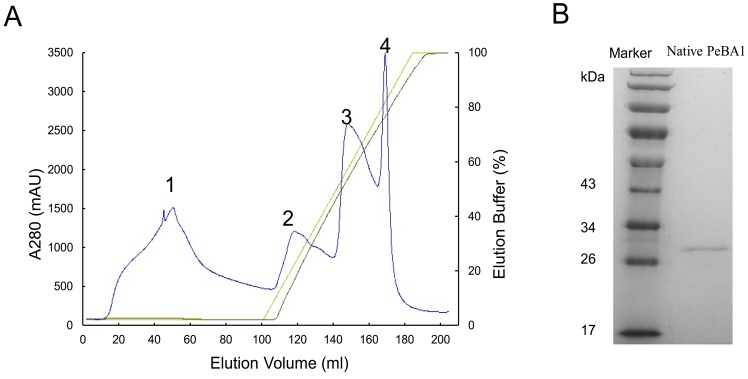
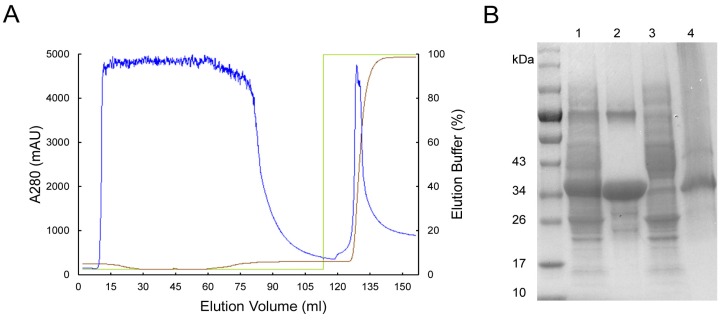
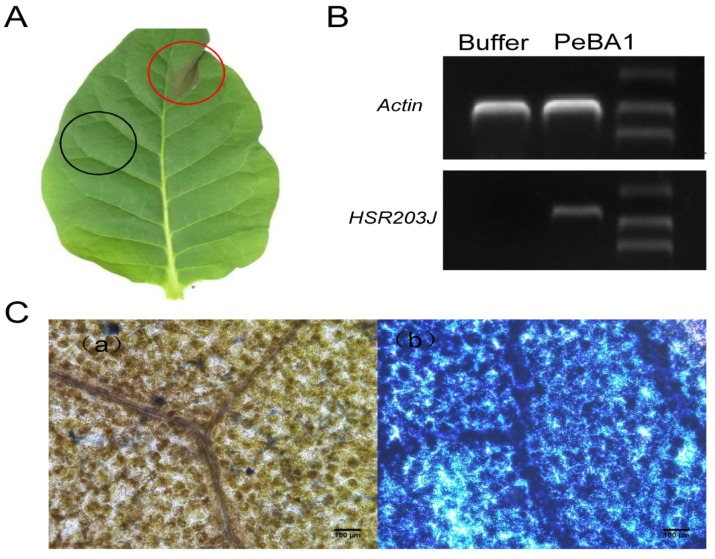
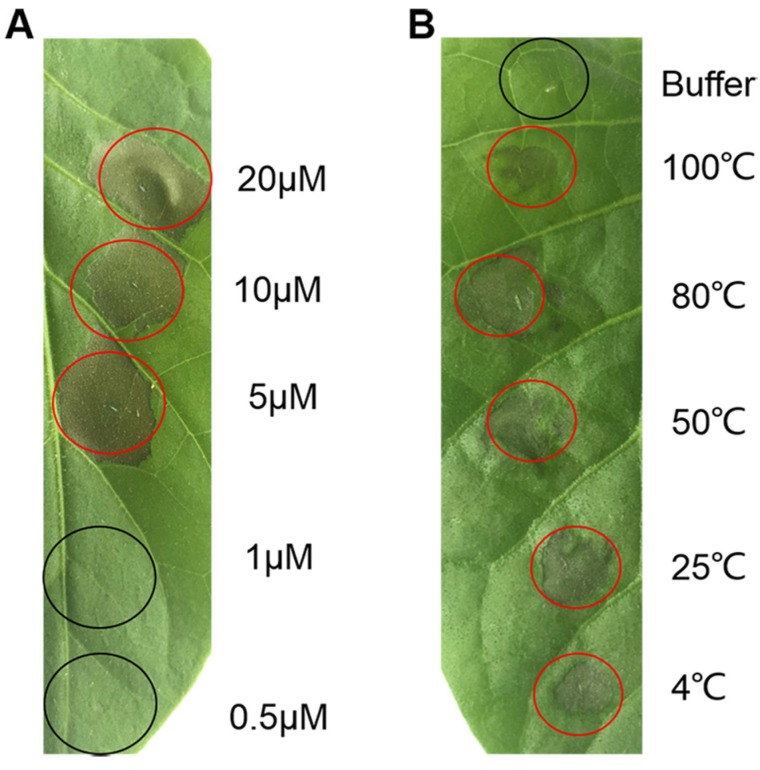
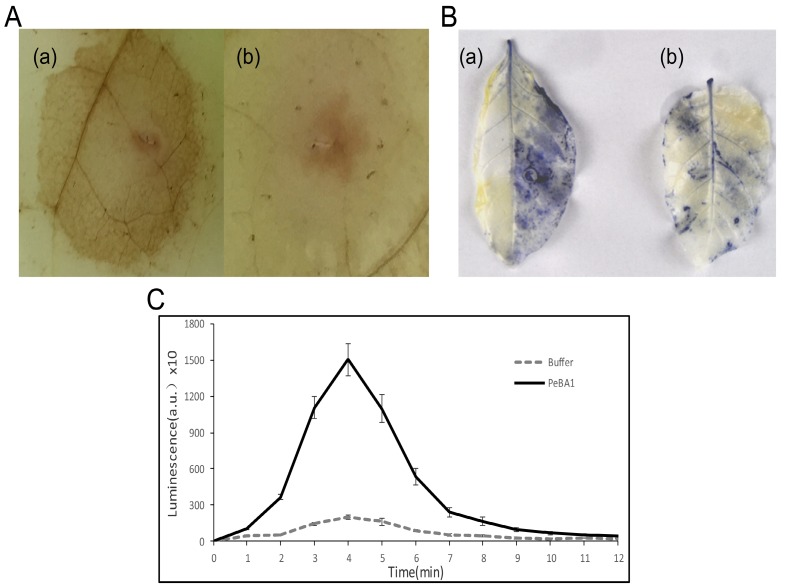
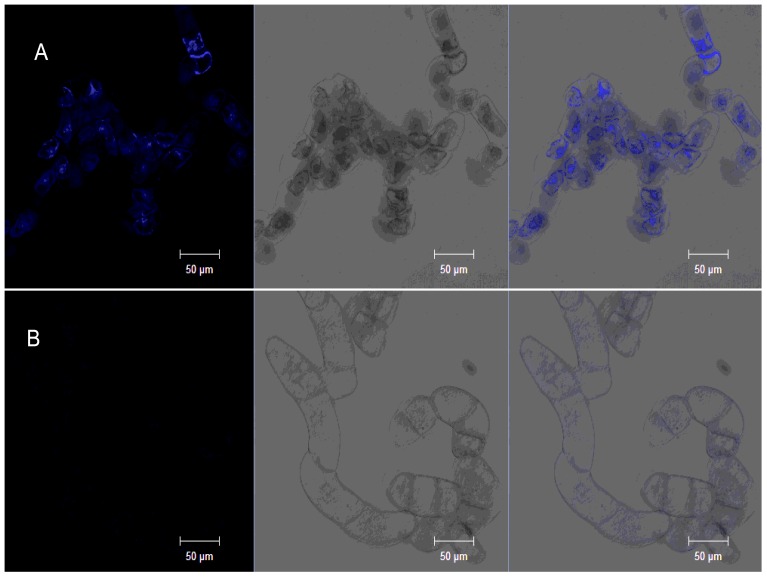
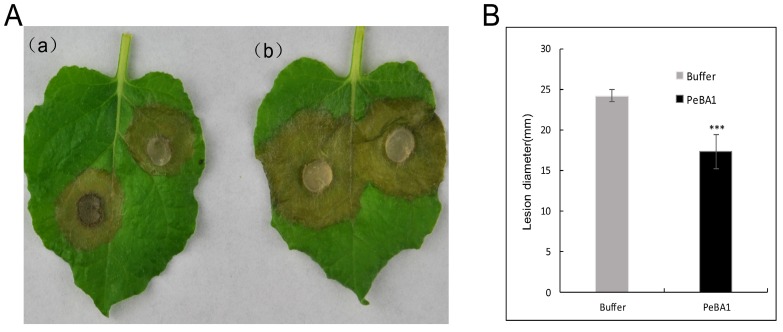
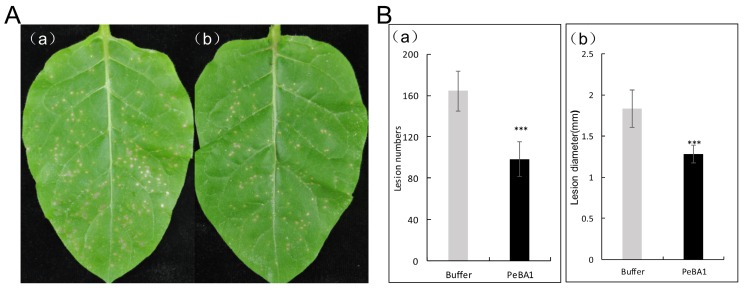
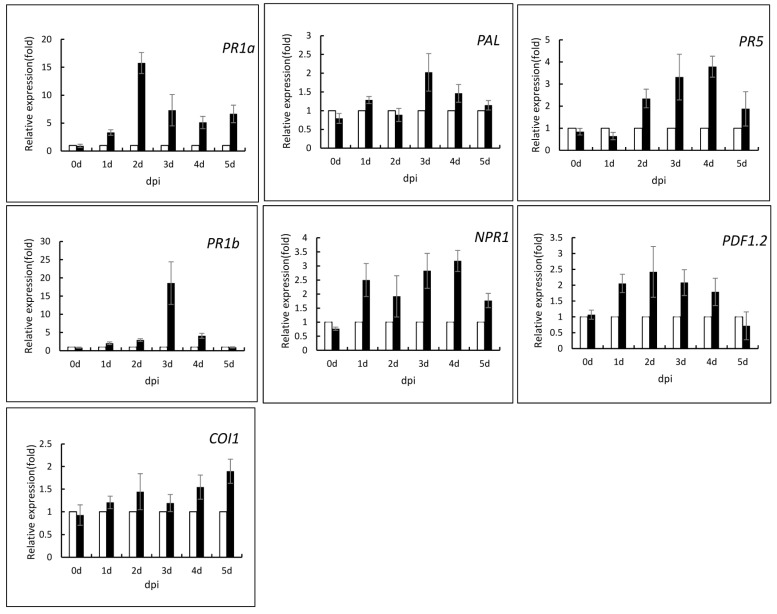
Here we reported a novel protein elicitor from Bacillus amyloliquefaciens NC6 induced systemic resistance (ISR) in tobacco. The purification was executed by ion-exchange chromatography, native-page extraction and HPLC, and the amino acid sequence was identified by mass spectrometry. This recombinant elicitor protein, expressed in Escherichia coli by an E1 expression vector, had good thermal stability, and the elicitor caused a clearly defined hypersensitive response (HR) necrosis in tobacco leaves. It could also trigger early defence events, including generation of reactive oxygen species (H2O2 and O2 (-)) and phenolic-compound accumulation. Quantitative real-time PCR (Q-RT-PCR) results indicated that several plant defence genes, including the salicylic acid (SA)-responsive PR1a, PR1b, PR5, and phenylalanine ammonia lyase (PAL), as well as the jasmonic acid (JA)-responsive PDF1.2 and CORONATINE INSENSITIVE 1 (COI1), were all up-regulated. Moreover, infiltration conferred systemic resistance against a broad spectrum of pathogens, including Tobacco mosaic virus (TMV) and the fungal pathogen Botrytis cinerea.
Keywords: Hypersensitive response; ROS; induced systemic resistance; protein elicitor.
Conflict of interest statement
Competing Interests: The authors have declared that no competing interest exists.
Figures
Similar articles
-
Salicylic acid and jasmonic acid are essential for systemic resistance against tobacco mosaic virus in Nicotiana benthamiana.Mol Plant Microbe Interact. 2014 Jun;27(6):567-77. doi: 10.1094/MPMI-11-13-0349-R. Mol Plant Microbe Interact. 2014. PMID: 24450774
-
PeBL1, a novel protein elicitor from Brevibacillus laterosporus strain A60, activates defense responses and systemic resistance in Nicotiana benthamiana.Appl Environ Microbiol. 2015 Apr;81(8):2706-16. doi: 10.1128/AEM.03586-14. Epub 2015 Feb 6. Appl Environ Microbiol. 2015. PMID: 25662975 Free PMC article.
-
Jasmonic acid negatively regulates resistance to Tobacco mosaic virus in tobacco.Plant Cell Physiol. 2013 Dec;54(12):1999-2010. doi: 10.1093/pcp/pct137. Epub 2013 Sep 25. Plant Cell Physiol. 2013. PMID: 24071744
-
Elucidation of signaling molecules involved in ergosterol perception in tobacco.Plant Physiol Biochem. 2013 Dec;73:121-7. doi: 10.1016/j.plaphy.2013.09.009. Epub 2013 Sep 20. Plant Physiol Biochem. 2013. PMID: 24095918
-
Spatio-temporal expression of patatin-like lipid acyl hydrolases and accumulation of jasmonates in elicitor-treated tobacco leaves are not affected by endogenous levels of salicylic acid.Plant J. 2002 Dec;32(5):749-62. doi: 10.1046/j.1365-313x.2002.01465.x. Plant J. 2002. PMID: 12472690
Cited by
-
Enhancement of resistance by poultry manure and plant hormones (salicylic acid & citric acid) against tobacco mosaic virus.Saudi J Biol Sci. 2021 Jun;28(6):3526-3533. doi: 10.1016/j.sjbs.2021.03.025. Epub 2021 Mar 17. Saudi J Biol Sci. 2021. PMID: 34121895 Free PMC article.
-
Enhanced Tolerance of Chinese Cabbage Seedlings Mediated by Bacillus aryabhattai H26-2 and B. siamensis H30-3 against High Temperature Stress and Fungal Infections.Plant Pathol J. 2018 Dec;34(6):555-566. doi: 10.5423/PPJ.OA.07.2018.0130. Epub 2018 Dec 1. Plant Pathol J. 2018. PMID: 30588228 Free PMC article.
-
Potential Antagonistic Bacteria against Verticillium dahliae Isolated from Artificially Infested Nursery.Cells. 2021 Dec 20;10(12):3588. doi: 10.3390/cells10123588. Cells. 2021. PMID: 34944096 Free PMC article.
-
Unlocking antagonistic potential of Bacillus amyloliquefaciens KRS005 to control gray mold.Front Microbiol. 2023 Jun 2;14:1189354. doi: 10.3389/fmicb.2023.1189354. eCollection 2023. Front Microbiol. 2023. PMID: 37333651 Free PMC article.
-
Antiviral activity of glucosylceramides isolated from Fusarium oxysporum against Tobacco mosaic virus infection.PLoS One. 2020 Nov 25;15(11):e0242887. doi: 10.1371/journal.pone.0242887. eCollection 2020. PLoS One. 2020. PMID: 33237955 Free PMC article.
References
-
- Van Loon LC, Bakker PAHM. Signalling in rhizobacteria-plant interactions. In Root ecology, Springer Berlin Heidelberg; 2003. pp. 297–330.
-
- Van Loon LC, Glick BR. Increased plant fitness by rhizobacteria. In Molecular ecotoxicology of plants. Springer Berlin Heidelberg; 2004. pp. 177–205.
-
- Haas D, Defago G. Biological control of soil-borne pathogens by fluorescent pseudomonads. Nat Rev Microbiol. 2005;3:307–319. - PubMed
-
- Diez-Navajas AM, Wiedemann-Merdinoglu S, Greif C. et al. Nonhost versus host resistance to the grapevine downy mildew, Plasmopara viticola, studied at the tissue level. Phytopathology. 2008;98:776–780. - PubMed
Publication types
MeSH terms
Substances
LinkOut - more resources
Full Text Sources
Other Literature Sources
