. 2016 May 19;7(5):e2232.
doi: 10.1038/cddis.2016.135.

Apoptotic CD8 T-lymphocytes disable macrophage-mediated immunity to Trypanosoma cruzi infection

Affiliations

Apoptotic CD8 T-lymphocytes disable macrophage-mediated immunity to Trypanosoma cruzi infection

M P Cabral-Piccin et al. Cell Death Dis. .

Abstract

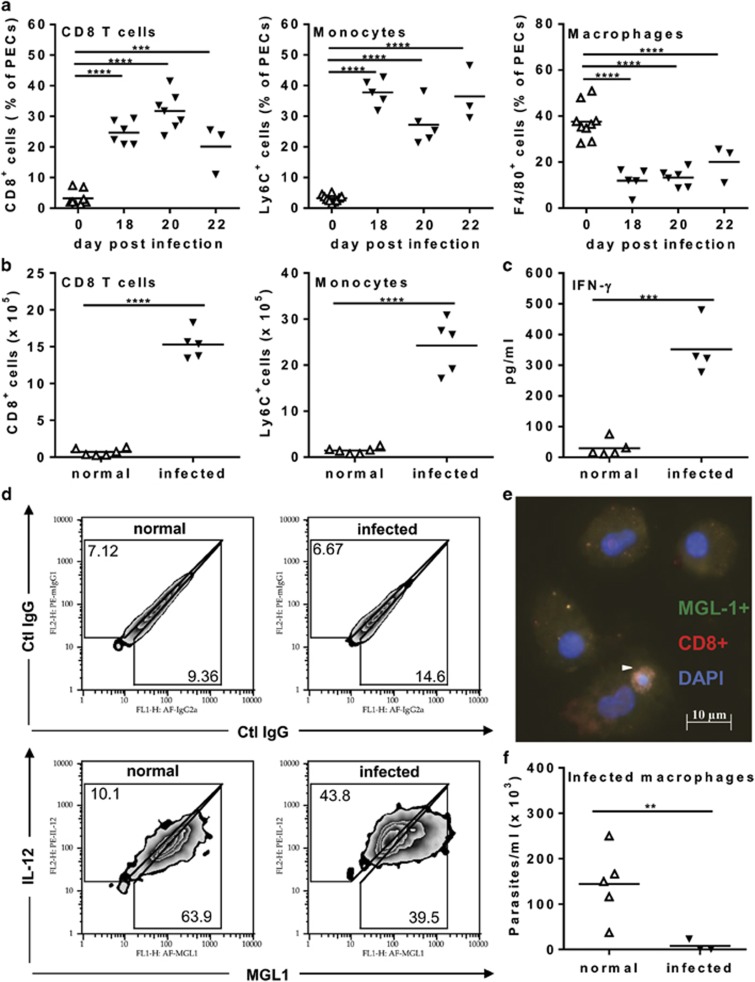
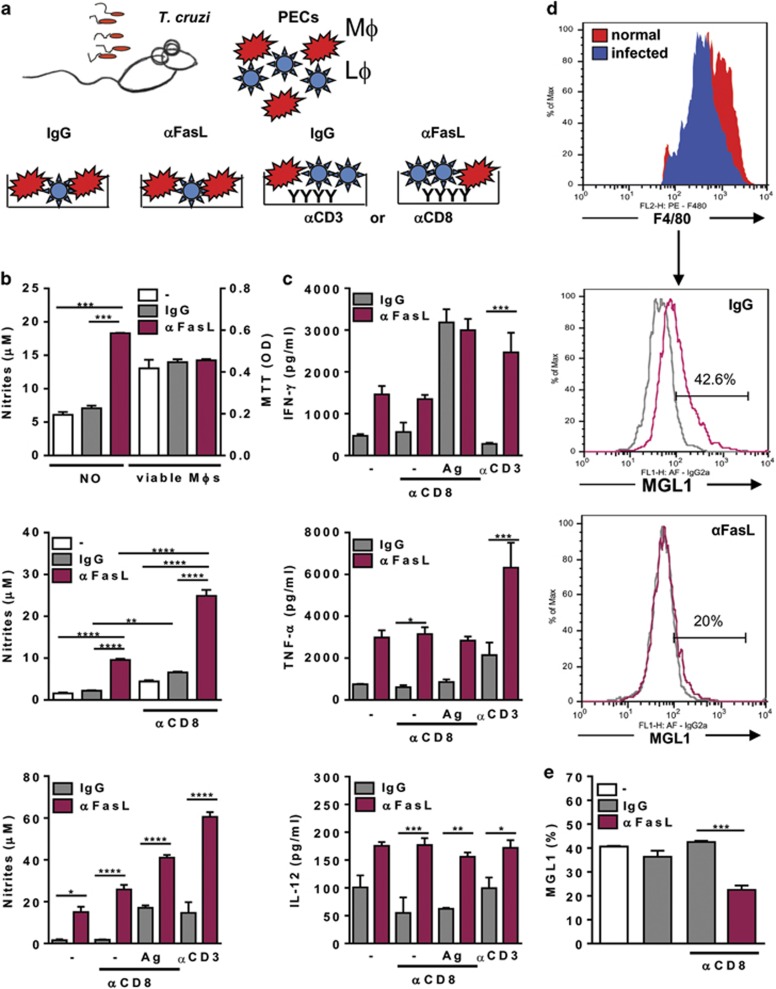
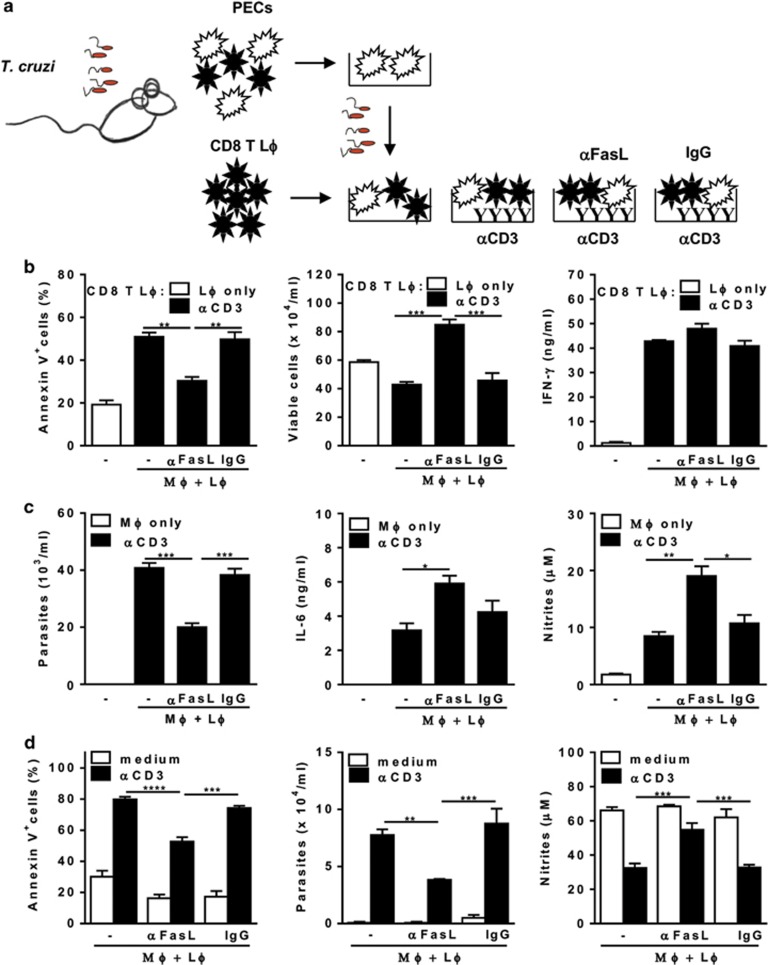
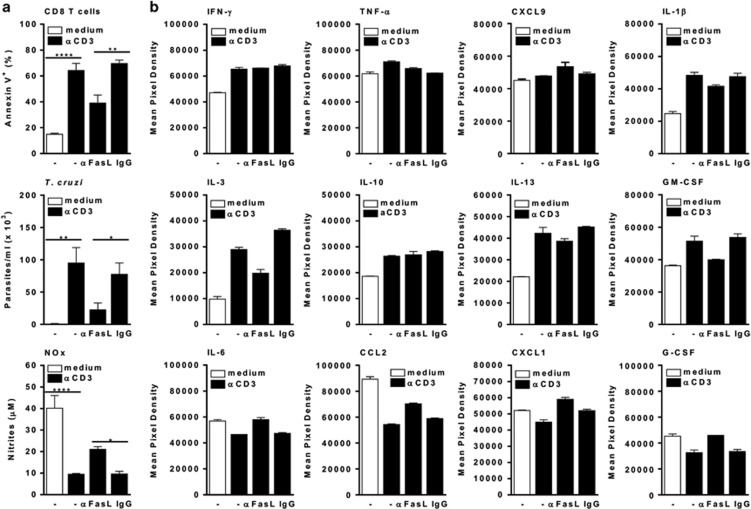
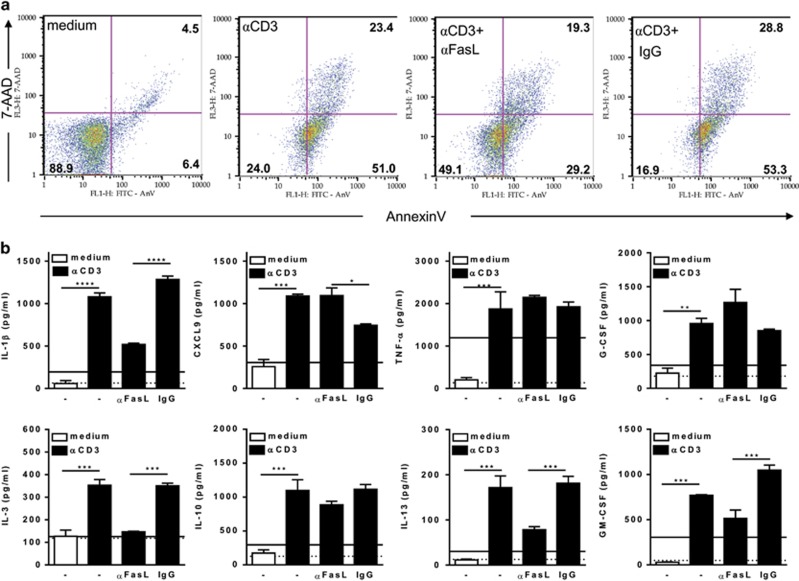
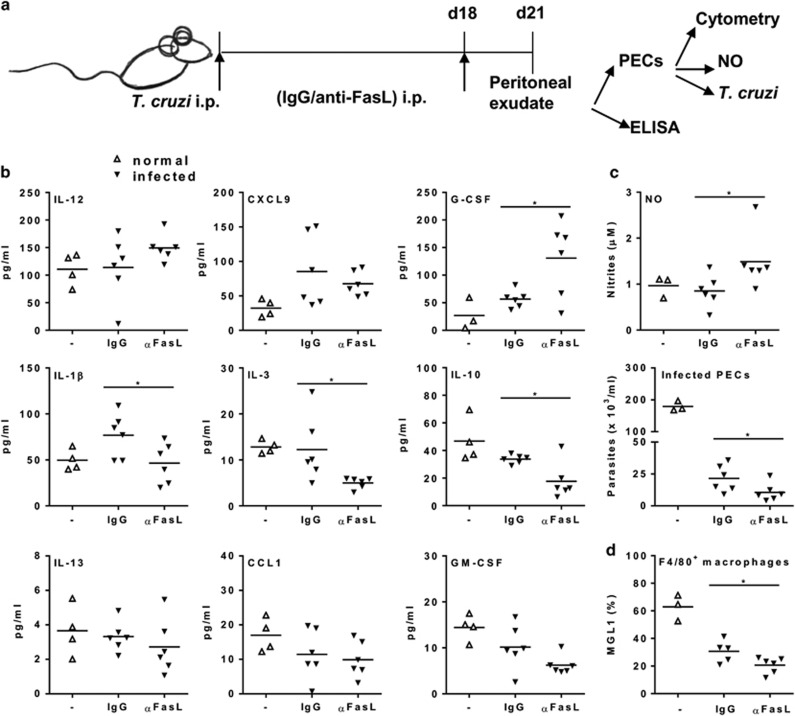
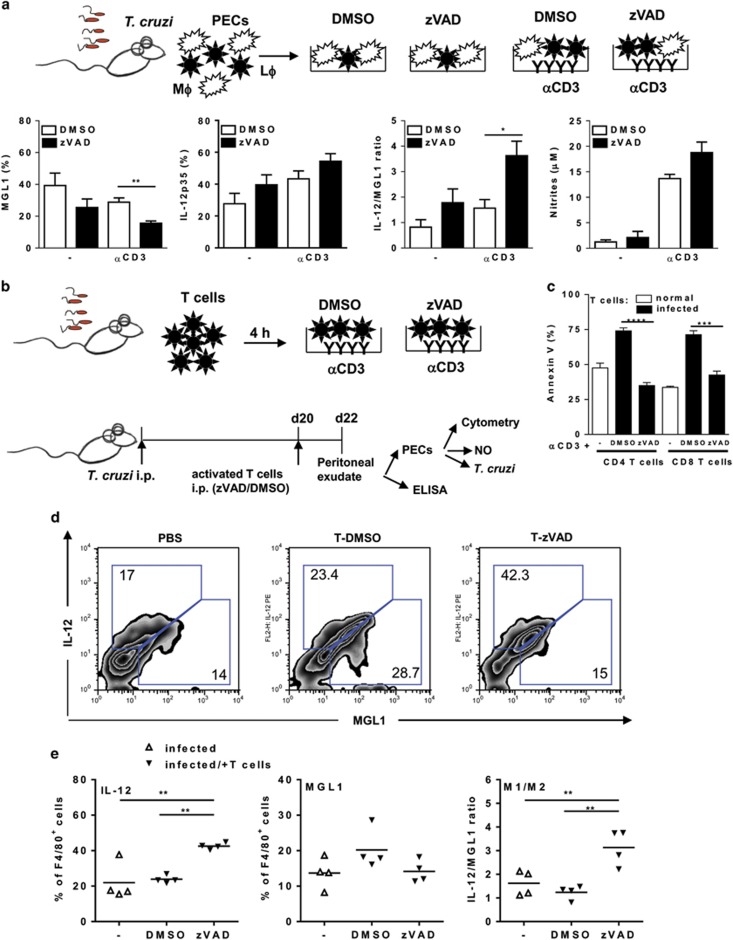
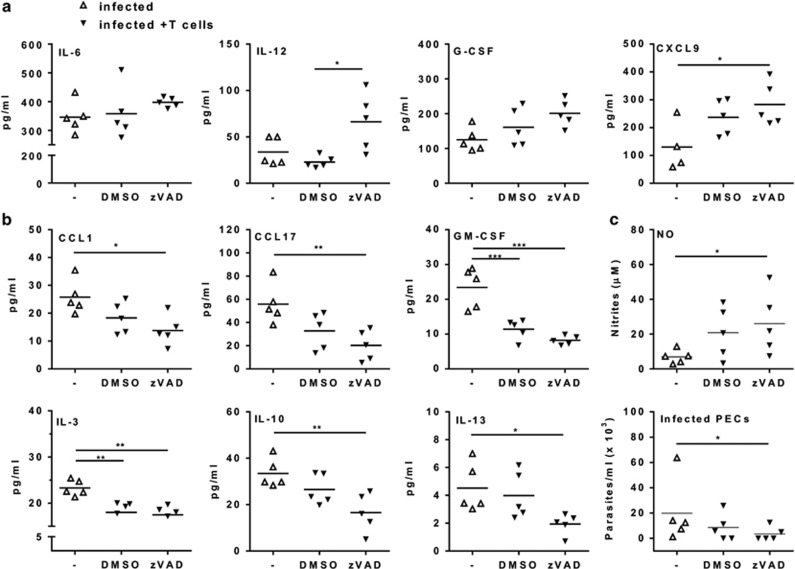
Chagas disease is caused by infection with the protozoan Trypanosoma cruzi. CD8 T-lymphocytes help to control infection, but apoptosis of CD8 T cells disrupts immunity and efferocytosis can enhance parasite infection within macrophages. Here, we investigate how apoptosis of activated CD8 T cells affects M1 and M2 macrophage phenotypes. First, we found that CD8 T-lymphocytes and inflammatory monocytes/macrophages infiltrate peritoneum during acute T. cruzi infection. We show that treatment with anti-Fas ligand (FasL) prevents lymphocyte apoptosis, upregulates type-1 responses to parasite antigens, and reduces infection in macrophages cocultured with activated CD8 T cells. Anti-FasL skews mixed M1/M2 macrophage profiles into polarized M1 phenotype, both in vitro and following injection in infected mice. Moreover, inhibition of T-cell apoptosis induces a broad reprogramming of cytokine responses and improves macrophage-mediated immunity to T. cruzi. The results indicate that disposal of apoptotic CD8 T cells increases M2-macrophage differentiation and contributes to parasite persistence.


Figures

Figure 1
Figure 1
CD8 T cells and monocyte-derived macrophages in acute T. cruzi infection. (a) Percentages of CD8+ T cells, Ly6C+ monocytes, and F4/80+ macrophages in PECs from T. cruzi-infected mice compared with PECs from uninfected (d 0) mice. (b) Absolute numbers of CD8+ T cells and Ly6C+ monocytes and (c) IFN-γ in peritoneal exudates from normal and infected (18 dpi) mice. (d) Expression of MGL1 (M2) and IL-12p35 (M1) markers (as well as the respective control mAbs, upper panels) in F4/80+ macrophages from normal or infected (18 dpi) mice cultured during 48 h. (e) Image depicts PECs from infected (18 dpi) mice and represents results of three independent experiments. T cells were stained with anti-CD8 (PE, red, arrow head), macrophages stained with anti-MGL1 (Alexa Fluor 488, green), and nuclei marked with DAPI (blue). (f) Parasite burden as trypomastigotes released by macrophages from normal or infected (18 dpi) mice cultured during 3 weeks after infection with metacyclic parasites. In (a, b, c, and f), each symbol represents an individual normal (Δ) or infected (▾) mouse. Significant differences between normal (N=5–10) and infected (N=3–7) mice are indicated (*), as analyzed by analysis of variance (ANOVA) with Dunnett's post-test (a) and t-test (b, c, and f). Graphs depicted in (d) are representative of at least three independent experiments with pools of cells from infected (18 dpi) mice, cultured in two to four technical replicates. IL, interleukin
Figure 2
Figure 2
M2- to M1-phenotype shift in peritoneal cells treated with anti-FasL. (af) PECs from normal or T. cruzi-infected mice (18–20 dpi) were cultured with or without plate-bound anti-CD8 or anti-CD3 in the presence or absence of anti-FasL or control immunoglobulin G (IgG). (b and c) Some cultures were stimulated with T. cruzi Ag, as indicated. (b) NO production in supernatants and viability of adherent cells (by MTT assay) were evaluated after 24 h (b, upper panel) or 48 h. (c) secreted cytokines were measured in 48 h supernatants by enzyme-linked immunosorbent assay (ELISA). (d and e) Cells were detached for evaluation of MGL1 expression in gated F4/80+ cells. Results are expressed as means and S.E.M. and represent three independent experiments with three technical replicates of pooled cells from infected mice. Significant differences between treatments are indicated (*), as analyzed by t-test (e) or by analysis of variance (ANOVA) with Tukey's post-test (b, upper panel) or by two-way ANOVA with Tukey's (b, middle panel) or Bonferroni (b, lower panel, and c) post-test
Figure 3
Figure 3
FasL-mediated apoptosis of CD8 T cells drives T. cruzi infection in cocultured macrophages. (a–d) Peritoneal macrophages from infected (18 dpi) mice were infected with T. cruzi and cocultured with purified splenic CD8 T cells from infected (18–20 dpi) mice in the presence of interleukin-2 (IL-2). Cocultures were stimulated or not with soluble anti-CD3 and treated or not with anti-FasL or control immunoglobulin G (IgG). (b–d) After 48 h, culture supernatants were collected for NO or cytokine responses. (b and d) CD8 T cells were collected for detection of apoptosis by annexin V and 7-aminoactinomycin D (7-AAD) staining. (c and d) Adherent cells were cultured during 2–3 weeks for determination of parasite burden, as released trypomastigotes. Data are expressed as means and S.E.M. of three technical replicates. Each set of data (b–d) represents at least three independent experiments. Significant differences between treatments in anti-CD3 activated cultures are indicated (*), as analyzed by analysis of variance (ANOVA) (b and c) or by two-way ANOVA (d) with Tukey's post-test
Figure 4
Figure 4
Apoptosis of CD8 T cells correlates with a broad reprogramming of macrophage cytokine responses. (a and b) Infected macrophages and splenic CD8 T cells from infected mice were stimulated or not with soluble anti-CD3 in the presence of interleukin-2 (IL-2). Anti-CD3-activated cocultures were treated or not with anti-FasL or control immunoglobulin G (IgG). After 48 h, culture supernatants were collected for evaluation of NO (a) or cytokine (b) responses, as assessed by a cytokine array. CD8 T cells were analyzed for annexin V/7-AAD (7-aminoactinomycin D) staining (a). Adherent cells were cultured during 4 weeks for determination of released trypomastigotes (a). Data represent mean and S.E.M. of two (b), or three to four (a) technical replicates. Data depicted in (a) represent at least three independent experiments. Significant differences between treatments are indicated (*), as analyzed by analysis of variance (ANOVA) with Bonferroni post-test (a)
Figure 5
Figure 5
Apoptosis of CD8 T cells correlates with M2-cytokine responses. (a and b) Peritoneal macrophages and splenic CD8 T cells from infected mice were stimulated or not with soluble anti-CD3 in the presence of interleukin-2 (IL-2). Anti-CD3-activated cocultures were treated or not with anti-FasL or control immunoglobulin G (IgG). After 48 h, culture supernatants were collected for evaluation of cytokine responses, as assessed by enzyme-linked immunosorbent assay (ELISA) (b). CD8 T cells were analyzed for annexin V/7-AAD (7-aminoactinomycin D) staining (a). (b) Full lines stand for cytokines produced by stimulated CD8 T cells and dotted lines represent cytokine responses by macrophages. Data represents mean and S.E.M. of three to four technical replicates in at least three independent experiments. Significant differences between treatments are indicated (*), as analyzed by analysis of variance (ANOVA) with Bonferroni post-test
Figure 6
Figure 6
Treatment with anti-FasL promotes macrophage-mediated immunity to T. cruzi infection. (a–d) Infected BALB/c mice (18 dpi) were treated intraperitoneally with anti-FasL (100 μg) or control immunoglobulin G (IgG). Uninfected mice were used as controls. (b) After 3 days, peritoneal exudates were analyzed for cytokines and chemokines. (c) Peritoneal macrophages were cultured during 24 h before evaluation of spontaneous NO production or were infected with T. cruzi and cultured during 2 weeks before determination of parasite burden. (d) PECs were evaluated for MGL1 expression in F4/80+ cells. Symbols represent peritoneal cells or exudates from individual normal (Δ) or infected (▾) mice treated with anti-FasL or immunoglobulin G (IgG) (N=6 mice per group). In (c), each symbol represents the means of two to three technical replicates of cultured cells from each individual mouse. Significant differences between treatments are indicated as (*) for P<0.05 in t-test
Figure 7
Figure 7
Inhibition of activation-induced T-cell death shifts M2 into M1 macrophages. (a) PECs from T. cruzi-infected mice were cultured with or without plate-bound anti-CD3 in the presence of caspase inhibitor zVAD or dimethyl sulfoxide (DMSO). Cells were detached after 48 h for evaluation of MGL1 and IL-12p35 expression in gated F4/80+ cells. NO production was measured in 48 h culture supernatants. Results are expressed as means and S.E.M. of three to four technical replicates of pooled PECs from infected mice. (b) T cells from normal or infected mice (20 dpi) were treated with anti-CD3 in the absence or presence of zVAD or DMSO during 4 h for in vivo injection and 24 h (c) for flow cytometry. (c) T cells were analyzed for annexin V staining in CD8 and CD4 T cells. Results are expressed as means and S.E.M. of four to five technical replicates. (d and e) Infected mice (20 dpi) were injected intraperitoneally with phosphate-buffered saline (PBS) (−) or with 2 × 10⁶ activated T cells (treated with zVAD or DMSO). After 2 days, PECs were collected and activated with PMA and ionomycin, before staining for MGL1 and IL-12p35 expression in F4/80+ cells. (e) Symbols represent PECs from individual infected mice treated with PBS (Δ) or with T cells (▾) activated in the presence of zVAD or DMSO (N=4 mice per group). Significant differences between treatments are indicated (*), as analyzed by t-test (a and c) or by analysis of variance (ANOVA) with Tukey's post-test (e)
Figure 8
Figure 8
Inhibition of T-cell apoptosis enhances macrophage-mediated immunity to T. cruzi infection. (ac) Splenic T cells from infected mice (18 dpi) were treated with anti-CD3 in the presence of caspase inhibitor zVAD or dimethyl sulfoxide (DMSO) for 4 h. T cells were washed and adoptively transferred intraperitoneally to infected mice (20 dpi). Infected mice injected with phosphate-buffered saline (PBS) only were used as controls. After 2 days, peritoneal exudates were analyzed for (a) M1 and for (b) M2 cytokines. (c) Peritoneal macrophages were cultured during 24 h before evaluation of spontaneous NO production or infected with T. cruzi and cultured during 4 weeks before determination of parasite burden. (a and b) Symbols represent peritoneal exudates from individual mice injected with PBS (Δ) or with activated T cells (▾) previously treated with zVAD or DMSO (N=5 mice per group). In (c), each symbol represents the mean of two to three technical replicates of cultured cells from each individual mouse. Significant differences between treatments are indicated (*), as analyzed by t-test (c) or by analysis of variance (ANOVA) with Tukey's post-test (a and b)

References

    1. Coura JR, Vinas PA. Chagas disease: a new worldwide challenge. Nature 2010; 465: S6–S7. - PubMed
    1. Lescure FX, Le Loup G, Freilij H, Develoux M, Paris L, Brutus L et al. Chagas disease: changes in knowledge and management. Lancet Infect Dis 2010; 10: 556–570. - PubMed
    1. Morillo CA, Marin-Neto JA, Avezum A, Sosa-Estani S, Rassi A Jr., Rosas F et al. Randomized Trial of benznidazole for chronic chagas' cardiomyopathy. N Engl J Med 2015; 373: 1295–1306. - PubMed
    1. Junqueira C, Caetano B, Bartholomeu DC, Melo MB, Ropert C, Rodrigues MM et al. The endless race between Trypanosoma cruzi and host immunity: lessons for and beyond Chagas disease. Expert Rev Mol Med 2010; 12: e29. - PubMed
    1. Aliberti JC, Cardoso MA, Martins GA, Gazzinelli RT, Vieira LQ, Silva JS. Interleukin-12 mediates resistance to Trypanosoma cruzi in mice and is produced by murine macrophages in response to live trypomastigotes. Infect Immun 1996; 64: 1961–1967. - PMC - PubMed

MeSH terms