. 2016 May 19;11(5):e0155647.
doi: 10.1371/journal.pone.0155647. eCollection 2016.

ROS Involves the Fungicidal Actions of Thymol against Spores of Aspergillus flavus via the Induction of Nitric Oxide

Affiliations

ROS Involves the Fungicidal Actions of Thymol against Spores of Aspergillus flavus via the Induction of Nitric Oxide

Qingshan Shen et al. PLoS One. .

Abstract

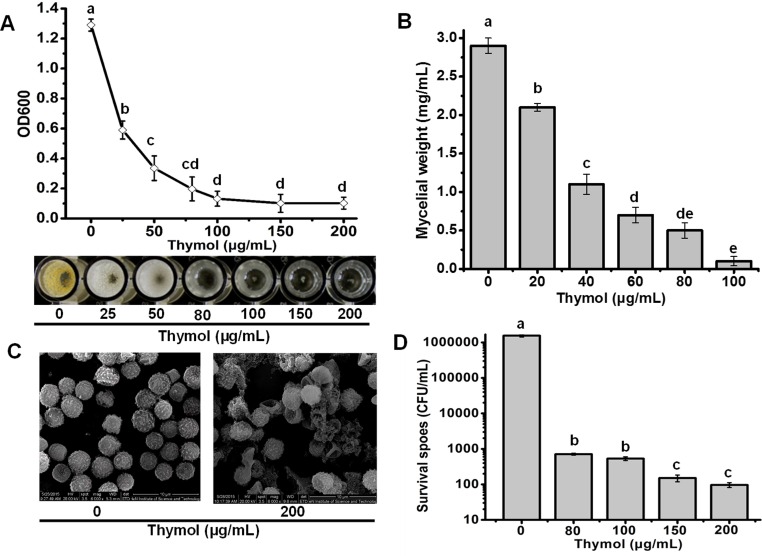
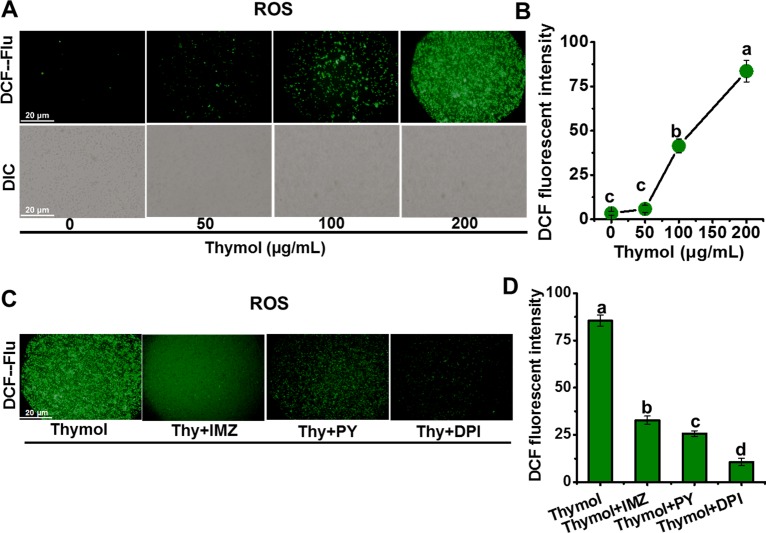
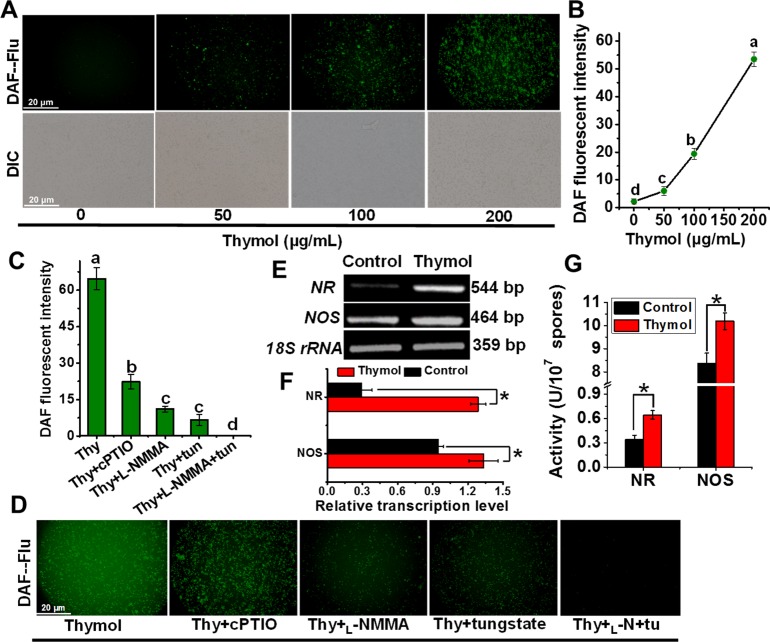
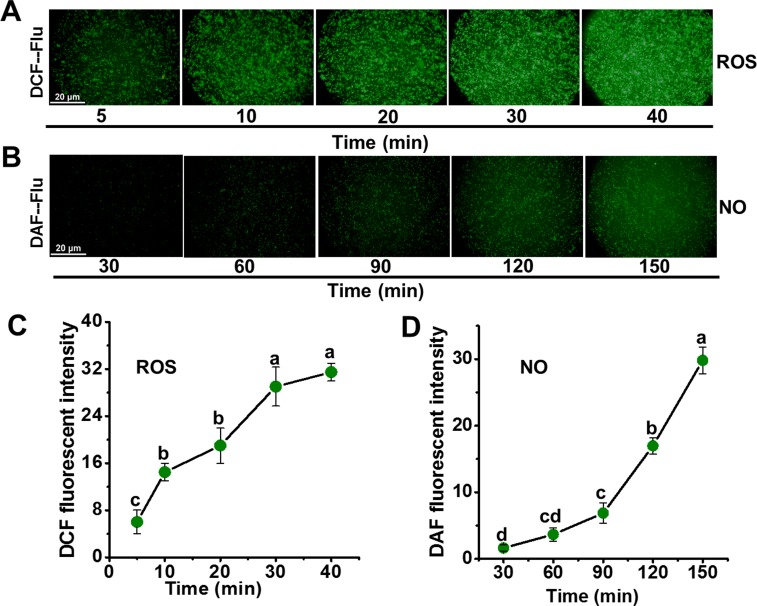
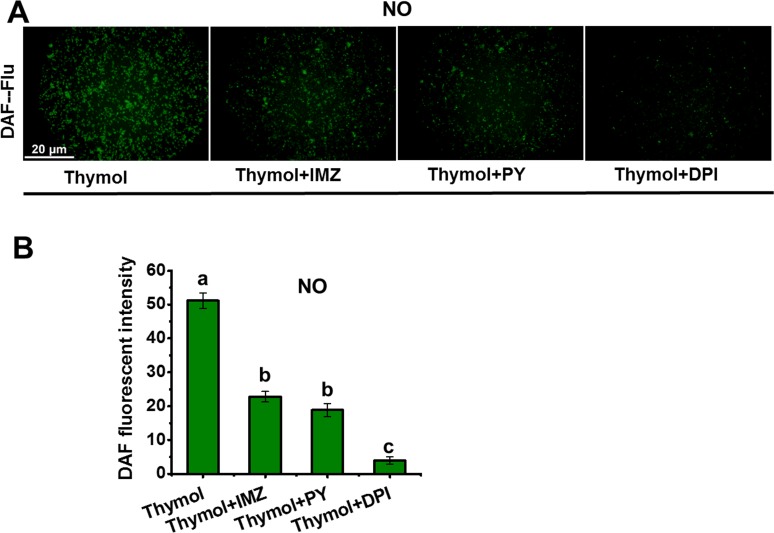
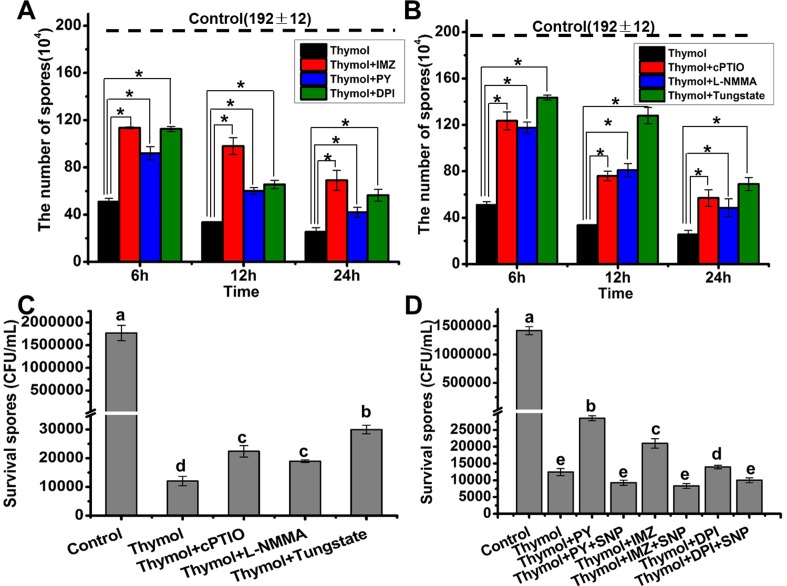
Aspergillus flavus is a well-known pathogenic fungus for both crops and human beings. The acquisition of resistance to azoles by A. flavus is leading to more failures occurring in the prevention of infection by A. flavus. In this study, we found that thymol, one of the major chemical constituents of the essential oil of Monarda punctate, had efficient fungicidal activity against A. flavus and led to sporular lysis. Further studies indicated that thymol treatment induced the generation of both ROS and NO in spores, whereas NO accumulation was far later than ROS accumulation in response to thymol. By blocking ROS production with the inhibitors of NADPH oxidase, NO generation was also significantly inhibited in the presence of thymol, which indicated that ROS induced NO generation in A. flavus in response to thymol treatment. Moreover, the removal of either ROS or NO attenuated lysis and death of spores exposed to thymol. The addition of SNP (exogenous NO donor) eliminated the protective effects of the inhibitors of NADPH oxidase on thymol-induced lysis and death of spores. Taken together, it could be concluded that ROS is involved in spore death induced by thymol via the induction of NO.


Conflict of interest statement

Competing Interests: The authors have declared that no competing interests exist.

Figures

Fig 1
Fig 1. Antifungal effects of thymol on the A. flavus spores.
(A) The spore growth in the wells containing 0, 25, 50, 80, 100, 150 and 200 μg/mL thymol determined by the OD600 values and visible observation. (B) Mycelial biomass formations in the presence of thymol at different concentrations. (C) The morphology of spores exposed to 0 and 200 μg/mL thymol under SEM (20.0KV, 6000×). (D) The survival of spores in the wells exposed to more than 80μg/mL thymol. Each data point or bar was indicated as the means of 3 replicates ± standard deviation. Different letter indicate a significant difference between them (P <0.05).
Fig 2
Fig 2. Thymol induced the generation of ROS in spores of A. flavus.
(A, B) The image and relative intensity of DCF fluorescence were obtained when the spores were exposed to thymol (0, 50, 100, 150, and 200 μg/mL, respectively) for 30 min; (C, D) The image and relative intensity of DCF fluorescence were obtained when the spores treated with NADPH oxidase inhibitors (DPI, PY, and IMZ) were exposed to 200μg/mL thymol for 30 min. Each data point or bar was indicated as the means of 3 replicates ± standard deviation. Asterisk indicates that mean values of three replicates are significantly different from the treatment of thymol (P<0.05). Different letter indicate a significant difference between them (P <0.05).
Fig 3
Fig 3. Thymol induced the generation of NO via NR and NOS in spores of A. flavus.
(A, B) The image and relative intensity of DAF fluorescence were obtained when the spores were exposed to thymol (0, 50, 100, 150, and 200 μg/mL, respectively) for 150 min; (C, D) The image and relative intensity of DAF fluorescence were obtained when the spores were exposed to 200μg/mL thymol for 150 min after the treatment with NOS inhibitors (L-NMMA), NR inhibitor (tungstate) and NO scavenger (cPTIO), respectively; (E, F) The RT-PCR products in the agarose gel and the relative transcription levels of NR and NOS gene normalized on 18S rRNA level in the spores post the exposure of thymol for 3h; (G) The NR and NOS activities in the spores post the exposure of thymol for 3h. Each data point or bar was indicated as the means of 3 replicates ± standard deviation. Asterisk indicates that mean values of three replicates are significantly different from the treatment of thymol (P<0.05). Different letter indicate a significant difference between them (P <0.05).
Fig 4
Fig 4. Time course of ROS (A, C) and NO (B, D) generation in spores exposed to thymol.
(A) Image of DCF fluorescence was obtained when spores were exposed to 200μg/mL thymol for 0, 10, 20, 30 and 40 min; (B) Image of DAF fluorescence was obtained when spores were exposed to 200μg/mL thymol for 30, 60, 90, 120 and 150 min; (C) Relative intensity of DCF fluorescence; (D) Relative intensity of DAF fluorescence. Each data point was indicated as the means of 3 replicates ± standard deviation.
Fig 5
Fig 5. NO generation by blocking the ROS generation in the spores exposed to thymol.
(A) The image of DAF fluorescence was obtained when the spores treated with NADPH oxidase inhibitors (DPI, PY, and IMZ) were exposed to 200μg/mL thymol for 150min; (B) Relative intensity of DAF fluorescence. Each data bar was indicated as the means of 3 replicates ± standard deviation. Asterisk indicates that mean values of three replicates are significantly different from the treatment of thymol (P<0.05).
Fig 6
Fig 6. Removal of ROS or NO led to less sporular lysis and death in A. flavus.
(A)The count of remaining spores when they were exposed to 200 μg/mL thymol for 6,12 and 24h after blocking the ROS generation by the addition of NADPH oxidase inhibitors (DPI, PY, and IMZ); (B) The count of remaining spores when they were exposed to 200 μg/mL thymol for 6,12 and 24h after blocking the NO generation by the addition of NOS inhibitors (L-NMMA), NR inhibitor (tungstate) and NO scavenger (cPTIO); (C) The survival spores when they were exposed to 200 μg/ml thymol for 12 h after blocking the NO generation by the addition of NOS inhibitors (L-NMMA), NR inhibitor (tungstate) and NO scavenger (cPTIO); (D) The survival spores when they were exposed to 200 μg/mL thymol for 12 after blocking the ROS generation by the addition of NADPH oxidase inhibitors (DPI, PY, and IMZ) and then supplying exogenous SNP as the NO donor. The original spore number before the addition of all kinds of drugs is 1.92×10⁶. Each data bar was indicated as the means of 3 replicates ± standard deviation. Asterisk indicates that mean values of three replicates are significantly different between the different treatments (P<0.05)

References

    1. Machida M, Gomi K. Aspergillus: molecular biology and genomics: Horizon Scientific Press; 2010.
    1. Kensler TW, Roebuck BD, Wogan GN, Groopman JD. Aflatoxin: a 50-year odyssey of mechanistic and translational toxicology. Toxicol Sci. 2011;120 Suppl 1: S28–48. 10.1093/toxsci/kfq283 - DOI - PMC - PubMed
    1. Amaike S, Keller NP. Aspergillus flavus. Annu Rev Phytopathol. 2011;49: 107–133. 10.1146/annurev-phyto-072910-095221 - DOI - PubMed
    1. Chakrabarti A, Shivaprakash MR, Singh R, Tarai B, George VK, Fomda BA, et al. Fungal endophthalmitis: fourteen years’ experience from a center in India. Retina. 2008;28: 1400–1407. - PubMed
    1. Chakrabarti A, Rudramurthy SM, Panda N, Das A, Singh A. Epidemiology of chronic fungal rhinosinusitis in rural India. Mycoses. 2015;58: 294–302. 10.1111/myc.12314 - DOI - PubMed

MeSH terms

LinkOut - more resources