

A Biomathematical Model of Pneumococcal Lung Infection and Antibiotic Treatment in Mice
- PMID: 27196107
- PMCID: PMC4873198
- DOI: 10.1371/journal.pone.0156047
A Biomathematical Model of Pneumococcal Lung Infection and Antibiotic Treatment in Mice
Abstract
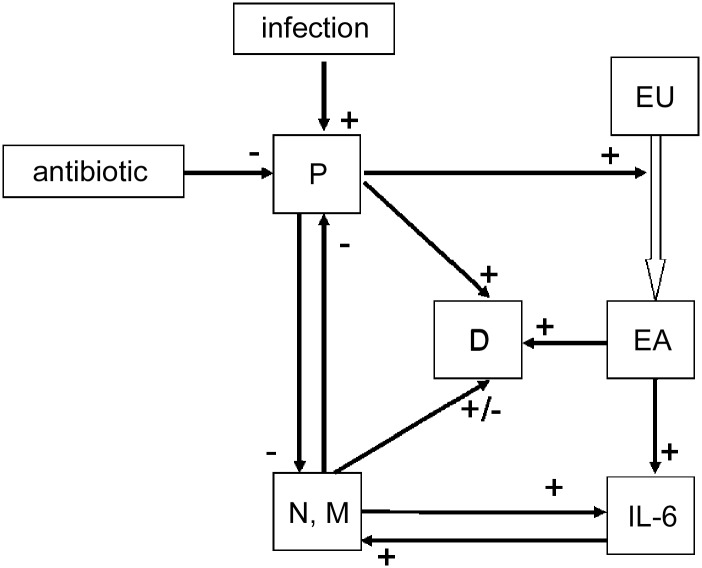
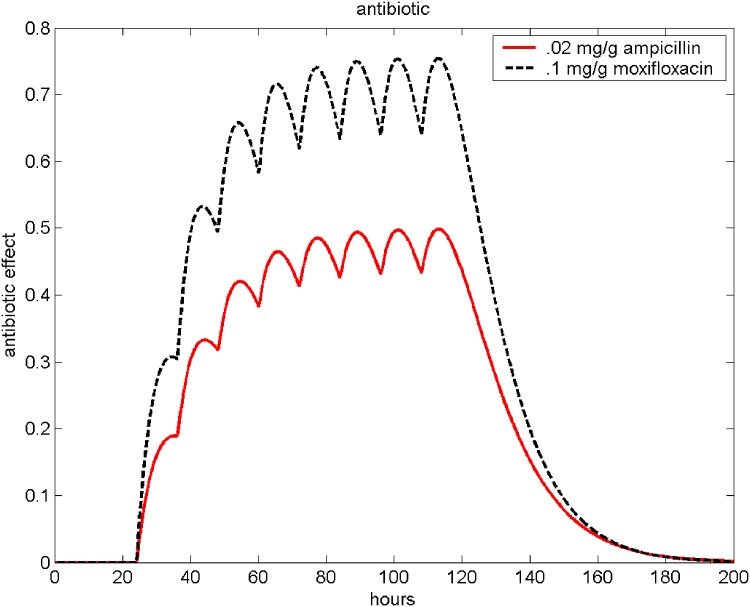
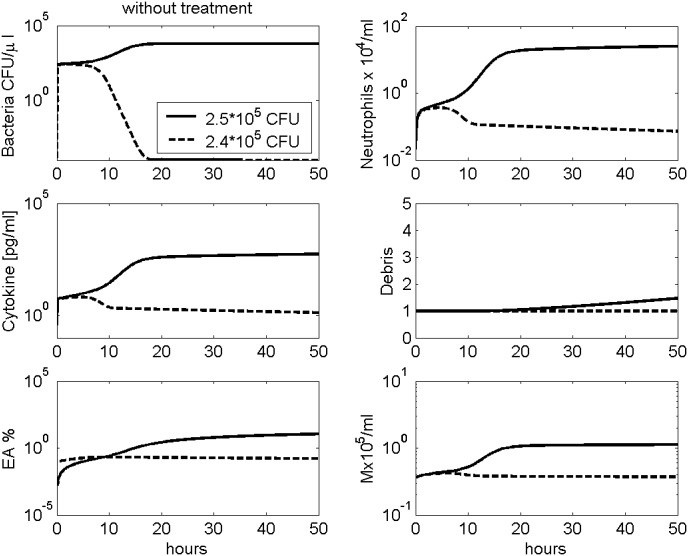
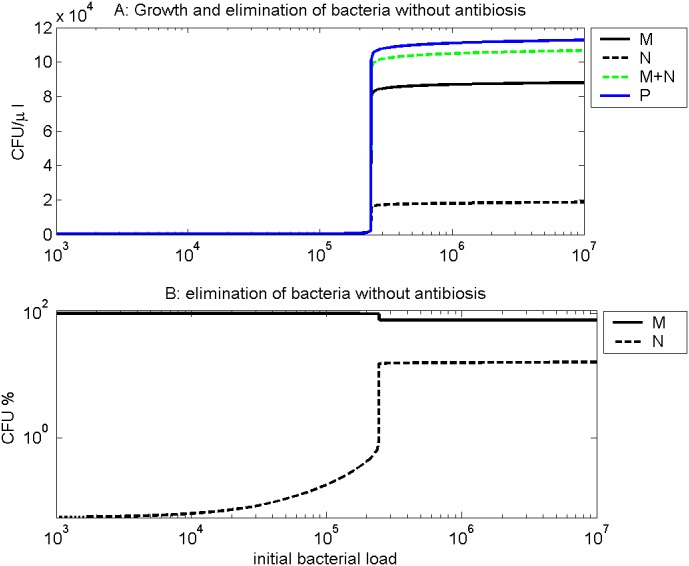
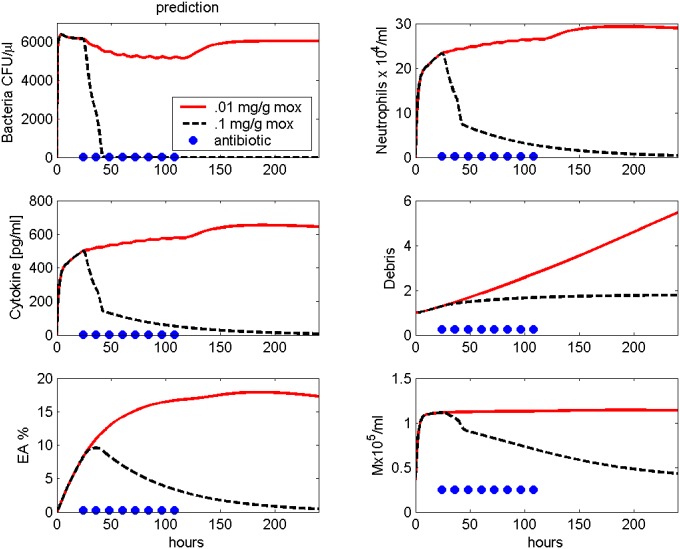
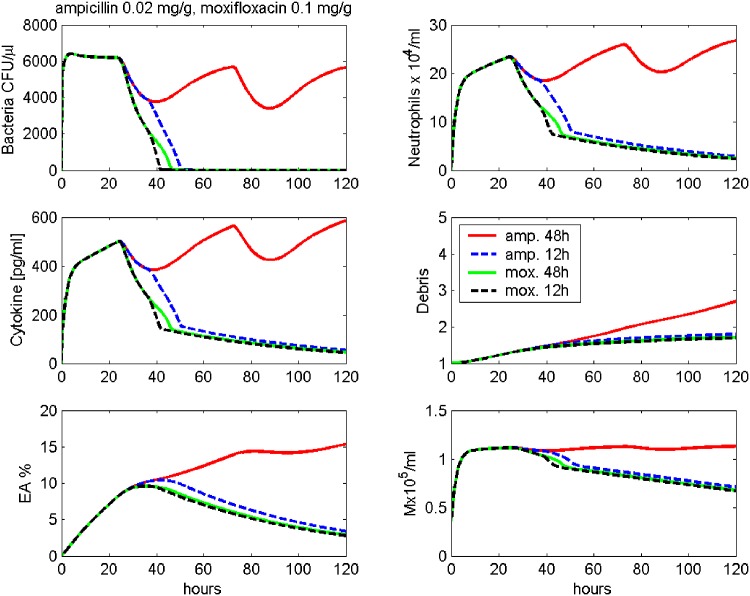
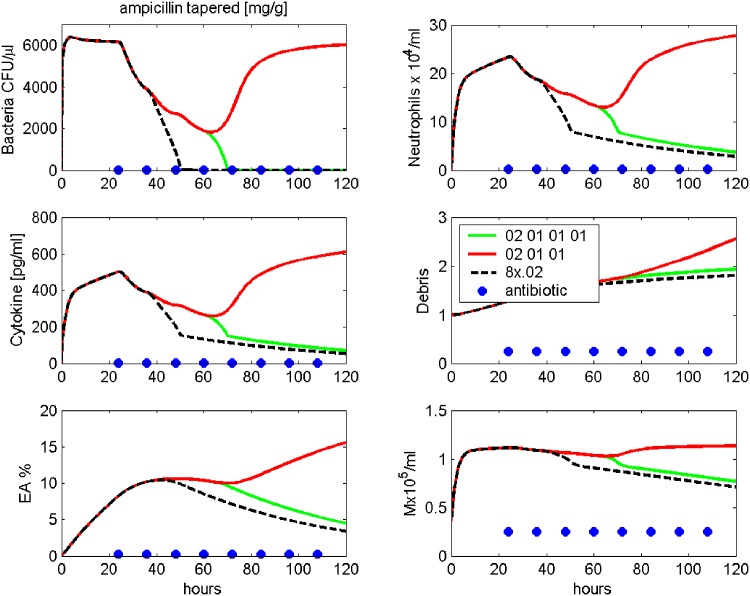
Pneumonia is considered to be one of the leading causes of death worldwide. The outcome depends on both, proper antibiotic treatment and the effectivity of the immune response of the host. However, due to the complexity of the immunologic cascade initiated during infection, the latter cannot be predicted easily. We construct a biomathematical model of the murine immune response during infection with pneumococcus aiming at predicting the outcome of antibiotic treatment. The model consists of a number of non-linear ordinary differential equations describing dynamics of pneumococcal population, the inflammatory cytokine IL-6, neutrophils and macrophages fighting the infection and destruction of alveolar tissue due to pneumococcus. Equations were derived by translating known biological mechanisms and assuming certain response kinetics. Antibiotic therapy is modelled by a transient depletion of bacteria. Unknown model parameters were determined by fitting the predictions of the model to data sets derived from mice experiments of pneumococcal lung infection with and without antibiotic treatment. Time series of pneumococcal population, debris, neutrophils, activated epithelial cells, macrophages, monocytes and IL-6 serum concentrations were available for this purpose. The antibiotics Ampicillin and Moxifloxacin were considered. Parameter fittings resulted in a good agreement of model and data for all experimental scenarios. Identifiability of parameters is also estimated. The model can be used to predict the performance of alternative schedules of antibiotic treatment. We conclude that we established a biomathematical model of pneumococcal lung infection in mice allowing predictions regarding the outcome of different schedules of antibiotic treatment. We aim at translating the model to the human situation in the near future.
Conflict of interest statement
Figures
Similar articles
-
A biomathematical model of immune response and barrier function in mice with pneumococcal lung infection.PLoS One. 2020 Dec 3;15(12):e0243147. doi: 10.1371/journal.pone.0243147. eCollection 2020. PLoS One. 2020. PMID: 33270742 Free PMC article.
-
A biomathematical model of atherosclerosis in mice.PLoS One. 2022 Aug 3;17(8):e0272079. doi: 10.1371/journal.pone.0272079. eCollection 2022. PLoS One. 2022. PMID: 35921269 Free PMC article.
-
Delay in antibiotic therapy results in fatal disease outcome in murine pneumococcal pneumonia.Crit Care. 2018 Nov 1;22(1):287. doi: 10.1186/s13054-018-2224-5. Crit Care. 2018. PMID: 30382866 Free PMC article.
-
Impact of the antibiotic dosage schedule on efficacy in experimental lung infections.Scand J Infect Dis Suppl. 1990;74:155-62. Scand J Infect Dis Suppl. 1990. PMID: 2097704 Review.
-
Therapeutic options for pneumococcal pneumonia in Turkey.Clin Ther. 2005 Jun;27(6):674-83. doi: 10.1016/j.clinthera.2005.06.009. Clin Ther. 2005. PMID: 16117975 Review.
Cited by
-
Gut Microbiota Protected Against pseudomonas aeruginosa Pneumonia via Restoring Treg/Th17 Balance and Metabolism.Front Cell Infect Microbiol. 2022 Jun 16;12:856633. doi: 10.3389/fcimb.2022.856633. eCollection 2022. Front Cell Infect Microbiol. 2022. PMID: 35782123 Free PMC article.
-
Markov State Modelling of Disease Courses and Mortality Risks of Patients with Community-Acquired Pneumonia.J Clin Med. 2020 Feb 5;9(2):393. doi: 10.3390/jcm9020393. J Clin Med. 2020. PMID: 32121038 Free PMC article.
-
Multiplicity of Mathematical Modeling Strategies to Search for Molecular and Cellular Insights into Bacteria Lung Infection.Front Physiol. 2017 Aug 30;8:645. doi: 10.3389/fphys.2017.00645. eCollection 2017. Front Physiol. 2017. PMID: 28912729 Free PMC article. Review.
-
A biomathematical model of immune response and barrier function in mice with pneumococcal lung infection.PLoS One. 2020 Dec 3;15(12):e0243147. doi: 10.1371/journal.pone.0243147. eCollection 2020. PLoS One. 2020. PMID: 33270742 Free PMC article.
-
A biomathematical model of SARS-CoV-2 in Syrian hamsters.Sci Rep. 2024 Dec 18;14(1):30541. doi: 10.1038/s41598-024-80498-9. Sci Rep. 2024. PMID: 39695178 Free PMC article.
References
-
- Wardlaw T, Johansson E, Hodge M. Pneumonia—The Forgotten Killer of Children. World Health Organization; UNICEF; 2006.
Publication types
MeSH terms
Substances
LinkOut - more resources
Full Text Sources
Other Literature Sources
Medical
