. 2016 May 19;11(5):e0155589.
doi: 10.1371/journal.pone.0155589. eCollection 2016.

Coinfections of the Respiratory Tract: Viral Competition for Resources

Affiliations

Coinfections of the Respiratory Tract: Viral Competition for Resources

Lubna Pinky et al. PLoS One. .

Abstract

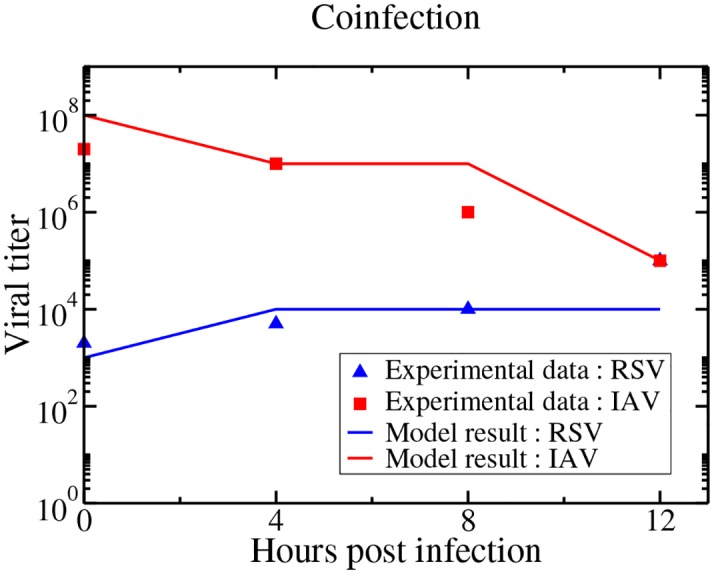
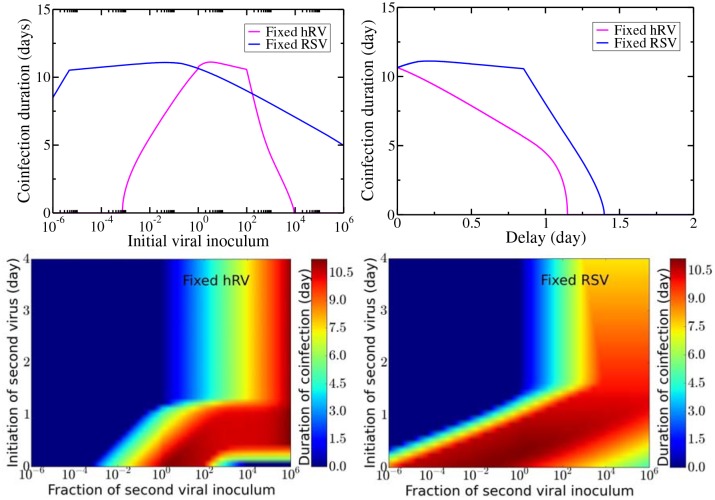
Studies have shown that simultaneous infection of the respiratory tract with at least two viruses is common in hospitalized patients, although it is not clear whether these infections are more or less severe than single virus infections. We use a mathematical model to study the dynamics of viral coinfection of the respiratory tract in an effort to understand the kinetics of these infections. Specifically, we use our model to investigate coinfections of influenza, respiratory syncytial virus, rhinovirus, parainfluenza virus, and human metapneumovirus. Our study shows that during coinfections, one virus can block another simply by being the first to infect the available host cells; there is no need for viral interference through immune response interactions. We use the model to calculate the duration of detectable coinfection and examine how it varies as initial viral dose and time of infection are varied. We find that rhinovirus, the fastest-growing virus, reduces replication of the remaining viruses during a coinfection, while parainfluenza virus, the slowest-growing virus is suppressed in the presence of other viruses.


Conflict of interest statement

Competing Interests: The authors have declared that no competing interests exist.

Figures

Fig 1
Fig 1. Model fits to the data from Shinjoh et al. [19].
(Left) Experimental data from single infections of RSV (blue) and influenza (red) are fit using a single infection model. Estimated parameters are given in the table (bottom). (Center) Coinfection model predictions and experimental data for RSV and influenza coinfection. (Right) Coinfection model with corrected decay rate predictions and experimental data for RSV and influenza coinfection.
Fig 2
Fig 2. Delayed influenza infection.
Our model predictions and experimental viral titer measurements of RSV and IAV viral titers measured at 51 hours post-RSV infection with IAV started with a delay of 0, 4, 8, and 12 h.
Fig 3
Fig 3. Single virus model fits to in vitro infections of respiratory tract cells.
Experimental data and single virus model best fits for influenza (top left), RSV (top center), rhinovirus (top right), hMPV (bottom left) and parainfluenza (bottom right).
Fig 4
Fig 4. Model predictions of the time courses of simultaneous respiratory viral infections.
Infections are initiated at the same time with the same amount of virus. Solid lines indicate the viral titer during a simultaneous infection while dashed lines indicate the viral titer during a single infection. The dashed black line indicates a typical experimental threshold of detection.
Fig 5
Fig 5. Duration of coinfection for each pair of viruses.
Infections are initiated with the same amount of virus at the same time. Single infections are given by the dashed lines and coninfection dynamics are given by the solid lines.
Fig 6
Fig 6. Simultaneous infection of rhinovirus and RSV when initial viral inoculum is varied.
In the top row, the RSV inoculum is fixed and rHV inoculum is varied. In the bottom row, hRV inoculum is fixed and RSV inoculum is varied. The dashed line indicates a typical experimental threshold of detection.
Fig 7
Fig 7. Simultaneous infection of rhinovirus and RSV with various time delays between the initiation of the infections.
The dashed line indicates a typical experimental threshold of detection.
Fig 8
Fig 8. Coinfection duration with varying initial viral inoculum and relative starting time of infection.
Coinfection duration as a function of initial viral inoculum (top left), relative starting time (top right) and as a function of both with hRV infection fixed (bottom left) and RSV infection fixed (bottom right).
Fig 9
Fig 9. Mathematical model of simultaneous infection by two viruses.
The two viruses infect the same target cell population, but coinfection of single cells is not allowed. Once infected, they enter an eclipse phase where they take some time before actively producing viruses. Newly produced viruses go on to infect other target cells.

References

    1. Global Burden of Disease Study. Global, regional, and national incidence, prevalence, and years lived with disability for 301 acute and chronic diseases and injuries in 188 countries, 1990-2013: a systematic analysis for the Global Burden of Disease Study 2013. Lancet. 2015. August 22;386(9995):743–800. 10.1016/S0140-6736(15)60692-4 - DOI - PMC - PubMed
    1. Waner JL. Mixed viral infections: detection and management. Clin Microbiol Rev. 1994. April;7(2):143–151. - PMC - PubMed
    1. Goka EA, Vallely PJ, Mutton KJ, Klapper PE. Single, dual and multiple respiratory virus infections and risk of hospitalization and mortality. Epidemiol Infect. 2015. January;143(1):37–47. 10.1017/S0950268814000302 - DOI - PMC - PubMed
    1. Goka E, Vallely P, Mutton K, Klappera P. Influenza A viruses dual and multiple infections with other respiratory viruses and risk of hospitalisation and mortality. Influenza Other Respir Viruses. 2013. November;7(6):1079–1087. 10.1111/irv.12020 - DOI - PMC - PubMed
    1. Martin ET, Kuypers J, Wald A, Englund JA. Multiple versus single virus respiratory infections: viral load and clinical disease severity in hospitalized children. Influenza and other respir viruses. 2011. May;6(1):71–77. 10.1111/j.1750-2659.2011.00265.x - DOI - PMC - PubMed