

Antibiotic-Resistant Neisseria gonorrhoeae Spread Faster with More Treatment, Not More Sexual Partners
- PMID: 27196299
- PMCID: PMC4872991
- DOI: 10.1371/journal.ppat.1005611
Antibiotic-Resistant Neisseria gonorrhoeae Spread Faster with More Treatment, Not More Sexual Partners
Abstract
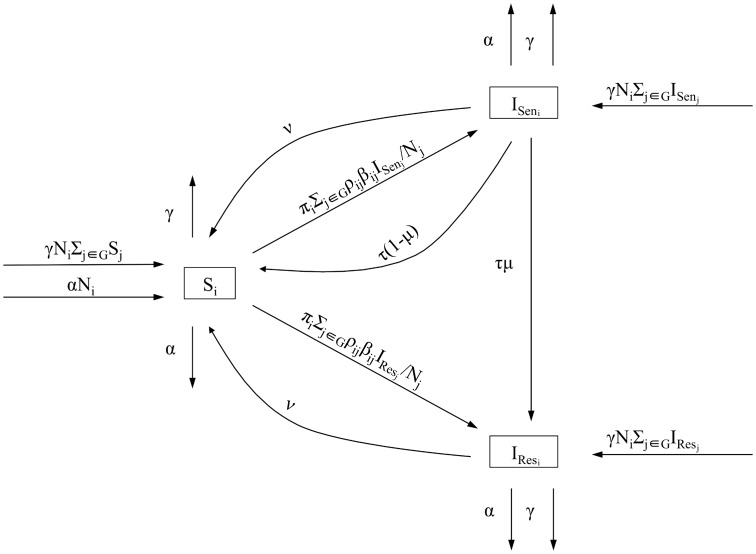
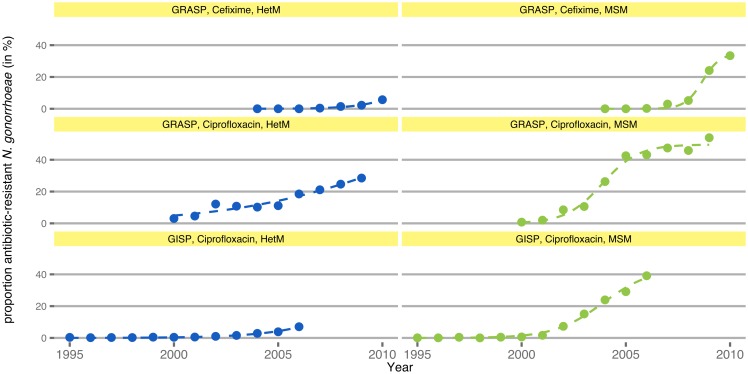
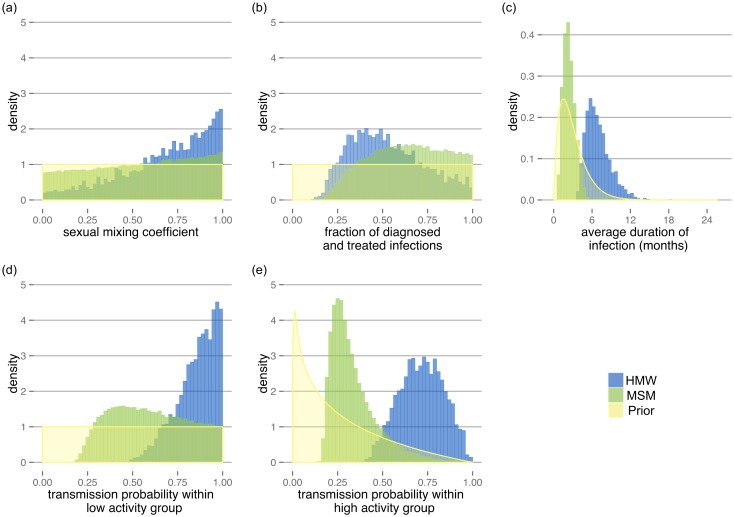
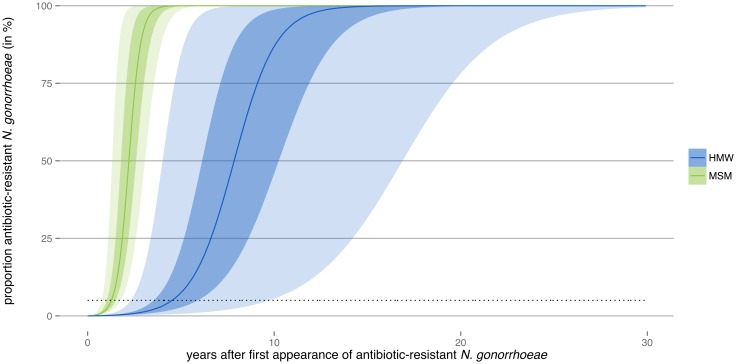
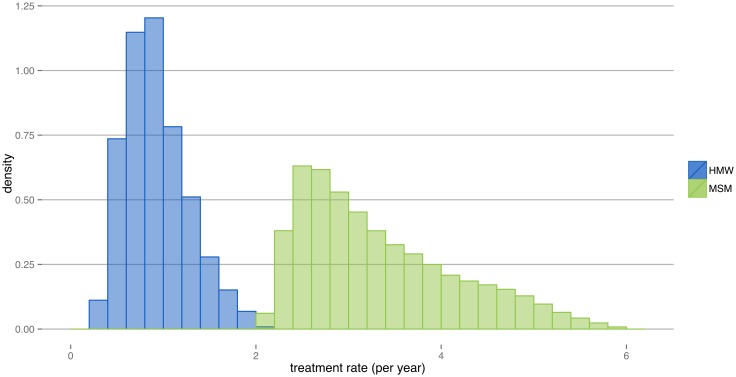
The sexually transmitted bacterium Neisseria gonorrhoeae has developed resistance to all antibiotic classes that have been used for treatment and strains resistant to multiple antibiotic classes have evolved. In many countries, there is only one antibiotic remaining for empirical N. gonorrhoeae treatment, and antibiotic management to counteract resistance spread is urgently needed. Understanding dynamics and drivers of resistance spread can provide an improved rationale for antibiotic management. In our study, we first used antibiotic resistance surveillance data to estimate the rates at which antibiotic-resistant N. gonorrhoeae spread in two host populations, heterosexual men (HetM) and men who have sex with men (MSM). We found higher rates of spread for MSM (0.86 to 2.38 y-1, mean doubling time: 6 months) compared to HetM (0.24 to 0.86 y-1, mean doubling time: 16 months). We then developed a dynamic transmission model to reproduce the observed dynamics of N. gonorrhoeae transmission in populations of heterosexual men and women (HMW) and MSM. We parameterized the model using sexual behavior data and calibrated it to N. gonorrhoeae prevalence and incidence data. In the model, antibiotic-resistant N. gonorrhoeae spread with a median rate of 0.88 y-1 in HMW and 3.12 y-1 in MSM. These rates correspond to median doubling times of 9 (HMW) and 3 (MSM) months. Assuming no fitness costs, the model shows the difference in the host population's treatment rate rather than the difference in the number of sexual partners explains the differential spread of resistance. As higher treatment rates result in faster spread of antibiotic resistance, treatment recommendations for N. gonorrhoeae should carefully balance prevention of infection and avoidance of resistance spread.
Conflict of interest statement
The authors have declared that no competing interests exist.
Figures
References
-
- Unemo M, Shafer WM. Antimicrobial Resistance in Neisseria gonorrhoeae in the 21st Century: Past, Evolution, and Future. Clin Microbiol Rev. 2014. July;27(3):587–613. Available from: http://www.ncbi.nlm.nih.gov/pubmed/24982323. 10.1128/CMR.00010-14 - DOI - PMC - PubMed
-
- Centers for Disease Control and Prevention. Sexually Transmitted Disease Surveillance 2012. Atlanta: U.S. Department of Health and Human Services; 2014.
-
- Public Health England. GRASP 2013 Report The Gonococcal Resistance to Antimicrobials Surveillance Programme (England and Wales); 2014.
-
- Davies S, Fowler T, Watson J, Livermore D, Walker D. Annual Report of the Chief Medical Officer: infection and the rise of antimicrobial resistance. Lancet. 2013;381:1606–1609. Available from: http://www.thelancet.com/journals/lancet/article/PIIS0140-6736(13)60604-.... 10.1016/S0140-6736(13)60604-2 - DOI - PubMed
-
- Ison CA, Town K, Obi C, Chisholm S, Hughes G, Livermore D, et al. Decreased susceptibility to cephalosporins among gonococci: data from the Gonococcal Resistance to Antimicrobials Surveillance Programme (GRASP) in England and Wales, 2007–2011. Lancet Infect Dis. 2013. September;13(9):762–8. Available from: http://www.ncbi.nlm.nih.gov/pubmed/23764300. 10.1016/S1473-3099(13)70143-9 - DOI - PubMed
MeSH terms
Substances
LinkOut - more resources
Full Text Sources
Other Literature Sources
Medical
Research Materials
