

Novel Identity and Functional Markers for Human Corneal Endothelial Cells
- PMID: 27196322
- PMCID: PMC4884060
- DOI: 10.1167/iovs.15-18826
Novel Identity and Functional Markers for Human Corneal Endothelial Cells
Abstract
Purpose: Human corneal endothelial cell (HCEC) density decreases with age, surgical complications, or disease, leading to vision impairment. Such endothelial dysfunction is an indication for corneal transplantation, although there is a worldwide shortage of transplant-grade tissue. To overcome the current poor donor availability, here we isolate, expand, and characterize HCECs in vitro as a step toward cell therapy.
Methods: Human corneal endothelial cells were isolated from cadaveric corneas and expanded in vitro. Cell identity was evaluated based on morphology and immunocytochemistry, and gene expression analysis and flow cytometry were used to identify novel HCEC-specific markers. The functional ability of HCEC to form barriers was assessed by transendothelial electrical resistance (TEER) assays.
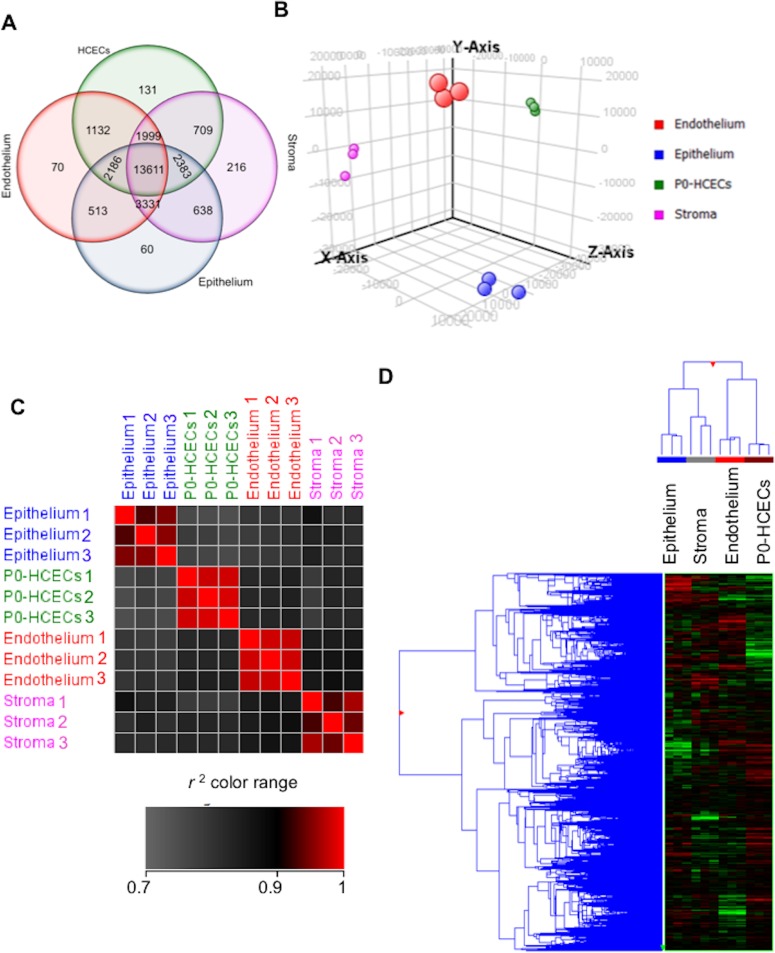
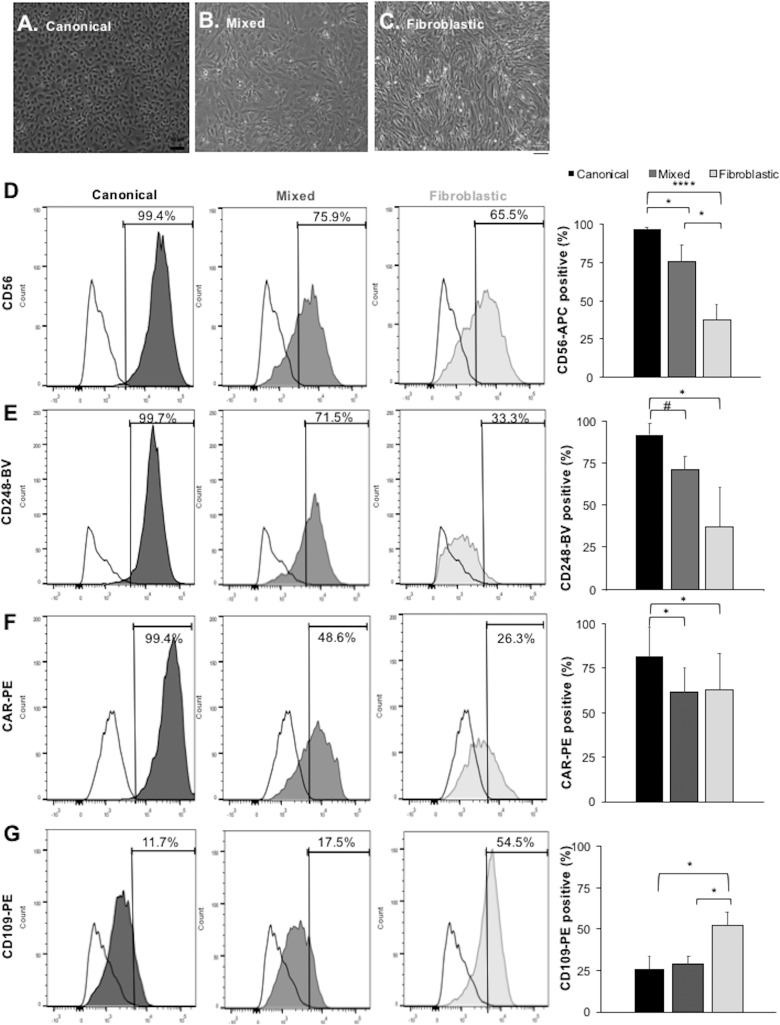
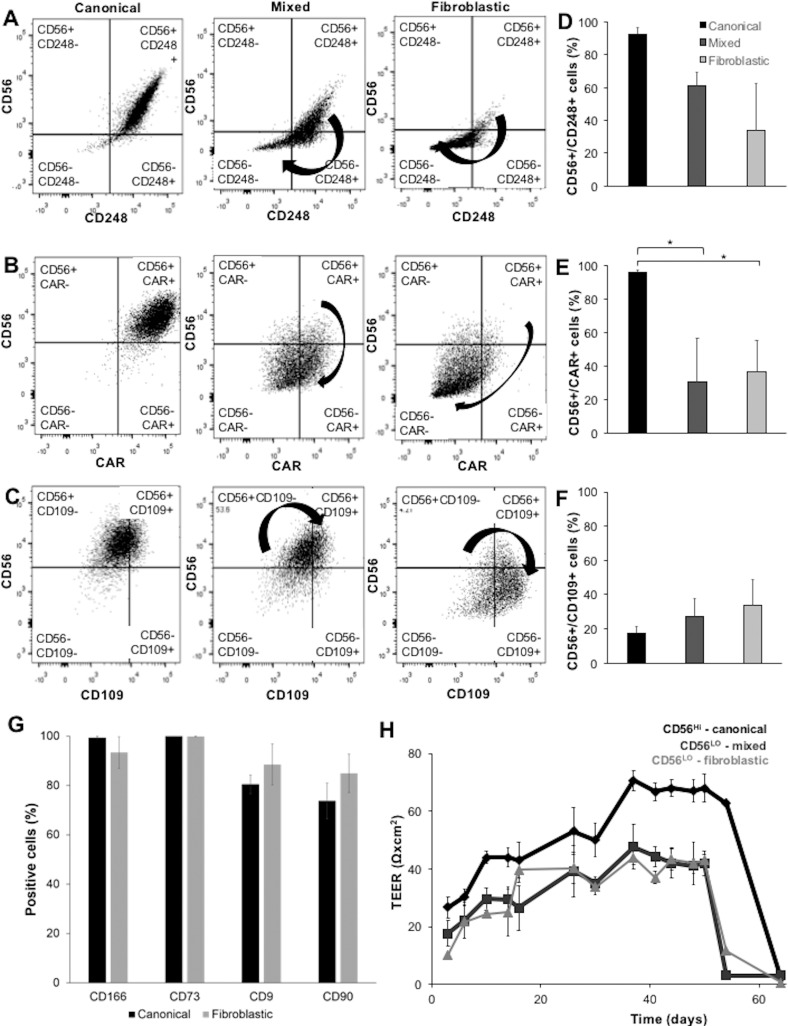
Results: Cultured HCECs demonstrated canonical morphology for up to four passages and later underwent endothelial-to-mesenchymal transition (EnMT). Quality of donor tissue influenced cell measures in culture including proliferation rate. Cultured HCECs expressed identity markers, and microarray analysis revealed novel endothelial-specific markers that were validated by flow cytometry. Finally, canonical HCECs expressed higher levels of CD56, which correlated with higher TEER than fibroblastic HCECs.
Conclusions: In vitro expansion of HCECs from cadaveric donor corneas yields functional cells identifiable by morphology and a panel of novel markers. Markers described correlated with function in culture, suggesting a basis for cell therapy for corneal endothelial dysfunction.
Figures


Similar articles
-
A Cell Culture Approach to Optimized Human Corneal Endothelial Cell Function.Invest Ophthalmol Vis Sci. 2018 Mar 1;59(3):1617-1629. doi: 10.1167/iovs.17-23637. Invest Ophthalmol Vis Sci. 2018. PMID: 29625488 Free PMC article.
-
Cell surface markers of functional phenotypic corneal endothelial cells.Invest Ophthalmol Vis Sci. 2014 Nov 11;55(11):7610-8. doi: 10.1167/iovs.14-14980. Invest Ophthalmol Vis Sci. 2014. PMID: 25389199
-
Propagation of human corneal endothelial cells: a novel dual media approach.Cell Transplant. 2015;24(2):287-304. doi: 10.3727/096368913X675719. Epub 2013 Nov 21. Cell Transplant. 2015. PMID: 24268186
-
[Transplantation of corneal endothelial cells].Nippon Ganka Gakkai Zasshi. 2002 Dec;106(12):805-35; discussion 836. Nippon Ganka Gakkai Zasshi. 2002. PMID: 12610838 Review. Japanese.
-
Corneal endothelial regeneration and tissue engineering.Prog Retin Eye Res. 2013 Jul;35:1-17. doi: 10.1016/j.preteyeres.2013.01.003. Epub 2013 Jan 23. Prog Retin Eye Res. 2013. PMID: 23353595 Review.
Cited by
-
Towards Clinical Application: Calcium Waves for In Vitro Qualitative Assessment of Propagated Primary Human Corneal Endothelial Cells.Cells. 2024 Dec 5;13(23):2012. doi: 10.3390/cells13232012. Cells. 2024. PMID: 39682760 Free PMC article. Review.
-
Transplantation of human induced pluripotent stem cell-derived neural crest cells for corneal endothelial regeneration.Stem Cell Res Ther. 2021 Mar 29;12(1):214. doi: 10.1186/s13287-021-02267-z. Stem Cell Res Ther. 2021. PMID: 33781330 Free PMC article.
-
A Framework for Human Corneal Endothelial Cell Culture and Preliminary Wound Model Experiments with a New Cell Tracking Approach.Int J Mol Sci. 2023 Feb 3;24(3):2982. doi: 10.3390/ijms24032982. Int J Mol Sci. 2023. PMID: 36769303 Free PMC article.
-
Challenges in corneal endothelial cell culture.Regen Med. 2021 Sep;16(9):871-891. doi: 10.2217/rme-2020-0202. Epub 2021 Aug 12. Regen Med. 2021. PMID: 34380324 Free PMC article. Review.
-
Use of biomaterials in corneal endothelial repair.Ther Adv Ophthalmol. 2021 Dec 23;13:25158414211058249. doi: 10.1177/25158414211058249. eCollection 2021 Jan-Dec. Ther Adv Ophthalmol. 2021. PMID: 34988369 Free PMC article. Review.
References
-
- Murphy C,, Alvarado J,, Juster R,, Maglio M. Prenatal and postnatal cellularity of the human corneal endothelium. A quantitative histologic study. Invest Ophthalmol Vis Sci. 1984; 25: 312–322. - PubMed
-
- Joyce NC,, Harris DL,, Mello DM. Mechanisms of mitotic inhibition in corneal endothelium: contact inhibition and TGF-beta2. Invest Ophthalmol Vis Sci. 2002; 43: 2152–2159. - PubMed
-
- Bahn CF,, Glassman RM,, MacCallum DK,, et al. Postnatal development of corneal endothelium. Invest Ophthalmol Vis Sci. 1986; 27: 44–51. - PubMed
-
- Bourne WM,, Nelson LR,, Hodge DO. Central corneal endothelial cell changes over a ten-year period. Invest Ophthalmol Vis Sci. 1997; 38: 779–782. - PubMed
-
- Gipson IK. Age-related changes and diseases of the ocular surface and cornea. Invest Ophthalmol Vis Sci. 2013; 54:ORSF48–ORSF53. - PubMed
Publication types
MeSH terms
Substances
Grants and funding
LinkOut - more resources
Full Text Sources
Other Literature Sources
Medical
Research Materials
